Vol. 19:40-46, 2005
Comparison of Glaucomatous Parameters in Normal, Ocular Hypertensive and Glaucomatous Eyes Using
Optical Coherence Tomography 3000
Myung Geun Choi, MD
1, Min Han, MD
1, Young Il Kim, MD
1,3, Joo Haw Lee, MD
2Department of Ophthalmology, Inje University Busan Paik Hospital
1, Busan, Korea Department of Ophthalmology, Inje University Sanggye Paik Hospital
2, Seoul, Korea
Inje University Ophthalmology Research Foundation
3, Busan, Korea
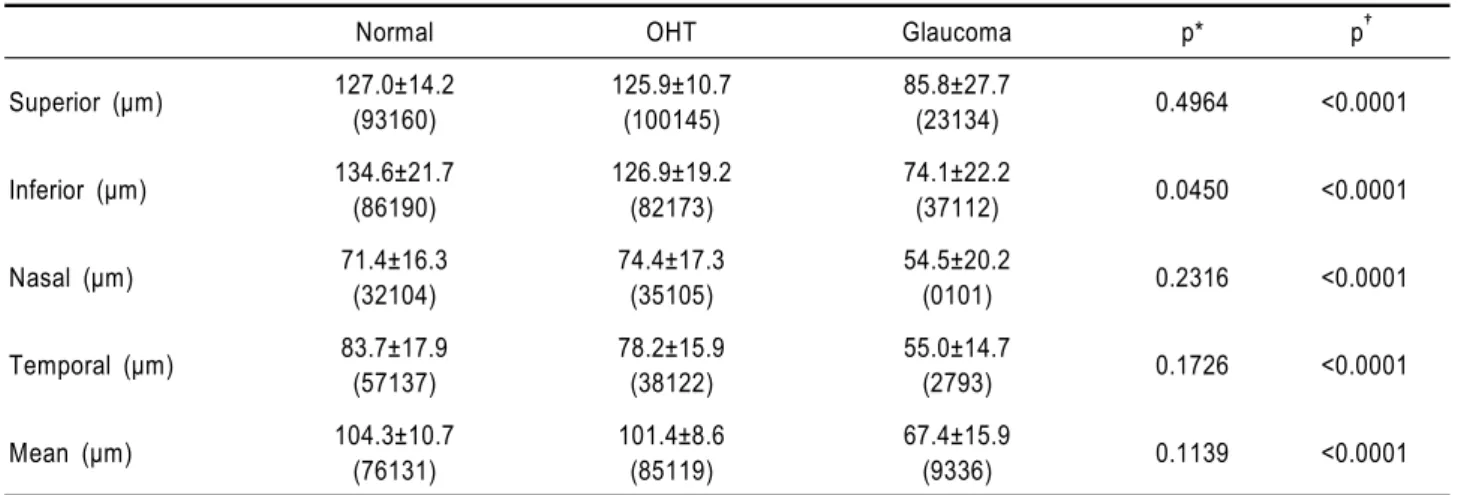
This study was performed to evaluate optic disc appearance, retinal nerve fiber layer (RNFL) thickness, and macular thickness in normal, ocular hypertensive (OHT) and glaucomatous eyes using optical coherence tomography (OCT) 3000. One hundred fifty-eight eyes of 167 consecutive subjects were enrolled: 60 normal, 53 OHT, and 54 glaucomatous. OCT topographic parameters of cup diameter, cup area, rim area, and cup/disc area ratio were significantly less in OHT eyes than in normal eyes and were significantly less in glaucomatous eyes than in normal and OHT eyes. RNFL was significantly thinner in OHT eyes than in normal eyes in the inferior quadrant, and in glaucomatous eyes than in OHT and normal eyes in the mean and for all four quadrants. Macular thickness was significantly thinner in glaucomatous eyes than in OHT and normal eyes throughout all subdivisions. Optic disc parameters, and RNFL and macular thickness measurements made with OCT may be useful in the clinical assessment of glaucoma.
Key words: Macular thickness, Optical coherence tomography, Optic disc parameter, Retinal nerve fiber layer thickness
Reprint requests to Young Il Kim, MD. Department of Ophthal- mology, InJe University College of Medicine, Busan Paik Hospital,
#633-165 Kekum-dong, Busanjin-gu, Busan 614-735, Korea. Tel:
82-51-890-6016, Fax: 82-51-890-6329, E-mail: [email protected] This work was supported by Grant from Inje University, 2003.
Presented at the 90th symposium supported by the Korean ophthalmological society, Seoul, Korea, October 2003.
Glaucomatous optic nerve damage appears not only as the morphological change of the optic disc but also as the reduction of the thickness of the retinal nerve fiber layer (RNFL), and the defect of the optic nerve axon causes the RNFL thinning that has been known to be developed earlier than the morphological change of the optic disc and the change of the vision.
1,2,3In addition, Zeimer et al
4have reported that glaucomatous field defect is closely associated with thinning of the macula, and in 34% of early glaucoma patients, it caused a clear thinning of the posterior retina. In glaucoma patients, such alteration of the thickness of the
retina nervous fiber and of the macula may appear prior to vision defects caused by optic nerve defects, and thus the assessment of such alteration has recently become of help in the early diagnosis of glaucoma.
The optical coherence tomography OCT 3000 (OCT,
Zeiss, Germany) is an instrument that uses ultrared radiation
with a resolution of approximately 10 µm to measure the
difference of the time of light reflection from different
depths of tissue by optical interferometer. Although it is
slightly influenced by refractive power, it measures
objectively, without contact, and non-invasively RNFL and
macular thicknesses, as well as various parameters of the
optic nerve disc. The advantages of this OCT instrument, in
comparison with the test results obtained by conventional
ophthalmoscopy, are 3-dimensional imaging of the optic
nerve disc and the retinal optic nerve layer, etc., by
minimizing the subjective determination of examiners and
quantitating the result values. This allows accurate diagnosis,
assessment of progression, and prognosis.
We used OCT to measure various parameters of the optic disc of glaucomatous eyes, and the thickness of RNFL and the macula in normal eyes and ocular hypertension (OHT) eyes. We performed comparative analysis of their correlation to assess the clinical usefulness of the data obtained by OCT.
MATERIALS AND METHODS
This study was performed in the Department of Ophthalmology, Inje University Busan Paik Hospital, Busan, Korea, from January to August, 2003, on 60 eyes of 60 normal individuals who gave informed consent and applied for the study, 35 eyes of 35 OHT cases who were under follow up observation at our glaucoma clinics, and 54 eyes of 38 glaucoma cases.
The definition of normal eye was the absence of any other eye diseases, the corrected vision of over 1.0 by Hahn's visual acuity chart, the spherical equivalent on refraction of within±5.0 diopters, the result of gonioscopy of an open angle, ocular tension measured for a minimum of 2 times of lower than 21 mmHg, the cup-disc ratio in ophthalmography and 3-dimensional optical disc imaging of less than 0.6 or the difference of the vertical cup-disc ratio of less than 0.2, normal result from the glaucoma Hemifield test by Humphrey’s automated perimetry performed more than 2 times, and the corrected pattern standard deviation (CPSD) of within 95 % of normal range. OHT was defined as ocular tension measurement for more than a minimum of 2 times of over 21 mmHg, the absence of any change to the glaucomatous optic disc, and the absence of any glaucomatous defect by Humphrey’s automated perimetry.
The glaucoma group was defined as an open angle result in gonioscopy, ocular tension measurement of more than 2 times of over 21 mmHg, the cup-disc ratio in ophthal- mography and on 3-dimensional optical disc imaging of over 0.6 or the cup-disc ratio of both eyes of over 0.2, local or general loss or notching of the optical nerve disc ring, hemorrhage, glaucoma Hemifield test by Humphrey’s automated perimetry of beyond 99% of normal range more than 2 times, or the CPSD beyond 95% of normal range.
Exclusion criteria were unstable gaze during OCT test, vertical diameter of the optic nerve disc of less than 1 mm or over 3 mm, and normal ocular pressure glaucoma cases.
OCT test fixes the macula and thus suppresses eye
movements by blinking at an aimed beam. The internal fixation method that fixes the testing eye was used to measure the parameters of the optical nerve disc by focusing on the optic nerve disc. At 30 degrees intervals, 6 radiation doses of 4 mm in diameter were applied, and the Optic Nerve Head (ONH) analysis system was used to measure the disc diameter, cup diameter, disc area, cup area, nerve rim area, and cup/disc area ratio. To measure the RNFL thickness, circular radiation doses of 3.4 mm in diameter were applied focused on the optic nerve disc. Using RNFL thickness average analysis system, the results were divided into 12 fractions at 30-degree intervals. The values of superior, inferior, nasal, and temporal RNFL thicknesses and their averages were used as parameters. Finally, to measure the thickness of the macula, 6-mm thick radiation doses were focused on the macula and the results were measured by dividing into 9 areas containing 3 circles each by using the Retinal map analysis system. Each circle was formed by a 1-mm diameter central circle, an inner ring of 3 mm diameter, and an outer ring of 6 mm diameter. The thickness of the macula was measured by dividing the inner ring and the outer ring into 4 areas: the superior, inferior, nasal, and temporal quadrants.
To compare the three groups, normal, OHT and glaucoma, SAS 8.1 statistical program was used and ANOVA test was performed. To obtain significant parameters of each group, t-test was used. In the parameter analysis, a p value less than 0.05 was considered as statistically significant.
RESULTS
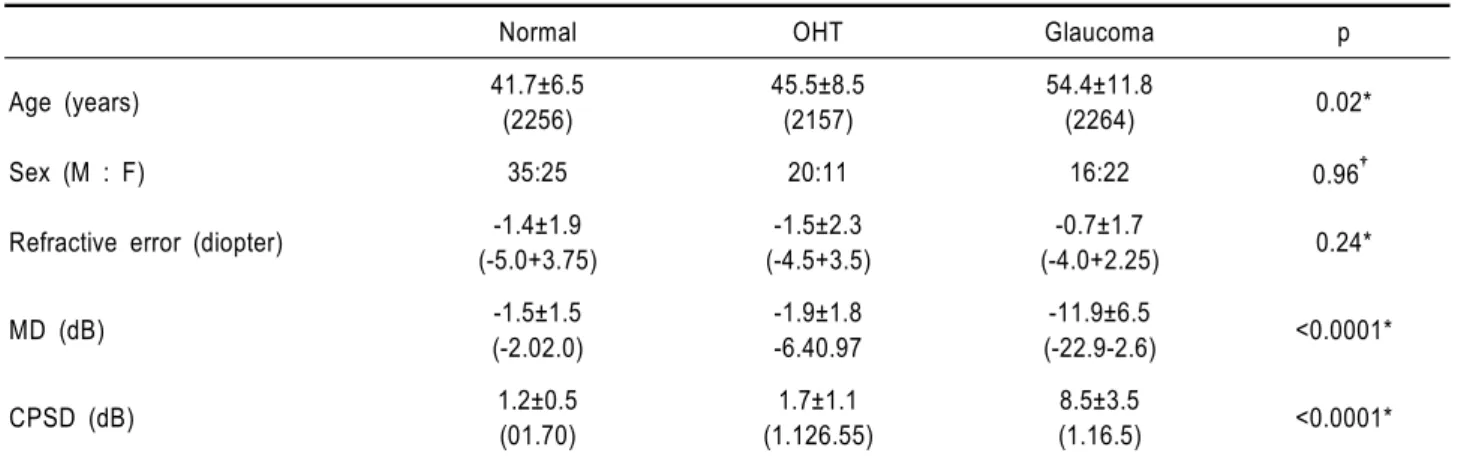
The normal group comprised 60 cases (60 eyes), 35 male and 25 female, and their average age was 41.7±6.5 (22- 56) years. The OHT group comprised 35 cases (53eyes), 22 male and 13 female, and their mean age was 45.5±8.5 (21- 57) years. The glaucoma group comprised 38 cases (54 eyes), 16 male and 22 female, and the mean age was 54.4±
11.8 (22-64) years. In regard to gender and refractive index,
a significant difference between the three groups was not
detected. However, in regard to their age, a significant
difference among the three groups was detected. In
Humphrey automated perimetry, there was a statistically
significant difference in mean deviation (MD) and CPSD
(Table 1).
Normal OHT Glaucoma p* p
†Disk diameter (mm) 1.94±0.30
(1.172.75)
1.93±0.47 (1.442.81)
1.98±0.33
(1.142.66) 0.9135 0.7831
Cup diameter (mm) 0.65±0.41 (01.33)
1.12±0.42 (01.97)
1.53±0.34
(0.782.35) <0.0001 <0.0001
Disc area (mm2) 2.47±0.41
(1.453.38)
2.78±0.64 (1.533.98)
2.78±0.60
(1.974.40) 0.7516 0.5611
Cup area (mm2) 0.76±0.60
(0.083.37)
1.38±0.64 (0.342.67)
1.97±0.67
(0.563.50) <0.0001 <0.0001
Rim area (mm2) 1.72±0.51
(022.64)
1.40±0.32 (0.852.11)
0.81±0.46
(0.101.64) <0.0001 <0.0001
C/D area ratio 0.29±0.21
(0.041.00)
0.48±0.15 (0.170.74)
0.69±0.18
(0.260.95) <0.0001 <0.0001 OCT: optical coherence tomography, OHT: ocular hypertension, p*: corresponding pairs: normal and OHT, p
†: corresponding pairs: normal/OHT and glaucoma.
Table 2. Mean value of optic nerve head parameter in OCT
Normal OHT Glaucoma p
Age (years) 41.7±6.5
(2256)
45.5±8.5 (2157)
54.4±11.8
(2264) 0.02*
Sex (M : F) 35:25 20:11 16:22 0.96
†Refractive error (diopter) -1.4±1.9 (-5.0+3.75)
-1.5±2.3 (-4.5+3.5)
-0.7±1.7
(-4.0+2.25) 0.24*
MD (dB) -1.5±1.5
(-2.02.0)
-1.9±1.8 -6.40.97
-11.9±6.5
(-22.9-2.6) <0.0001*
CPSD (dB) 1.2±0.5
(01.70)
1.7±1.1 (1.126.55)
8.5±3.5
(1.16.5) <0.0001*
Data are mean±standard deviation.
OHT: ocular hypertension, MD: mean deviation, CPSD: corrected pattern standard deviation.
*by analysis of variance.
†