Introduction
Glaucoma is defined by characteristic structural changes in the optic disc and retinal nerve fiber layer (RNFL), with ac- companying functional deficit in the visual field (VF). Because glaucomatous damage is irreversible, monitoring of disease progression is of paramount importance for the management of the disease. Optic disc and RNFL evaluations are routinely used to detect glaucoma-induced structural changes. As these
assessments are qualitative and rather subjective, optical co- herence tomography (OCT), which can provide objective and quantitative optic disc and RNFL measurements, has been used in clinical practice worldwide.1-9
OCT can provide measurements of the peripapillary RNFL (pRNFL) and macular thickness, as well as optic nerve head (ONH) parameters. pRNFL thickness is the most commonly used diagnostic indicator of glaucoma. However, macular thickness and optic disc parameters are also considered impor- tant for the assessment of glaucoma-induced structural chang- es.8-15 Most OCT instruments provide a diagnostic classifica- tion such as ‘normal, borderline, or abnormal’, by comparing the patient’s measurements with data from normal subjects.
However, there are no generally accepted guidelines for which parameter should be assessed when using OCT as a tool for detecting glaucomatous structural progression.
Glaucoma Progression Detection Using Spectral Domain OCT Driven Parameters
Seung Hee Baek, PhD
1, Jung Hwa Na, MD
2, Jong Rak Lee, MD
2, Kyoung Sub Lee, MD
2, Kyung Rim Sung, MD, PhD
21Department of Clinical Epidemiology and Biostatistics, College of Medicine, University of Ulsan, Asan Medical Center, Seoul, Korea.
2Department of Ophthalmology, College of Medicine, University of Ulsan, Asan Medical Center, Seoul, Korea.
Purpose: We intended to determine the most favorable method for detecting the progression of glaucoma with various parameters provided by spectral-domain optical coherence tomography (SD-OCT; Cirrus HD-OCT), using a latent class regression analysis (LCA) model.
Methods: This was an observational cohort study. Subjects with glaucoma who had undergone at least 5 qualified serial SD-OCT exams (mean follow-up time: 2.9 years) were enrolled. Progression of the disease was assessed based on 5 SD-OCT parameters: linear regression analysis of the optic disc rim area (LRA), peripapillary retinal nerve fiber layer thickness (LRNFL), and macular thickness (LMA), and change in classification of peripapillary retinal nerve fiber layer (NCRNFL) and macular thickness (NCMA) when compared to normative database. The sensitivity and specificity of each parameter were obtained from an LCA model incorporating these 5 parameters. Progression of the disease was also determined by assessment of optic disc/RNFL photographs and visual field (VF) examinations.
Results: Of 163 eyes, 26 showed disease progression by LRA, 40 by LMA, 33 by LRNFL, 21 by NCMA and 13 by NCRNFL. Based on the LCA model, the sensitivities of each of the 5 methods for progression detection were 39.7%, 64.4%, 54.2%, 27.8%, and 28.3%, respectively, while specificity ranged from 84.8 % to 96.8%. LRNFL (33.3%) and LMA (25.0%) had the highest sensitivities when determined by optic disc/RNFL photographs and VF examination, respectively.
Conclusions: Serial analysis of macular and peripapillary RNFL thickness values over time is more sensitive than detection of normative classification changes.
Key words: Glaucoma; Progression; Spectral domain optical coherence tomography; visual field; retinal nerve fiber layer thickness
Received: 2015. 3. 5. Revised: 2015. 4. 10.
Accepted: 2015. 5. 10.
Corresponding Author: Kyung Rim Sung, MD, PhD
Department of Ophthalmology, University of Ulsan, College of Med- icine, Asan Medical Center, 88 Olympic-ro 43-gil, Songpa-gu, Seoul 138-736, Korea
Tel: +82-2-3010-3680, Fax: +82-2-470-6440 E-mail: [email protected]
Latent class analysis model (LCA) is a statistical method for identifying subtypes of related cases (latent classes) in multi- variate categorical data. It is used to predict a dependent vari- able as a function of predictors, which includes an m-category latent variable and each category representing a homogeneous population (class, segment, etc). It assumes that the population is composed of subpopulations (latent classes), which are not directly observed but inferred from the observed diagnostic characteristics of individuals. For many diseases no absolute gold standard is achievable in realistic terms, i.e. there are no tests available with perfect sensitivity and specificity, hence the true disease status remains latent. Clearly, misclassifications of the reference test translate into biased assessment of sensitivity and specificity. The lack of need for a gold standard is the most important reason for preferring LCA. In addition, one can determine whether certain simple rules for diagnosis are rea- sonable. Therefore, we used LCA to identify groups of individ- uals, with similar diagnosis based on several spectral domain (SD)- OCT provided parameters. The latent variable is true disease status in medical diagnosis context; while this is often dichotomous (disease present or absent), it may not be (e.g., heart attack, congestive heart failure, or no heart problem). In our application, the latent variable is true status of glaucoma progression. Thus LCA can be used to provide estimates of the diagnostic performance of glaucoma progression (sensitivity, specificity, etc.) of different SD-OCT parameters. Since there is no gold standard among SD-OCT parameters for detecting glaucoma progression, we aimed to evaluate the performance of various SD-OCT parameters for determining glaucoma pro- gression by use of LCA.
Methods
Subjects
All qualified subjects attending the glaucoma clinic of the Asan Medical Center in Seoul, Korea, were enrolled to this study. Baseline VF and SD-OCT tests were performed at least 2 years before the final follow-up. At the initial examination, each participant received a comprehensive ophthalmologic as- sessment including a review of medical history, measurement of best-corrected visual acuity, slit-lamp biomicroscopy, Gold-
mann applanation tonometry, gonioscopy, dilated fundoscopic examination using a 90- or 78-diopter (D) lens. All participants had stereoscopic optic disc photography, RNFL photography, central corneal thickness measurement (DGH-550 instrument;
DGH Technology Inc., Exton, PA), VF test (Humphrey field analyzer, Swedish Interactive Threshold Algorithm [SITA] 24- 2; Carl Zeiss Meditec, Dublin, CA) and SD-OCT (Cirrus HD OCT; Carl Zeiss Meditec, Dublin, CA).
All participants had to meet the following criteria: 1) best-corrected visual acuity of 20/30 or better, 2) a spherical equivalent refraction within ±5 D, 3) a cylinder correction within +3 D, and 4) presence of a normal anterior chamber and open-angle on slit-lamp and gonioscopic examinations. Glau- comatous eyes were definedas having typical glaucomatous changes in the optic disc (neuroretinal rim thinning, disc ex- cavation, RNFL defect, and/or disc hemorrhage) agreed upon by two glaucoma specialists (KRS, JHN) regardless of VF status. Any subject with any other ophthalmic or neurological conditions that could result in a VF defect, or with a history of diabetes mellitus, was excluded. If surgical or laser treatment was performed during follow-up, only the data obtained in the period before such treatment were analyzed. One eye was randomly chosen for analysis if both eyes met the inclusion criteria.
Institutional Review Board approval was obtained from the Asan Medical Center and the design of the study followed the principles of the Helsinki Declaration.
Optic disc and RNFL assessment
Progression was determined by evaluating stereoscopic optic disc and RNFL photographs. Serial stereoscopic photographs were displayed on an LCD monitor. Three glaucoma experts (KRS, JRL, and KSL) independently assessedthe photographs to estimate if progression of the disease had occurred between the first and last visit. The experts weremasked to clinical, SD-OCT, and VF information. Photographs were presented in chronological order; patient identification, age and test date were not provided. Theexperts viewed the entire set of pho- tographs of each eye beforemaking an assessment and were asked to decide if there had been optic disc or RNFLprogres- sion, which included an increase in neuroretinal rim thinning,
widening or deepening of an RNFL defect and/or the appear- ance of a new disc hemorrhage. Eyes were classified as ‘stable’
‘progressors’ or ‘undetermined’. The majority opinion among the experts was used as the “gold standard” in our current study. If the three experts all differed, a consensus was reached after discussion. Eyes classified as ‘undetermined’ were ex- cluded from the final analysis.
VF assessment
Only reliable VF test results (false-positive errors <15%, false-negative errors <15%, and fixation loss <20%) were included in the analysis. At baseline examination, VF was re- peated within 2 weeks for confirmation. The first VF test result was excluded to eliminate any learning effect. For inclusion in the analysis, at least five VF examinations (except for first VF), performed at different visits, were required.
VF progression was determined by two methods: event-based analysis (EA) and trend-based analysis (TA) both of which are included in the guided progression analysis provided by Hum- phrey field analyzer software. VF EA progression was defined as asignificant deterioration from the baseline pattern in three or more of the same test points appearing in three consecutive examinations.16
TA was computed using regression analysis of visual field index (VFI) data. A statistically significant negative slope (p <
0.05) indicated VF TA progression. Eyes showing progression by either EA or TA were considered as having undergone pro- gression.
SD-OCT assessment
SD-OCT images were obtained using a Cirrus HD-OCT sys- tem. The image acquisition procedure has been described in detail elsewhere.4,5 All qualified images were centered on the optic disc or fovea, well-focused with even and adequate illu- mination. Images had a signal strength ≥6, contained correctly identified vitreo-retinal surfaces in the peripapillary RNFL Extracted B-scan and Optic nerve Extracted B-scan, with no horizontal eye motion in the en-face image and properly iden- tified Bruch’s membrane termination. At least 5 acceptable OCT images, taken on separate visits, were required for a pa- tient to be included in the study.
Using the Cirrus HD-OCT system, ONH parameters and pRNFL thickness measurements were obtained in optic disc cube mode, and macular thickness measurements in macular cube mode. Among the various parameters of each pRNFL, macular and ONH measurement, average pRNFL thickness, average macular thickness, and rim area, respectively, were used for the present analysis. Rate of change for each eye was determined by linear regression of these parameters with subject’s age. A significant negative slope (p < 0.05) indicated progression.
For each pRNFL and macular thickness parameter, compar- isons with normative classifications are given as part of the operating system. Normative classifications for the ONH pa- rameters are not included in the current operating version. For pRNFL thickness, four categories are defined: hypernormal (shown in white on thickness maps, 95th to 100th percentiles), normal (green, 5th to 95th percentiles), borderline (yellow, 1st to 5th percentiles) and abnormal (red, below the 1st percentile).
For macular thickness, 5 categories are used: (excessively hypernormal (pink, 99th and 100th percentiles), hypernormal (light yellow, 95th to 99th percentiles), normal (green, 5th to 95th percentiles), borderline (yellow, 1st to 5th percentiles borderline) and abnormal (red, below the 1st percentile). Eyes classified as
“excessively hypernormal” in any sector were excluded from the analysis. Worsening of the normative classification for av- erage pRNFL and macular thickness (compared with baseline) in two consecutive visits was considered as progression.
Therefore, a total of 5 parameters (linear regression analysis of average pRNFL thickness (LRNFL), average macular thick- ness (LMA) and rim area (LRA), change of normative classi- fication in average pRNFL thickness (NCRNFL) and macular thickness (NCMA)) were incorporated into the LCA to deter- mine the preferred strategy for indicating OCT progression in glaucoma.
Statistical analysis
For the current study, we used a LCA to define the true un- observed (latent) outcome. We fitted the model by increasing the number of latent classes and obtained a suitable fit with a simple two-class model, which returns the minimum of the Bayesian information criterion (BIC). In practice, we do not
know the correct number of latent classes in the model. The number of latent classes needs to be investigated. We can assess whether we have chosen the right number of classes.
The appropriate number of classes was selected using the BIC (2-classes=1284.867, 3-classes=1313.06, 4-class=1341.913, 5-class=1371.779). Those tests suggest that two classes are suf- ficient. The data were consistent with a simple 2-class model, where the classes represented those with and without glaucoma progression. Two-class model fitted our clinical expectations and diagnostic perspective. Thus, each class represented those with and without glaucoma progression. The latent class results were used to estimate the prevalence of progression, and the sensitivity and specificity of each parameter-based diagnosis, such as LRNFL, LMA, LRA, NCMA, and NCRNFL. The confidence intervals for sensitivity and specificity were com- puted from 1,000 bootstrapped samples.
In order to put the outcome of the LCA in more commonly used perspective, we also used conventional methods and com- pare the outcome. In other words, the sensitivity and specificity of each of the 5 parameters for detecting progression were also calculated by using either optic disc/RNFL photography or VF progression as reference standards. The R packages poLCA and boot were used for LCA and bootstrapping in R version 2.14.1. Other statistical analyses were performed using SPSS version 15.0 (SPSS Inc., Chicago, IL) and MedCalc version 9.6 (Mariakerke, Belgium).
Results
One hundred sixty-three eyes from 163 glaucomatous sub- jects, consisting of 80 men and 83 women (all Koreans), were included in the analysis. Mean (± standard deviation) follow-up period was 2.9 ± 0.4 years. Mean baseline age of participants was 56.3 ± 11.6 years. Baseline VF mean deviation was -3.3 ± 5.4 dB; baseline SD-OCT average pRNFL was 80.6 ± 14.1µm, macular thickness was 270.0±16.3µm and rim area was 0.92 ± 0.28 mm2.
Of the 163 eyes, 26 were classified as showing glaucoma progression by the presence of statistically significant slope of LRA, 40 by LMA, and 33 by LRNFL. Twenty-one eyes were defined as progressors using by NCMA criterion and 13 by NCRNFL criterion.
Sensitivity and specificity determined by LCA
LCA estimates what class each patient belongs to given the probability that the person belongs to the first, or second class.
Individuals were allocated to the groups for which they had the highest membership probability. Proportion for each latent class memberships, which we can say ‘prevalence of each la- tent class,’ was estimated based on their most likely latent class membership. Given that, LCA model suggested that 81% of the subjects are non-progressive patients, while 19% are progres- sive patients.
Overall, 39.7%, 64.4%, 54.2%, 27.8% and 28.3% of patients were classified as progressing by LRA, LMA, LRNFL,
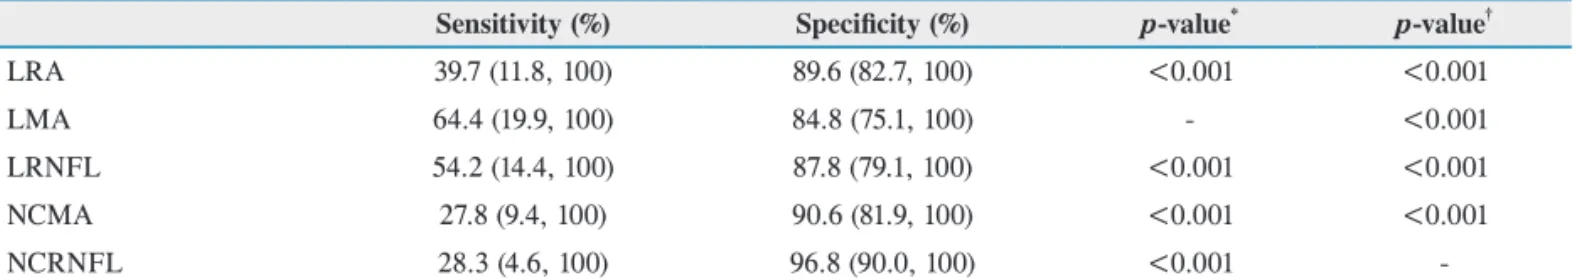
Table 1. Sensitivities and specificities (95% confidence intervals) of spectral-domain optical coherence tomography parameters deter- mined from the latent class analysis model
Sensitivity (%) Specificity (%) p-value* p-value†
LRA 39.7 (11.8, 100) 89.6 (82.7, 100) <0.001 <0.001
LMA 64.4 (19.9, 100) 84.8 (75.1, 100) - <0.001
LRNFL 54.2 (14.4, 100) 87.8 (79.1, 100) <0.001 <0.001
NCMA 27.8 (9.4, 100) 90.6 (81.9, 100) <0.001 <0.001
NCRNFL 28.3 (4.6, 100) 96.8 (90.0, 100) <0.001 -
LRNFL = linear regression analysis of average peripapillary RNFL thickness; LMA = linear regression analysis of average macular thickness; LRA = linear regression analysis of rim area; NCRNFL = change of normative classification in average peripapillary RNFL thickness; NCMA = change of normative classification in macular thickness.
*Difference of sensitivity between LMA (highest sensitivity) and each parameter.
†Difference of specificity between NCRNFL (highest specificity) and each parameter.
p-values were calculated using a Wilcoxon signed rank test for boot strapped sample difference.
NCRNFL and NCMA, respectively. The sensitivity, specificity and confidence intervals for each parameter were estimated from the model (Table 1). LMA had the highest sensitivity of all the parameters for detecting progression, and the sensitivity of NCRNFL and NCMA were considerably lower. Specificities ranged from 84.8 to 96.8% across all parameters.
Sensitivity and specificity when using assessment of optic disc and RNFL photographs as a reference standard
According to the optic disc/RNFL photographic assessment by experts, 24 eyes (14.7%) showed progression of glaucoma.
LMA and LRNFL had higher sensitivities (20.8 and 25.0%) than the other parameters, but overall the sensitivities were poor. Specificity ranged from 74.8 to 92.1% (Table 2).
Sensitivity and specificity when using VF assessment as a reference standard
According to VF assessment, a total of 24 eyes (14.7%) were classified as showing progression with either or both event and trend analysis. Macular thickness had the highest sensitivity with overall poor sensitivity across all parameters with speci- ficity ranging between 77.4 to 92.5% (Table 3).
Discussion
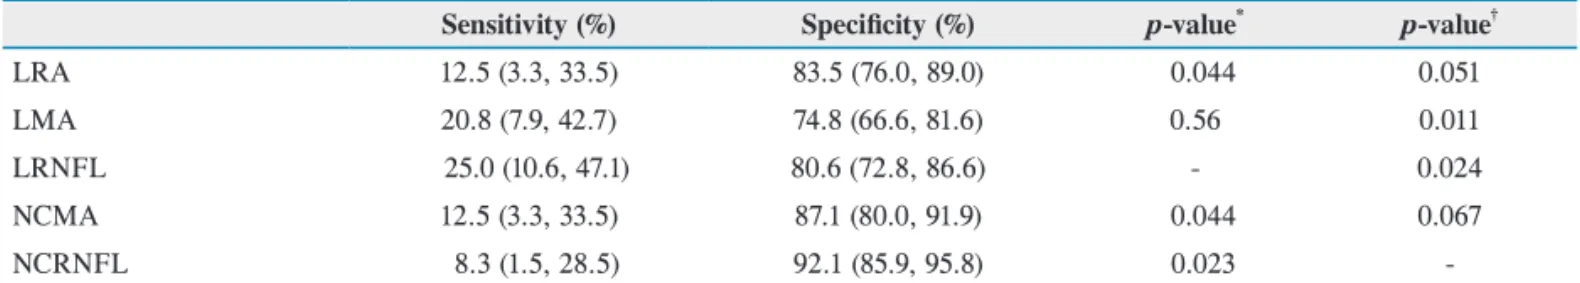
Detection of changes in optic disc or RNFL has been the gold standard for evaluating structural glaucomatous progres- sion. However, these assessments inevitably vary between examiners17,18 and require relatively large changes in order to be detected. Imaging with OCT addresses these limitations by providing micron-scale quantification of the optic disc, RNFL Table 2. Sensitivities and specificities (95% confidence intervals) of spectral-domain optical coherence tomography parameters when using optic disc/ retinal nerve fiber layer photographic assessment as a reference standard
Sensitivity (%) Specificity (%) p-value* p-value†
LRA 12.5 (3.3, 33.5) 83.5 (76.0, 89.0) 0.044 0.051
LMA 20.8 (7.9, 42.7) 74.8 (66.6, 81.6) 0.56 0.011
LRNFL 25.0 (10.6, 47.1) 80.6 (72.8, 86.6) - 0.024
NCMA 12.5 (3.3, 33.5) 87.1 (80.0, 91.9) 0.044 0.067
NCRNFL 8.3 (1.5, 28.5) 92.1 (85.9, 95.8) 0.023 -
LRNFL = linear regression analysis of average peripapillary RNFL thickness; LMA = linear regression analysis of average macular thickness; LRA = linear regression analysis of rim area; NCRNFL = change of normative classification in average peripapillary RNFL thickness; NCMA = change of normative classification in macular thickness.
*Difference of sensitivity between LRNFL (highest sensitivity) and each parameter.
†Difference of specificity between NCRNFL (highest specificity) and each parameter.
p-values were calculated using a McNemar test.
Table 3. Sensitivities and specificities (95% confidence intervals) of spectral-domain optical coherence tomography parameters with visual field examination as reference standard
Sensitivity (%) Specificity (%) p-value* p-value†
LRA 20.0 (8.4, 39.1) 85.0 (77.5, 90.4) 0.17 0.067
LMA 33.3 (17.9, 52.9) 77.4 (69.2, 84.0) - 0.029
LRNFL 16.7 (6.3, 35.5) 78.9 (70.8, 85.3) 0.035 0.033
NCMA 23.3 (10.6, 42.7) 89.5 (82.7, 93.9) 0.42 0.16
NCRNFL 10 (2.6, 27.7) 92.5 (86.3, 96.1) 0.022 -
LRNFL = linear regression analysis of average peripapillary RNFL thickness; LMA = linear regression analysis of average macular thickness; LRA = linear regression analysis of rim area; NCRNFL = change of normative classification in average peripapillary RNFL thickness; NCMA = change of normative classification in macular thickness.
*Difference of sensitivity between LMA (highest sensitivity) and each parameter.
†Difference of specificity between NCRNFL (highest specificity) and each parameter.
p-values were calculated using a McNemar test.
and macular regions. Although both optic disc and RNFL assessment and OCT measurements are frequently employed for diagnosis of glaucoma, we found that these strategies did not agree well. Our results also confirmed the poor sensitivity of OCT parameters when using optic disc and RNFL photo- graphic assessments as gold standards.19 The poor agreement between optic disc and RNFL assessment and OCT measure- ments, as reflected by the low sensitivity, suggests that subjec- tive optic disc/RNFL assessment may be a poor ‘gold standard’ or these the two strategies, optic disc/RNFL assessment and OCT measurements may need to be used together to facilitate detection of glaucomatous progression.
To evaluate the various OCT parameters for detecting glauco- ma progression, we obtained their sensitivities and specificities by two approaches. Assuming there is no reference standard among the OCT parameters for detecting glaucomatous pro- gression, we used LCA to obtain the diagnostic sensitivity and specificity of each parameter. In addition, we used traditional progression detection methodologies such as optic disc and RNFL assessment along with VF assessment to calculate the sensitivity and specificity of each OCT parameter.
When assessed by LCA, linear regression analysis of macular thickness had the greatest sensitivity of the 5 parameters ana- lyzed across all tested parameters although specificity is lower.
Linear regression analysis of pRNFL thickness had the second highest sensitivity. One possible explanation for the greater sensitivity of macular thickness is that the macula is normally approximately three times thicker than the RNFL so that any change as disease progresses is greater, and more easily detect- ed by linear regression analysis. Higher reliability of macular measurments in term of the segmentation analysis that works better on full macular thickness compare to RNFL and macula measurement may be less affect by motion artifacts compared to the RNFL because macular scan is performed through cen- tral fixation.
Overall, linear regression analyses of pRNFL and macular thickness were more sensitive for progression detection than the change in normative classification results when analyzed by LCA or by using optic disc and RNFL assessment or VF as reference standards. In clinical practice, normative classifica- tion outcomes facilitate glaucoma diagnosis but change in the
classification is less sensitive for detecting progression than other methods.
Among the SD-OCT parameters obtained by linear regres- sion, LRA was less sensitive than LRNFL or LMA in either LCA or when using optic disc and RNFL assessment as ref- erence standards. We found that linear regression analysis of rim area determined by SD-OCT was not optimal for detecting structural glaucomatous progression.
Overall, the sensitivities and specificities of all the OCT parameters were low when either optic disc and RNFL assess- ment or VF were used as reference standards, which is in line with a previous report.19 When using optic disc and RNFL assessment, LRNFL had similar level of sensitivity to LMA, while LMA was better when using VF as reference standard.
RNFL thinning is reported to precede apparent abnormality in
VF,20,21 which implies that when a glaucomatous eye shows de-
tectible VF progression, RNFL might already occurred with no additional changes at that time. However, the papillomacular bundle in the posterior pole is known to be resistant to glauco- matous structural change until late stages of the disease; hence change in macular thickness may be a more sensitive indicator than change in RNFL thickness when functional damage in VF progresses.12
We found that LMA was more sensitive than LRNFL when using VF as a reference standard. In other words, sensitivity of different OCT parameters changed according to whether optic disc/RNFL assessment or VF test was con- sidered a reference standard. Since optic disc/RNFL change precedes VF progression, our result suggests that different OCT parameters should be used depending on the severity of the glaucoma for progression detection.
In conclusion, when analyzed by LCA modeling using 5 OCT parameters, linear regression analysis of average mac- ular thickness had greater sensitivity than, and lower levels of specificity to, other parameters. On the other hand, optic disc rim area analysis or changes in pRNFL or macular thickness normative classification were not sensitive indi- cator of glaucoma progression. Our study also confirmed that OCT measurements do not show good agreement with optic disc and RNFL photographic assessment or VF ex- amination in terms of detecting glaucomatous progression.
Therefore these different assessment strategies should be used together to complement one another. The OCT meas- ures had different levels of sensitivity depending on whether optic disc and RNFL assessment or VF evaluation was used as reference standard, indicating that different OCT param- eters should be used complementarily for detecting progres- sion.
References
1. Wollstein G, Schuman JS, Price LL, Aydin A, Beaton SA, Stark PC, Fujimoto JG, Ishikawa H. Optical coherence tomography (OCT) macular and peripapillary retinal nerve fiber layer measurements and automated visual fields. Am J Ophthalmol 2004;138:218–25.
2. Medeiros FA, Zangwill LM, Bowd C, Vessani RM, Su- sanna R Jr, Weinreb RN. Evaluation of retinal nerve fiber layer, optic nerve head, and macular thickness measure- ments for glaucoma detection using optical coherence tomography. Am J Ophthalmol 2005;139:44-55.
3. Burgansky-Eliash Z, Wollstein G, Chu T, Ramsey JD, Glymour C, Noecker RJ, Ishikawa H, Schuman JS. Opti- cal coherence tomography machine learning classifiers for glaucoma detection: a preliminary study. Invest Ophthal- mol Vis Sci 2005;46:4147-52.
4. Sung KR, Kim DY, Park SB, Kook MS. Comparison of retinal nerve fiber layer thickness measured by Cirrus HD and Stratus optical coherence tomography. Ophthalmology 2009; 116:1264-70.
5. Park SB, Sung KR, Kang SY, Kim KR, Kook MS. Com- parison of glaucoma diagnostic Capabilities of Cirrus HD and Stratus optical coherence tomography. Arch Ophthal- mol 2009;127:1603-9.
6. Sung KR, Kim JS, Wollstein G, Folio L, Kook MS, Schuman JS. Imaging of the retinal nerve fibre layer with spectral domain optical coherence tomography for glau- coma diagnosis. Br J Ophthalmol 2011;95:909-14.
7. Sung KR, Kim S, Lee Y, Yun SC, Na JH. Retinal nerve fi- ber layer normative classification by optical coherence to- mography for prediction of future visual field loss. Invest Ophthalmol Vis Sci 2011;52:2634-9.
8. Sung KR, Na JH, Lee Y. Glaucoma Diagnostic Capabili- ties of Optic Nerve Head Parameters as Determined by Cirrus HD Optical Coherence Tomography. J Glaucoma 2012;21:498-504.
9. Shin CJ, Sung KR, Um TW, Kim YJ, Kang SY, Cho JW,
Park SB, Park JR, Kook MS. Comparison of Retinal Nerve Fiber Layer Thickness Measurements Calculated by the Optic Nerve Head Map (NHM4) and RNFL 3.45 Modes of Spectral-domain Optical Coherence Tomography (OCT) (RTVue-100). Br J Ophthalmol 2010;94:763-7.
10. Sung KR, Wollstein G, Kim NR, Na JH, Nevins JE, Kim CY, Schuman JS. Macula assessment using optical coher- ence tomography for glaucoma diagnosis. Br J Ophthal- mol 2012;96:1452-5.
11. Na JH, Sung KR, Baek S, Sun JH, Lee Y. Macular and retinal nerve fiber layer thickness: which is more helpful in the diagnosis of glaucoma? Invest Ophthalmol Vis Sci 2011;52:8094-101.
12. Sung KR, Sun JH, Na JH, Lee JY, Lee Y. Progression Detection Capability of Macular Thickness in Advanced Glaucomatous Eyes. Ophthalmology 2011;119: 308-13.
13. Um TW, Sung KR, Wollstein G, Yun SC, Na JH, Schuman JS. Asymmetry in hemifield macular thickness as an early indicator of glaucomatous change. Invest Ophthalmol Vis Sci 2012;53:1139-44.
14. 14. Nakano N, Hangai M, Nakanishi H, Mori S, Nukada M, Kotera Y, Ikeda HO, Nakamura H, Nonaka A, Yo- shimura N. Macular ganglion cell layer imaging in pre- perimetric glaucoma with speckle noise-reduced spectral domain optical coherence tomography. Ophthalmology 2011;118:2414-26.
15. Mwanza JC, Oakley JD, Budenz DL, Chang RT, Knight OJ, Feuer WJ. Macular ganglion cell-inner plexiform layer: automated detection and thickness reproducibility with spectral domain-optical coherence tomography in glaucoma. Invest Ophthalmol Vis Sci 2011;52:8323-9.
16. Heijl A, Leske MC, Bengtsson B, Bengtsson B, Hussein M;
Early Manifest Glaucoma Trial Group. Measuring visual field progression in the Early Manifest Glaucoma Trial.
Acta Ophthalmol Scand 2003;81:286-93.
17. Gaasterland DE, Blackwell B, Dally LG, Caprioli J, Katz LJ, Ederer F; Advanced Glaumoca Intervention Study Investigators. Advanced Glaumoca Intervention Study Investigators. The Advanced Glaucoma Intervention Study (AGIS): 10. Variability among academic glaucoma subspecialists in assessing optic disc notching. Trans Am Ophthalmol Soc 2001;99:177-84.
18. Jampel HD, Friedman D, Quigley H, Vitale S, Miller R, Knezevich F, Ding Y. Agreement among glaucoma spe- cialists in assessing progressive disc changes from photo- graphs in open-angle glaucoma patients. Am J Ophthalmol 2009;147:39-44.
19. Na JH, Sung KR, Baek S, Kim YJ, Durbin MK, Lee HJ,
Kim HK, Sohn YH. Detection of Glaucoma Progression by Assessment of Segmented Macular Thickness Data Ob- tained Using Spectral Domain Optical Coherence Tomog- raphy. Invest Ophthalmol Vis Sci 2012 ;53:3817-26.
20. Quigley HA, Katz J, Derick RJ, Gilbert D, Sommer A. An evaluation of optic disc and nerve fiber layer examinations
in monitoring progression of early glaucoma damage.
Ophthalmology 1992;99:19-28.
21. Sommer A, Katz J, Quigley HA, Miller NR, Robin AL, Richter RC, Witt KA. Clinically detectable nerve fiber at- rophy precedes the onset of glaucomatous field loss. Arch Ophthalmol 1991;109:77-83.