© 2019 The Korean Ophthalmological Society
This is an Open Access article distributed under the terms of the Creative Commons Attribution Non-Commercial License (http://creativecommons.org/licenses /by-nc/3.0/) which permits unrestricted non-commercial use, distribution, and reproduction in any medium, provided the original work is properly cited.
Original Article
Additive Role of Optical Coherence Tomography Angiography Vessel Density Measurements in Glaucoma Diagnoses
Hye Ji Kwon, Junki Kwon, Kyung Rim Sung
Department of Ophthalmology, Asan Medical Center, University of Ulsan College of Medicine, Seoul, Korea
Purpose: This study compared the glaucoma diagnostic abilities of optical coherence tomography (OCT) and optical coherence tomography angiography (OCTA). In addition, the possibility of enhancing diagnostic capa- bility by combining the two modalities was investigated.
Methods: A total of 131 healthy eyes and 113 glaucomatous eyes were imaged by both OCT and OCTA. In OCT, glaucoma was defined as when the color of the superior or inferior quadrant of the peripapillary retinal nerve fiber layer thickness map was yellow (borderline, <5%) or red (outside normal limits, <1%). In OCTA, glaucoma was determined using the cut-off value of the superior or inferior peripapillary vessel density, calcu- lated after receiver operating characteristic curve analysis. Sensitivity and specificity were determined by OCT alone, by OCTA alone, or by OCT and OCTA combined.
Results: The sensitivity of OCT (86.7%) was better than that of OCTA (74.3%), whereas the specificity of OCTA (87.0%) was better than that of OCT (67.9%). When these two modalities were combined, both sensitivity and specificity were enhanced (90.3% and 92.4%, respectively). Among the 131 eyes, 32 were misdiagnosed as glaucomatous by OCT but accurately diagnosed as normal by OCTA. These eyes were myopic, with a longer axial length and a thinner and temporally displaced peak of peripapillary retinal nerve fiber layer thickness, causing the false positive result in OCT.
Conclusions: When OCTA was combined with OCT, the specificity of glaucoma diagnoses were enhanced.
OCTA may compensate for the shortcomings of OCT in the diagnosis of glaucoma.
Key Words: Diagnostic techniques and procedures, Glaucoma, Optical coherence tomography angiography
Glaucoma is characterized by a loss of retinal ganglion cells and subsequent visual field (VF) defects [1-3]. Recent studies have assessed the glaucoma diagnostic ability of optical coherence tomography angiography (OCTA) be-
cause it can provide a reproducible and quantitative assess- ment of the microvasculature in the peripapillary retina, optic nerve head (ONH), and macula [4-13]. Studies using OCTA have reported reduced vessel density (VD) in the ONH and peripapillary retina in glaucomatous eyes, which is correlated with glaucoma severity [5,8,9,14,15]. With OCTA, the reported diagnostic values of peripapillary VD (pVD) were relatively good, with area under the curves (AUCs) of 0.79 to 0.87 [12,16-18], whereas macular VD had lower diagnostic values with AUCs of 0.52–0.70 [16-18].
Optical coherence tomography (OCT) can provide quan-
Received: December 12, 2018 Final revision: March 4, 2019 Accepted: March 5, 2019
Corresponding Author: Kyung Rim Sung, MD, PhD. Department of Ophthalmology, Asan Medical Center, University of Ulsan College of Medicine, 88 Olympic-ro 43-gil, Songpa-gu, Seoul 05505, Korea. Tel: 82- 2-3010-3680, Fax: 82-2-470-6440, E-mail: [email protected]
titative measurements of structural parameters such as peripapillary retinal nerve fiber layer thickness (pRNFLT) [19,20]. With OCT, the glaucoma diagnostic value of pRN- FLT is good, with AUCs over 0.90 [16,18,20]. When com- pared to a normative database, categorical classification of pRNFLT measurements using terms such as ‘outside nor- mal limits,’ ‘borderline,’ or ‘within normal limits’ can help clinicians assess the structural status of glaucoma objec- tively and conveniently [20]. OCT produces a color-coded report that can provide easy-to-understand clinical infor- mation at a glance. However, OCT can miscalculate the true pRNFLT in the following situations: 1) poor image quality (lower signal strength due to media opacity, defo- cus, etc.), 2) poor centration of the optic disc, 3) segmenta- tion error, and 4) presence of a vitreous floater or epiretinal membrane [21]. Moreover, other confounding factors can affect pRNFLT measurements, including an excessively long axial length (AXL) or large-sized disc [22-26]. Due to these sources of error, OCT has high sensitivity but rela- tively lower specificity for glaucoma diagnosis [19,20], meaning that reliance on OCT alone (particularly col- or-coded reports) may result in glaucoma being misdiag- nosed in some cases.
We hypothesized that if OCTA (for pVD measurement) is combined with OCT (for pRNFLT measurement), the diagnostic ability (sensitivity or specificity) for glaucoma could be enhanced owing to the complementarity nature of the two diagnostic modalities. Therefore, the purpose of this study was to compare the diagnostic abilities of ‘OCT combined with OCTA’ and ‘OCT alone’ and to demon- strate cases of OCT misdiagnoses that were successfully diagnosed by OCTA, and vice versa. Based on analysis re- sults, we can determine the additive role of OCTA in the diagnosis of glaucoma with conventional OCT.
Materials and Methods
Subjects
This was a retrospective cross-sectional study. Approval was obtained from the institutional review board of Asan Medical Center, University of Ulsan, Seoul, Korea (2016- 0621), and the study conformed to the tenets of the Decla- ration of Helsinki. Informed consent was waived due to the retrospective nature of the study. Medical records of all
subjects evaluated by a glaucoma specialist (KRS) from March 2016 to February 2017 and who underwent both spectral domain OCT (SD-OCT; HD-OCT, Carl Zeiss Meditec, Dublin, CA, USA) and OCTA (AngioVue; Opt- ovue, Fremont, CA, USA) at Asan Medical Center were re- viewed. Comprehensive ophthalmologic examinations in- cluded the recording of medical, ocular, and family histories, measurement of best-corrected visual acuity, slit lamp biomicroscopy, intraocular pressure (IOP) measure- ment using a Goldmann applanation tonometer, goniosco- py, dilated fundoscopic examination using a 90-diopter (D) lens, stereoscopic optic disc/RNFL photography, VF test- ing using a Humphrey field analyzer (Swedish Interactive Threshold Algorithm 24-2, Carl Zeiss Meditec), measure- ment of central corneal thickness by ultrasound pachyme- try (DGH-550; DGH Technology, Exton, PA, USA), AXL measurement by IOL Master (Carl Zeiss Meditec), pRN- FLT measurement by SD-OCT, and pVD measurement by OCTA.
Study participants met the following inclusion criteria:
older than 18 years of age, a best-corrected visual acuity greater than 20 / 40 with a spherical equivalent between -6.0 and +4.0 D, a cylinder correction within +3.0 D, and reliable VF test results (false positive errors <15%, false negative errors <15%, and fixation loss <20%). Data from the first VF test were excluded to prevent learning effects, and the results of the second and third VF tests (performed within 2 months of each other) were considered as baseline data. If both eyes of the same patient were found to be eli- gible, one eye was randomly selected for the analysis. Par- ticipants were divided into two subgroups: normal controls and open-angle glaucoma patients. Open-angle glaucoma was defined as having an open iridocorneal angle, signs of glaucomatous ONH damage (including neuroretinal rim thinning, notching, or a retinal nerve fiber layer [RNFL]
defect), and a glaucomatous VF defect regardless of IOP level. A glaucomatous VF defect was defined as (1) three or more adjacent points with p < 0.05 on a pattern devia- tion probability map and 1 abnormal point with p < 0.01, (2) outside normal limits on a glaucoma hemifield test, or (3) a pattern standard deviation of p < 0.05, confirmed on two consecutive reliable VF tests. Normal controls were sub- jects from the general eye clinic who had no family history of glaucoma, an IOP <21 mmHg, normal anterior and pos- terior segments on ophthalmologic examinations, normal VF test results, and non-glaucomatous optic discs which
were assessed and confirmed by glaucoma specialists (KRS and JK).
Subjects with any of the following criteria were exclud- ed from the study: (1) a history of any retinal disease, (2) a history of ocular trauma or surgery with the exception of uncomplicated cataract surgery or laser-assisted refractive surgery, (3) any optic nerve disease other than glaucoma, or (4) a history of a neurologic or cerebrovascular event that could result in a VF defect.
Measurement of pRNFLT and pVD by OCT and OCTA The ONH map protocol of SD-OCT was used to esti- mate pRNFLT parameters along a 3.45-mm-diameter cir- cle centered on the ONH based on a 360° area. With Cirrus SD-OCT, the average pRNFLT was measured on each of the 4 quadrants and 12 clock-hour sector maps. We used a color-coded 4-quadrant map in this study. Glaucoma usu- ally involves either the superotemporal or inferotemporal nerve fiber layer around the ONH. To simplify the study design, if either the superior or inferior quadrant color code was yellow or red (i.e., not within the normal limit), then those eyes were regarded as glaucomatous by OCT.
Poor quality SD-OCT images including those with motion artifacts, segmentation failure, or a signal strength index less than 7 were excluded.
The ONH of all participants was imaged (an area of 4.5
× 4.5 mm centered on the optic disc) with an OCTA device (AngioVue, Optovue) that used a motion contrast tech- nique and split-spectrum amplitude-decorrelation angiog- raphy method. The pVD within the radial peripapillary capillary layer was measured using integrated viewing software. The detailed measurement procedures were pre- viously described [27]. In brief, the pVD was measured in a 750-µm-wide elliptical annulus extending outward from the optic disc boundary, where the inner elliptical contour was obtained by fitting an ellipse to the disc margin on the OCT en face retinal angiogram, and the ring width be- tween the inner and outer elliptical contour was defined as the peripapillary region. Viewing software provided the average pVD and the pVD of six peripapillary areas, i.e., superonasal, nasal, inferonasal, inferotemporal, temporal, and superotemporal [28].To match with OCT measure- ments, we used average values of the superotemporal and superonasal sectors to determine a superior pVD and those of the inferotemporal and inferonasal sectors to determine
an inferior pVD. Because there was no normative database or color-coded presentation about pVD in OCTA, we cal- culated the cut-off value of the pVD by receiver operating characteristic analysis. After determining the cut-off value by the Youden index, we defined subjects as glaucomatous if the pVD of each individual was lower than this cut-off value. The cut-off value of the pVD was calculated for the superior and inferior regions separately, and if the superior or inferior pVD was lower than the cut-off value, the sub- jects were regarded as glaucomatous by OCTA. Subjects with poor quality OCTA images, defined as having a sig- nal strength index less than 48, poor image clarity, motion artifacts visualized as an irregular vessel pattern or disc boundary on the en face image, or RNFL segmentation er- rors, were excluded [27].
Statistical analysis
The pVD cut-off value was determined using PASW Statistics ver. 18.0 (SPSS Inc., Chicago, IL, USA). Cross-ta- bles showing sensitivities, specificities, positive predictive values (PPV), and negative predictive values (NPV) were made for three conditions: OCT only, OCTA only, and OCT combined with OCTA. ‘OCT combined with OCTA’
included two methods: ‘OCT or OCTA’ and ‘OCT and OCTA.’ ‘OCT or OCTA’ indicated that glaucoma was di- agnosed when either OCT or OCTA showed a positive re- sult for glaucoma. ‘OCT and OCTA’ indicated that glauco- ma was diagnosed when both OCT and OCTA showed positive results for glaucoma. In certain situations, it might be possible that glaucoma was not diagnosed by OCT but diagnosed by OCTA, thus enhancing the sensitivity. Alter- natively, certain situations might exist where normal eyes were misdiagnosed as glaucomatous by OCT but diag- nosed as normal by OCTA, thus enhancing the specificity.
Therefore, when OCT was combined with OCTA, the sen- sitivity was calculated if either OCT or OCTA showed a positive result for glaucoma, whereas the specificity was calculated if both OCT and OCTA showed positive results for glaucoma. Subsequently, we investigated whether there were inconsistencies in the diagnoses between OCT and OCTA. In addition, we reviewed false positive and false negative cases of OCT and OCTA and attempted to identi- fy specific characteristics.
Results
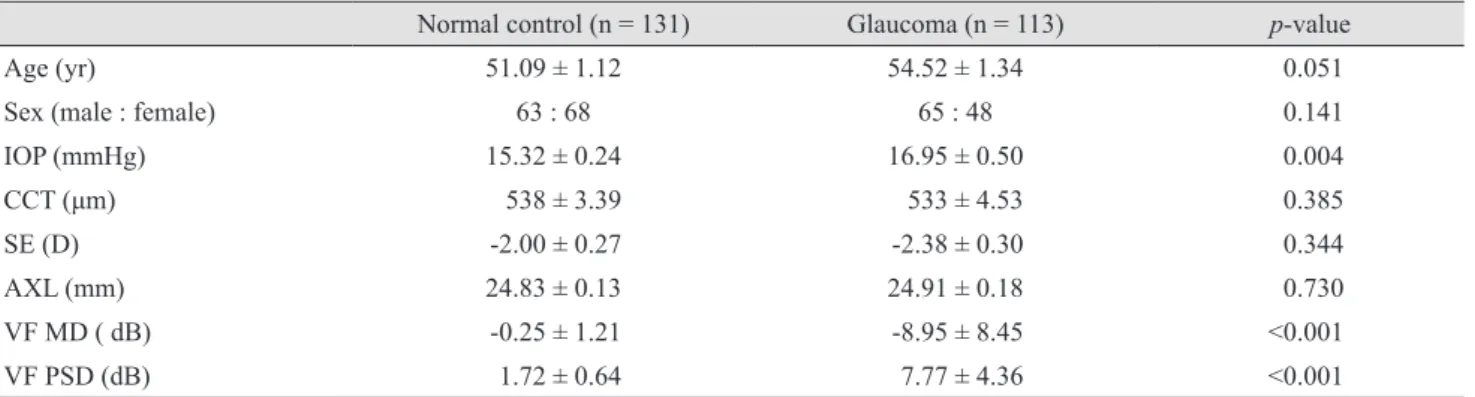
The study population included a total of 244 eyes from 244 patients (131 eyes from normal controls and 113 eyes from glaucoma patients). The demographics of both groups are summarized in Table 1. There were significant differ- ences in IOP, mean deviation (MD), and pattern standard deviation (p < 0.05) between the two groups. Alternatively, age, central corneal thickness, spherical equivalent, and AXL were similar between groups. The average VF MD in the glaucoma group was -8.95 ± 8.45. The cut-off values of the pVD, which differentiates between normal and glau- comatous eyes in OCTA, was 55.70% in the superior re- gion and 54.85% in the inferior region (Fig. 1A, 1B). When assessed by a receiver operating characteristic curve, the
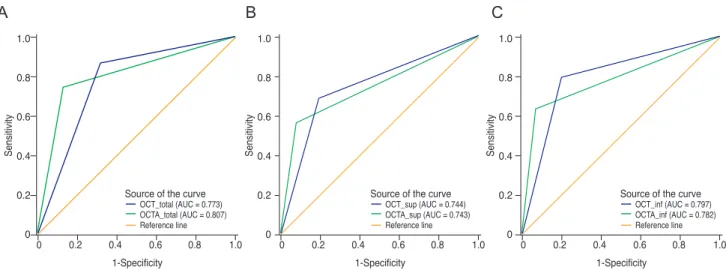
area under the curve was 0.773 in OCT compared with 0.807 in OCTA (Fig. 2A-2C).
Diagnostic ability of OCT, OCTA, and OCT combined with OCTA
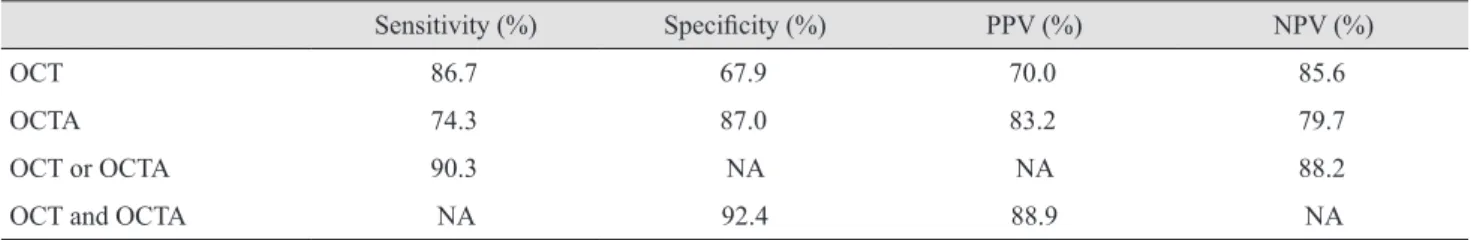
The results of diagnoses by OCT, OCTA, and OCT com- bined with OCTA are summarized in Table 2. Based on the results, the sensitivity, specificity, PPV, and NPV were calculated (Table 3). When only one modality was used to diagnose glaucoma, the sensitivity and NPV were higher with OCT (sensitivity 86.7%, NPV 85.6%) than with OCTA (sensitivity 74.3%, NPV 79.7%), but the specificity and PPV were higher with OCTA (specificity 87.0%, PPV 83.2%) than with OCT (specificity 67.9%, PPV 70.0%).
Table 1. Demographics and ocular characteristics of the study population
Normal control (n = 131) Glaucoma (n = 113) p-value
Age (yr) 51.09 ± 1.12 54.52 ± 1.34 0.051
Sex (male : female) 63 : 68 65 : 48 0.141
IOP (mmHg) 15.32 ± 0.24 16.95 ± 0.50 0.004
CCT (μm) 538 ± 3.39 533 ± 4.53 0.385
SE (D) -2.00 ± 0.27 -2.38 ± 0.30 0.344
AXL (mm) 24.83 ± 0.13 24.91 ± 0.18 0.730
VF MD ( dB) -0.25 ± 1.21 -8.95 ± 8.45 <0.001
VF PSD (dB) 1.72 ± 0.64 7.77 ± 4.36 <0.001
Values are presented as the mean ± standard deviation.
IOP = intraocular pressure; CCT = central corneal thickness; SE = spherical equivalent; AXL = axial length; VF = visual field; MD = mean deviation; PSD = pattern standard deviation.
0 20 40 60
100-Specificity
Sensitivity
80 100
100 80 60 40 20
0
0 20 40 60
100-Specificity
Sensitivity
AUC 0.827 AUC 0.787
80 100
100 80 60 40 20 0
Fig. 1. Receiver operating characteristic curves for calculating the cut-off values of peripapillary vessel density in the (A) superior and (B) inferior regions. The cut-off value was (A) 55.70% for the superior region and (B) 54.85% for the inferior region. AUC = area under the curve.
A B
When OCT was combined with OCTA (‘OCT or OCTA’), the sensitivity and NPV had the highest values (sensitivity 90.3%, NPV 88.2%). When OCT was combined with OCTA (‘OCT and OCTA’), the specificity and PPV had the highest values (specificity 92.4%, PPV 88.9%).
Discrepancy between OCT and OCTA in detecting glaucoma
Among the 131 eyes in the normal control group, the number of eyes that showed a false positive result for glau- coma was 32 with OCT and 7 with OCTA (Table 4). Fig.
3A-3C shows a representative case in which a normal sub- ject was misdiagnosed by OCT as having glaucoma but di- agnosed by OCTA as not having glaucoma (normal). The AXL was 27.45 mm, a value corresponding to high myo- pia. In the temporal-superior-nasal-inferior-temporal (TSNIT) graph of pRNFLT, generalized thinning of the pRNFLT and temporal movement of peaks were noted.
Therefore, the OCT 4-quadrant map was red in the inferi- or quadrant. However, VD values calculated by OCTA, which included the radial peripapillary capillary layer, were 59.53% and 58.66% for the superior and inferior re- gions, respectively, and were higher than the cut-off val- ues.
Among 113 eyes in the glaucoma group, 19 showed a false negative result with OCTA, and 1 showed a false neg- ative result with OCT (Table 5). Fig. 4A and 4B shows a case of a glaucoma patient who was misdiagnosed as not having glaucoma (normal) by OCT. On the 4-quadrant map of pRNFLT, the superior and inferior quadrants were coded in green; however, there were narrow, localized wedge-shaped RNFL defects on the RNFL thickness map.
A glaucomatous VF defect was noted in the superior hemi- VF. Based on the OCTA image, the pVD values for the su- Table 2. Cross-tables showing the number of participants
diagnosed with glaucoma or without glaucoma (normal) by OCT alone, OCTA alone, and OCT combined with OCTA
Glaucoma Normal Total OCT alone
(+) 98 42 140
(−) 15 89 104
Total 113 131 244
OCTA alone
(+) 84 17 101
(−) 29 114 143
Total 113 131 244
OCT or OCTA
(+) 102 49 151
(−) 11 82 93
Total 113 131 244
OCT and OCTA
(+) 80 10 90
(−) 33 121 154
Total 113 131 244
OCT = optical coherence tomography; OCTA = optical coherence tomography angiography.
0 0.2 0.4 0.6 0.8 1.0
OCT_total (AUC = 0.773) OCTA_total (AUC = 0.807) Reference line 1-Specificity
Sensitivity
1.0 0.8 0.6 0.4 0.2
0 0 0.2 0.4 0.6 0.8 1.0
1-Specificity
Sensitivity
1.0 0.8 0.6 0.4 0.2
0 0 0.2 0.4 0.6 0.8 1.0
1-Specificity
Sensitivity
1.0 0.8 0.6 0.4 0.2 0 Source of the curve
OCT_sup (AUC = 0.744) OCTA_sup (AUC = 0.743) Reference line Source of the curve
OCT_inf (AUC = 0.797) OCTA_inf (AUC = 0.782) Reference line Source of the curve
Fig. 2. Receiver operating characteristic curves of optical coherence tomography (OCT) and optical coherence tomography angiography (OCTA). (A) The area under the curve (AUC) was 0.773 in OCT and 0.807 in OCTA in total. In each particular region, (B) AUC was 0.744 in OCT and 0.743 in OCTA for the superior region. (C) AUC was 0.797 in OCT and 0.782 in OCTA for the inferior region.
A B C
perior and inferior regions were 53.77% and 53.94%, re- spectively, both of which were lower than the cut-off values (55.70% and 54.84%, respectively). Therefore, OCTA accurately diagnosed this patient as having glauco- ma.
Discussion
In this study, OCT demonstrated good sensitivity in dif- ferentiating glaucomatous eyes from normal controls (sen- sitivity 86.7%, NPV 85.6%), whereas OCTA had better specificity (specificity 87.0%, PPV 83.2%). Hence, if the OCT result was normal, then it is very likely that there was no glaucoma. In contrast, if the OCTA result was ab- normal, then it was very likely that the eye was glaucoma- tous. When these two modalities were combined, OCTA enhanced both the sensitivity and specificity for glaucoma diagnosis. In other words, OCTA could accurately detect glaucomatous eyes, which may be misdiagnosed by OCT as normal, and OCTA could detect normal eyes, which may be misdiagnosed by OCT as glaucomatous. Therefore, these two modalities complemented each other in the diag-
nosis of glaucoma.
Various studies have assessed the glaucomatous diag- nostic ability of OCTA using VD [12,17,18,29]. Rao et al.
[18] evaluated and compared the diagnostic ability of VD in the ONH, peripapillary, and macula regions with corre- sponding structural measurements (rim area, pRNFLT, ganglion cell complex thickness) and found that the VD AUCs were significantly lower than those of correspond- ing structural measurements. Another study by the same author showed that the diagnostic ability of VD measure- ments, especially the inferotemporal sector, was compara- ble (p > 0.05) to that of pRNFLT measurements [12]. Nev- ertheless, it is difficult to compare diagnostic abilities directly among different studies as they can vary accord- ing to the participant’s stage of disease and the characteris- tics of the study subjects and design [20]. However, various studies seem to indicate that VD (measured by OCTA) is not superior to pRNFLT (assessed by conventional OCT) in the diagnosis of glaucoma. Accordingly, we investigated whether OCTA could play an additional role in the diagno- sis of glaucoma that is different from that of conventional OCT. As mentioned previously, there are several sources of error in the pRNFLT measurement by OCT. Here, we propose that OCTA may function to compensate for the shortcomings of OCT in the diagnosis of glaucoma.
Among the 131 normal controls in our study, 39 partici- pants showed different results between OCT and OCTA.
Most (32 / 39, 82%) had a false positive diagnosis with OCT, which may be attributed to different pRNFLT distri- bution patterns due to the myopic optic disc configuration.
The mean AXL of these 32 eyes was 25.2 mm, a value greater than the mean length of the 131 normal controls (24.8 mm). Hwang et al. [30] and Hwang et al. [31] previ- ously reported that eyes with myopic optic disc tilt showed more temporally positioned superior/inferior peak loca- Table 3. Sensitivity, specificity, positive predictive value, and negative predictive value measured by OCT only, OCTA only, and OCT combined with OCTA
Sensitivity (%) Specificity (%) PPV (%) NPV (%)
OCT 86.7 67.9 70.0 85.6
OCTA 74.3 87.0 83.2 79.7
OCT or OCTA 90.3 NA NA 88.2
OCT and OCTA NA 92.4 88.9 NA
OCT = optical coherence tomography; OCTA = optical coherence tomography angiography; PPV = positive predictive value; NPV = neg- ative predictive value.
Table 4. Number of normal controls (n = 131) with varying results between OCT and OCTA
Results Number (%)
OCT (−)/OCTA (−) 82 (63)
OCT false (+)/OCTA (−) 32 (24)
OCT (−)/OCTA false (+) 7 (5)
OCT false (+)/OCTA false (+) 10 (8)
Total 131 (100)
OCT = optical coherence tomography; OCTA = optical coherence tomography angiography.
tions when measured by OCT. Furthermore, as the AXL became longer, the measured pRNFLT became thinner and more prone to segmentation errors in normal eyes [32].
The underlying mechanism of the relationship between a longer AXL and thinner pRNFLT is unclear; however,
stretching due to a longer eye bulb or artificially decreased measurements due to ocular magnification effects have been suggested as possible mechanisms [32]. Due to the shifting of pRNFLT peak locations and generalized thin- ning of the pRNFLT, some areas adjacent to the peak can Fig. 3. Representative case of a normal control patient misdiagnosed by optical coherence tomography (OCT) as having glaucoma but di- agnosed by optical coherence tomography angiography (OCTA) as not having glaucoma (normal). The axial length of this eye was 27.45 mm, corresponding to high myopia. In the TSNIT (temporal-superior-nasal-inferior-temporal) graph of peripapillary retinal nerve fiber layer thickness (pRNFLT), generalized thinning and temporal movement of pRNFLT peaks were noted. Therefore, the color of the infe- rior quadrant in the pRNFLT map was red (A). However, vessel density values calculated by OCTA, which included the radial peripapil- lary capillary layer, were 59.53% for the superior region and 58.66% for the inferior region, which were higher than the cut-off values (B).
Circumpapillary B-scan image and macular OCT presents the absence of segmentation error or other retinal pathology (C).
C A
B
be seen as “red” in the color-coded TSNIT graph, as shown in Fig. 3. It is worth noting that OCTA was able to diag- nose these 32 eyes as normal. Due to the lack of a norma- tive database and color-coded presentation in OCTA, we artificially classified subjects as normal or glaucomatous using the VD cut-off value from OCTA. Therefore, it would be difficult to apply OCTA directly in clinical prac- tice to differentiate the false positive results of OCT. Nev- ertheless, our results demonstrated the potential ability of OCTA in detecting the false positive results of OCT (so- called red disease) using the cut-off value of the pVD.
Naturally, there were also false positive results with OCTA for the normal controls in our study. Seven normal subjects were diagnosed as normal by OCT but were mis- diagnosed as glaucomatous by OCTA. We carefully re- viewed the eyes of these patients and found that all exhib- ited significant media opacity due to conditions such as cataracts. Although both OCT and OCTA use the same light source, their target objects are different. OCT detects and measures a stationary structure, such as pRNFLT or macular ganglion cell-inner plexiform layer thickness, while OCTA detects the dynamic motion of red blood cells in the vessels and measures vasculature variables. Thus far, we do not know which modalities are more influenced by media opacity. However, image acquisition in OCTA appears to be substantially affected by media opacity. This issue should be further investigated in future studies.
Among the 113 glaucoma patients in our study, 20 showed different results between OCT and OCTA. Most (19 / 20, 95%) had a false negative result with OCTA, indi- cating that glaucoma was detected by OCT but not by OCTA. This may be attributed to the relatively lower sen- sitivity of OCTA (74.3%) compared with OCT (86.7%).
The MD of these 19 eyes was -4.3 dB, which was higher
than the MD (-8.95 dB) of the 113 glaucomatous eyes.
Hence, the microvascular changes detected by OCTA may not be obvious in these early glaucoma cases. It is unclear whether the preceding change in glaucoma is vascular- or structural-related. Lee et al. [33] reported that OCTA de- tected a decrease in pVD at the location of the RNFL de- fect in glaucomatous eyes and suggested that the decreased pVD was likely associated with secondary loss or the clo- sure of capillaries at the area of glaucomatous RNFL atro- phy. In this context, we can speculate that microvascular changes cannot be detected by OCTA in the early stage of glaucoma because of the time difference between structur- al and vascular changes.
Only one glaucoma patient showed a false negative re- sult with OCT, indicating that glaucoma was accurately detected by OCTA but not by OCT (Fig. 4). Considering the relatively high sensitivity of OCT, this result was somewhat unexpected. We reviewed this case and found localized wedge-shaped RNFL defects on the thickness map. In the TSNIT graph, the thinned area did not reach the yellow or red areas (borderline or outside normal lim- its). The area of localized RNFL thinning was relatively narrow and/or mild; thus, glaucoma could be detected by the 4-quadrant pRNFLT map. To simplify the study de- sign, we only used the quantified measurements of the 4 quadrants of the pRNFLT map; therefore, the diagnostic ability of OCT was underestimated. Further in-depth stud- ies analyzing comprehensive data of OCT would be neces- sary.
There were some limitations to our study. First, we as- sumed that the diagnosis of glaucoma by OCT was based only on the color presented by the 4-quadrant map, al- though the OCT device provided a variety of information including the RNFL thickness map, deviation map, 12 clock-hour sector map, and TSINT graph. To accurately diagnose glaucoma, it is necessary to comprehensively as- sess the information provided by OCT; however, to simpli- fy and clarify our study design, we only used the 4-quad- rant pRNFLT map to diagnose glaucoma. Therefore, the diagnostic ability of OCT might be underestimated in this study. In addition, there are no universally accepted crite- ria for diagnosing glaucoma using OCTA, and there is no established normative database of VD measurements by OCTA. Therefore, the categorization of OCTA measure- ments (such as quadrant color code) similar to that of OCT is not currently available. Like previous studies using Table 5. Number of glaucoma patients (n = 113) with varying
results between OCT and OCTA
Results Number (%)
OCT (+)/OCTA (+) 82 (72)
OCT false (−)/OCTA (+) 1 (1)
OCT (+)/OCTA false (−) 19 (17)
OCT false (−)/OCTA false (−) 11 (10)
Total 113 (100)
OCT = optical coherence tomography; OCTA = optical coherence tomography angiography.
OCTA [12,16-18,29], we recorded the VD of all participants and calculated the VD cut-off value to differentiate glau- coma patients from normal control subjects. The design of our study may have been somewhat arbitrary; neverthe- less, we often find it difficult to diagnose glaucoma by
OCT alone in clinical practice. Based on the study results, OCTA can provide additional information to aid clinicians in diagnosis and enhance the diagnostic ability (sensitivity and specificity) for glaucoma.
In conclusion, when the pVD provided by OCTA was Fig. 4. A glaucoma patient with a false negative result following optical coherence tomography (OCT). On the peripapillary retinal nerve fiber layer thickness (pRNFLT) map, some wedge-shaped localized RNFL defects were observed both in the superior and inferior quad- rants. In the TSNIT (temporal-superior-nasal-inferior-temporal) graph, the thinned area did not reach the yellow or red area (borderline or outside normal limits). The color of the 4-quadrant pRNFLT map was green (A). However, vessel density values calculated by optical coherence tomography angiography (OCTA) were 53.77% for the superior region and 53.94% for the inferior region, which were lower than the cut-off values (B). Circumpapillary B-scan image and macular OCT presents the absence of segmentation error or other retinal pathology (C).
B
C A
combined with conventional pRNFLT measurements in OCT, glaucoma diagnostic ability could be enhanced. In comparison with OCT, OCTA showed a relatively better specificity for glaucoma diagnosis. Furthermore, OCTA can detect normal eyes, which may be misdiagnosed by OCT as glaucomatous due to measurement errors. There- fore, OCTA may play an additive role in the diagnosis of glaucoma when combined with OCT.
Conflict of Interest
No potential conflict of interest relevant to this article was reported.
References
1. Weinreb RN, Aung T, Medeiros FA. The pathophysiology and treatment of glaucoma: a review. JAMA 2014;311:1901- 11.
2. Kountouras J, Zavos C, Chatzopoulos D. Primary open-an- gle glaucoma: pathophysiology and treatment. Lancet 2004;364:1311-2.
3. Gemenetzi M, Yang Y, Lotery AJ. Current concepts on primary open-angle glaucoma genetics: a contribution to disease pathophysiology and future treatment. Eye (Lond) 2012;26:355-69.
4. Jia Y, Morrison JC, Tokayer J, et al. Quantitative OCT an- giography of optic nerve head blood flow. Biomed Opt Ex- press 2012;3:3127-37.
5. Jia Y, Wei E, Wang X, et al. Optical coherence tomography angiography of optic disc perfusion in glaucoma. Ophthal- mology 2014;121:1322-32.
6. Leveque PM, Zeboulon P, Brasnu E, et al. Optic disc vas- cularization in glaucoma: value of spectral-domain optical coherence tomography angiography. J Ophthalmol 2016;2016:6956717.
7. Li J, Yang YQ, Yang DY, et al. Reproducibility of perfusion parameters of optic disc and macula in rhesus monkeys by optical coherence tomography angiography. Chin Med J (Engl) 2016;129:1087-90.
8. Liu L, Jia Y, Takusagawa HL, et al. Optical coherence to- mography angiography of the peripapillary retina in glau- coma. JAMA Ophthalmol 2015;133:1045-52.
9. Mammo Z, Heisler M, Balaratnasingam C, et al. Quantita-
tive optical coherence tomography angiography of radial peripapillary capillaries in glaucoma, glaucoma suspect, and normal eyes. Am J Ophthalmol 2016;170:41-9.
10. Mansoori T, Sivaswamy J, Gamalapati JS, et al. Measure- ment of radial peripapillary capillary density in the normal human retina using optical coherence tomography angiog- raphy. J Glaucoma 2017;26:241-6.
11. Mo S, Phillips E, Krawitz BD, et al. Visualization of radial peripapillary capillaries using optical coherence tomogra- phy angiography: the effect of image averaging. PLoS One 2017;12:e0169385.
12. Rao HL, Kadambi SV, Weinreb RN, et al. Diagnostic ability of peripapillary vessel density measurements of optical co- herence tomography angiography in primary open-angle and angle-closure glaucoma. Br J Ophthalmol 2017;101:1066- 70.
13. Yu J, Jiang C, Wang X, et al. Macular perfusion in healthy Chinese: an optical coherence tomography angiogram study. Invest Ophthalmol Vis Sci 2015;56:3212-7.
14. Bojikian KD, Chen CL, Wen JC, et al. Optic disc perfusion in primary open angle and normal tension glaucoma eyes using optical coherence tomography-based microangiogra- phy. PLoS One 2016;11:e0154691.
15. Wang X, Jiang C, Ko T, et al. Correlation between optic disc perfusion and glaucomatous severity in patients with open-angle glaucoma: an optical coherence tomography angiography study. Graefes Arch Clin Exp Ophthalmol 2015;253:1557-64.
16. Kwon J, Choi J, Shin JW, et al. Glaucoma diagnostic capa- bilities of foveal avascular zone parameters using optical coherence tomography angiography according to visual field defect location. J Glaucoma 2017;26:1120-9.
17. Rao HL, Pradhan ZS, Weinreb RN, et al. regional compar- isons of optical coherence tomography angiography vessel density in primary open-angle glaucoma. Am J Ophthalmol 2016;171:75-83.
18. Rao HL, Pradhan ZS, Weinreb RN, et al. A comparison of the diagnostic ability of vessel density and structural mea- surements of optical coherence tomography in primary open angle glaucoma. PLoS One 2017;12:e0173930.
19. Sung KR, Kim DY, Park SB, Kook MS. Comparison of retinal nerve fiber layer thickness measured by Cirrus HD and Stratus optical coherence tomography. Ophthalmology 2009;116:1264-70.
20. Sung KR, Kim JS, Wollstein G, et al. Imaging of the reti- nal nerve fibre layer with spectral domain optical coher-
ence tomography for glaucoma diagnosis. Br J Ophthalmol 2011;95:909-14.
21. Asrani S, Essaid L, Alder BD, Santiago-Turla C. Artifacts in spectral-domain optical coherence tomography measure- ments in glaucoma. JAMA Ophthalmol 2014;132:396-402.
22. Aykut V, Oner V, Tas M, et al. Influence of axial length on peripapillary retinal nerve fiber layer thickness in children:
a study by RTVue spectral-domain optical coherence to- mography. Curr Eye Res 2013;38:1241-7.
23. Dhami A, Dhasmana R, Nagpal RC. Correlation of retinal nerve fiber layer thickness and axial length on Fourier do- main optical coherence tomography. J Clin Diagn Res 2016;10:NC15-7.
24. Hirasawa K, Shoji N, Yoshii Y, Haraguchi S. Determina- tion of axial length requiring adjustment of measured cir- cumpapillary retinal nerve fiber layer thickness for ocular magnification. PLoS One 2014;9:e107553.
25. Oner V, Ozgur G, Turkyilmaz K, et al. Effect of axial length on retinal nerve fiber layer thickness in children.
Eur J Ophthalmol 2014;24:265-72.
26. Yamashita T, Sakamoto T, Yoshihara N, et al. Correlations between retinal nerve fiber layer thickness and axial length, peripapillary retinal tilt, optic disc size, and retinal artery position in healthy eyes. J Glaucoma 2017;26:34-40.
27. Suh MH, Zangwill LM, Manalastas PI, et al. Deep retinal layer microvasculature dropout detected by the optical co- herence tomography angiography in glaucoma. Ophthal- mology 2016;123:2509-18.
28. Garway-Heath DF, Poinoosawmy D, Fitzke FW, Hitchings RA. Mapping the visual field to the optic disc in normal tension glaucoma eyes. Ophthalmology 2000;107:1809-15.
29. Chung JK, Hwang YH, Wi JM, et al. Glaucoma diagnostic ability of the optical coherence tomography angiography vessel density parameters. Curr Eye Res 2017;42:1458-67.
30. Hwang YH, Yoo C, Kim YY. Characteristics of peripapil- lary retinal nerve fiber layer thickness in eyes with myopic optic disc tilt and rotation. J Glaucoma 2012;21:394-400.
31. Hwang YH, Yoo C, Kim YY. Myopic optic disc tilt and the characteristics of peripapillary retinal nerve fiber layer thickness measured by spectral-domain optical coherence tomography. J Glaucoma 2012;21:260-5.
32. Mauschitz MM, Bonnemaijer PW, Diers K, et al. Systemic and ocular determinants of peripapillary retinal nerve fiber layer thickness measurements in the European eye epide- miology (E3) population. Ophthalmology 2018;125:1526-36.
33. Lee EJ, Lee KM, Lee SH, Kim TW. OCT angiography of the peripapillary retina in primary open-angle glaucoma.
Invest Ophthalmol Vis Sci 2016;57:6265-70.