As glaucoma is associated with progressive retinal nerve fiber layer (RNFL) thinning, measuring RNFL thickness over time is essential for the evaluation of glaucoma [1-3].
It has been reported that RNFL thinning is also associ- ated with aging [4-21]. Considering both age and glaucoma cause progressive RNFL thinning, it is important to assess the rate and topographic distribution of RNFL thinning as- sociated with age for the accurate evaluation of glaucoma.
The association between age and RNFL thickness in
healthy subjects has been investigated by histological methods [4-8], scanning laser polarimetry [9-12], and opti- cal coherence tomography (OCT) [13-22]. Various studies with time-domain OCT have reported that the slope of average RNFL thickness ranged from -1.6 to -3.3 μm per decade of age, with inconsistent results for topographic distribution of RNFL slopes [13-22]. RNFL thickness mea- sured by time-domain OCT was reported to be different from that measured by spectral domain OCT [23,24]. In addition, there were differences in RNFL thickness ac- cording to ethnicity [15]. However, to date, little is known about the association between age and RNFL thickness measured by spectral-domain OCT in Korean subjects.
This study was performed to evaluate the association between age and RNFL thickness measured by the Cirrus Original Article
Age and Retinal Nerve Fiber Layer Thickness Measured by Spectral Domain Optical Coherence Tomography
Jong Yeon Lee
1, Young Hoon Hwang 2,3, Sun Min Lee
4, Yong Yeon Kim
5
1
Department of Ophthalmology, Gachon University Gil Hospital, Incheon, Korea
2
Department of Ophthalmology, Kim’s Eye Hospital, Myung-Gok Eye Research Institute, Konyang University College of Medicine, Seoul, Korea
3
Department of Ophthalmology, Armed Forces Capital Hospital, Seongnam, Korea
4
Department of Radiation Oncology, Korea University College of Medicine, Seoul, Korea
5
Department of Ophthalmology, Korea University College of Medicine, Seoul, Korea
© 2012 The Korean Ophthalmological Society
This is an Open Access article distributed under the terms of the Creative Commons Attribution Non-Commercial License (http://creativecommons.org/licenses /by-nc/3.0/) which permits unrestricted non-commercial use, distribution, and reproduction in any medium, provided the original work is properly cited.
Received: December 6, 2010 Accepted: April 18, 2011
Corresponding Author: Young Hoon Hwang, MD. Department of Oph- thalmology, Kim’s Eye Hospital, #136 Yeongsin-ro, Yeongdeungpo-gu, Seoul 150-034, Korea. Tel: 82-2-2639-7777, Fax: 82-2-2633-3976, E-mail:
[email protected]
Purpose: To evaluate the association between age and peripapillary retinal nerve fiber layer (RNFL) thickness measured by Cirrus high-definition (HD) spectral domain optical coherence tomography (OCT) in healthy Ko- rean subjects.
Methods: A total of 302 eyes from 155 healthy Korean subjects (age range, 20 to 79 years) underwent RNFL thickness measurements using the Cirrus HD-OCT. Average, quadrant, and clock-hour RNFL thickness pa- rameters were analyzed in terms of age using linear mixed effect models.
Results: Average RNFL demonstrated a slope of -2.1 μm per decade of age (p < 0.001). In quadrant analy- sis, superior (-3.4 μm/decade, p < 0.001) and inferior (-2.9 μm/decade, p < 0.001) quadrants showed steeper slopes, whereas temporal (-1.1 μm/decade, p < 0.001) and nasal (-1.0 μm/decade, p < 0.001) quadrants re- vealed shallower slopes. Among the 12 clock-hour sectors, clock hours 6 (-4.5 μm/decade, p < 0.001) and 1 (-4.1 μm/decade, p < 0.001) showed the greatest tendency to decline with age; RNFLs of the 3 (-0.2 μm/decade, p
= 0.391) and 4 (-0.6 μm/decade, p = 0.052) o’clock hour sectors did not show significant decay.
Conclusions: RNFL thickness was associated with age, especially in superior and inferior areas. The topo- graphic distribution of correlation between age and RNFL thickness was not uniform.
Key Words: Aging, Glaucoma, Optical coherence tomography
high-definition (HD) spectral-domain OCT (Cirrus HD- OCT; Carl Zeiss Meditec, Dublin, CA, USA) in healthy Korean subjects.
Materials and Methods
The study protocol was approved by the institutional review board of the Armed Forces Capital Hospital, Korea.
All procedures conformed to the Declaration of Helsinki, and all participants provided informed consent before enrollment. Among those who underwent annual ocular examinations at the Armed Forces Capital Hospital, Korea, healthy volunteers (including ranks, officers, and reserve officers) were recruited from June 2009 to August 2010.
Each participant underwent a full ophthalmic examina- tion, including the assessment of visual acuity, refractive error by autorefractokeratometer (RK-F1; Canon, Tokyo, Japan), intraocular pressure (IOP) with a non-contact to- nometer (Topcon CT-80; Topcon, Tokyo, Japan), automated visual field test with the Humphrey visual field analyzer (Carl Zeiss Meditec), optic nerve head evaluation and fun- dus examination with a 90 diopter lens, and peripapillary RNFL thickness measurement with a Cirrus HD-OCT.
Inclusion criteria were as follows: best-corrected visual acuity of 20 / 25 or better, spherical equivalent (spherical refractive error + 1/2 cylindrical refractive error in the neg- ative form) within ±2.0 diopters, normal IOP (<21 mmHg), normal visual field (glaucoma hemifield test within normal limits and pattern standard deviation probability greater than 5%) with reliable results (false-positive or false-nega-
tive rate ≤15% or fixation losses ≤20%), normal optic nerve head without glaucomatous changes (i.e., increased cup-to- disc ratio, narrowing of neuroretinal rim), and no retinal pathology. Subjects with a history of systemic diseases in- cluding hypertension and diabetes, previous ocular trauma or surgery, or peripapillary atrophy extending more than 1.7 mm from the center of the optic disc were excluded.
A 200 × 200 cube optic disc scan was obtained with the Cirrus HD-OCT without pupil dilation. Using the iris and fundus viewports, the alignment was properly positioned to the optic nerve head in the center of the scan. Once the optic nerve head was centered on the live scanning laser image, a 6 × 6-mm square of data was captured. Only im- ages without a prominent involuntary saccade during the scan and signal strength ≥8 were included. Using the glau- coma OU analysis mode of the Cirrus HD-OCT (software ver. 4.5.1.11), the average, superior, nasal, inferior, tempo- ral, and 12 clock-hour RNFL thickness parameters were obtained.
Linear mixed effects models were fitted to the RNFL thickness to evaluate its association with age. The absolute slopes of RNFL changes in average, superior, nasal, infe- rior, temporal, and 12 clock-hour sectors were evaluated.
Because the rate of change can be affected by the level of measurement, the slope was normalized by calculating the slope divided by the average parameter value to evalu- ate whether the relative rate of change was homogenous throughout the various sectors [18]. The relationship among the absolute and relative (normalized) slopes and average RNFL thickness of each clock-hour sector was evaluated Table 1. Mean ± standard deviation of retinal nerve fiber layer thickness (μm) on average, quadrants, and clock-hour sectors in dif- ferent age groups
20-29 yr 30-39 yr 40-49 yr 50-59 yr 60-79 yr
No. of eyes 69 62 62 56 53
Average 99.04 ± 4.20 98.19 ± 5.29 94.44 ± 4.09 92.63 ± 4.80 89.60 ± 4.73 Superior 129.81 ± 10.12 125.66 ± 10.37 119.73 ± 10.11 116.93 ± 9.21 114.42 ± 9.48
Nasal 71.45 ± 6.72 71.27 ± 6.76 68.71 ± 5.48 68.00 ± 6.78 67.02 ± 5.61
Inferior 127.38 ± 8.76 126.53 ± 10.95 122.89 ± 9.22 118.80 ± 10.72 114.38 ± 9.75 Temporal 67.62 ± 6.24 69.44 ± 7.19 66.43 ± 5.97 66.39 ± 5.11 62.23 ± 8.07 Clock-hour sector
12 138.96 ± 17.04 127.90 ± 19.19 125.11 ± 21.48 123.81 ± 18.10 122.34 ± 20.74 1 120.93 ± 18.74 115.76 ± 17.20 109.61 ± 16.32 104.79 ± 15.24 103.06 ± 14.98 2 90.10 ± 13.02 88.58 ± 13.45 83.19 ± 11.80 81.64 ± 11.10 80.70 ± 11.00
3 59.57 ± 8.40 60.92 ± 8.00 59.54 ± 8.20 59.27 ± 6.67 58.57 ± 8.20
4 64.71 ± 9.04 64.37 ± 8.09 63.55 ± 8.00 62.77 ± 7.90 61.98 ± 6.49
5 102.33 ± 15.58 97.48 ± 13.19 96.66 ± 13.11 95.02 ± 11.90 90.68 ± 12.79 6 144.59 ± 17.22 140.16 ± 19.40 135.42 ± 19.17 127.50 ± 20.67 125.60 ± 20.40 7 136.60 ± 12.52 141.85 ± 17.13 135.26 ± 15.19 134.00 ± 14.87 126.87 ± 17.89
8 69.54 ± 10.00 70.94 ± 10.72 68.75 ± 7.28 68.63 ± 8.49 64.28 ± 10.48
9 55.00 ± 6.10 56.55 ± 5.89 53.66 ± 5.19 53.59 ± 5.59 51.49 ± 6.96
10 78.29 ± 8.01 80.81 ± 9.32 76.94 ± 7.65 76.84 ± 10.64 71.06 ± 10.19
11 129.41 ± 16.39 133.32 ± 15.65 124.45 ± 15.29 123.75 ± 19.64 116.34 ± 15.73
by Spearman’s rho test. Significance was set at p < 0.05.
All statistical analysis of the data was performed using SPSS ver. 12.0 (SPSS Inc., Chicago, IL, USA).
Results
A total of 302 eyes of 155 healthy Korean male partici- pants were enrolled. The mean ± standard deviation age and spherical equivalent were 42.90 ± 16.15 years (range, 20 to 79 years) and -0.52 ± 0.88 diopters (range, -1.88 to 1.75 diopters), respectively.
Overall subjects were divided into 5 groups according to the age. RNFL thicknesses of average, quadrants, and clock-hour sectors in each age group are listed in Table 1.
The results of the RNFL thickness slope analysis are listed in Table 2. The average RNFL demonstrated a slope of -2.1 μm per decade of age (p < 0.001; normalized, -0.022). In quadrant analysis, the superior (-3.4 μm/decade; p < 0.001;
normalized, -0.028) and inferior (-2.9 μm/decade; p < 0.001;
normalized, -0.024) quadrants showed greatest tendency to decrease with age, whereas the temporal (-1.1 μm/decade;
p < 0.001; normalized, -0.016) and nasal (-1.0 μm/decade; p
< 0.001; normalized, -0.014) quadrants revealed shallower slopes of decay. The slopes of superior and inferior quad- rants were significantly greater than the slopes of nasal and temporal quadrants (p < 0.001); comparisons of slopes be- tween nasal and temporal, superior and inferior quadrants were not significant (p > 0.20).
Among the 12 clock-hour sectors, clock hours 6 (-4.5 μm/decade; p < 0.001; normalized, -0.033) and 1 (-4.1 μm/
decade; p < 0.001; normalized, -0.036) showed the greatest tendency to decline with age; RNFLs of the 3 (-0.2 μm/de- cade; p = 0.391; normalized, -0.004) and 4 (-0.6 μm/decade;
p = 0.052; normalized, -0.009) o’clock hour sectors did not show significant decay. Other sectors (12, 2, 5, 7, 8, 9, 10, and 11 o’clock hour sectors) also showed significant decay with age (p ≤ 0.010).
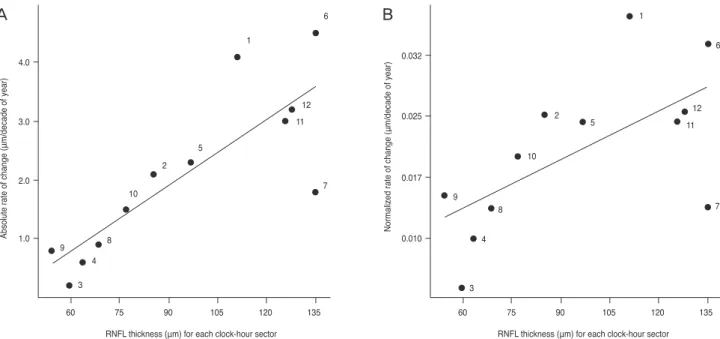
The relationship between the RNFL thickness slope and average RNFL thickness of each clock-hour sector is presented in Fig. 1. Both absolute and normalized slopes in RNFL thickness were significantly associated with average RNFL thickness of each sector (Spearman’s rho = 0.853, p
< 0.001 for absolute slope; Spearman’s rho = 0.661, p = 0.018 for normalized slope).
Discussion
In the present study, peripapillary RNFL thickness mea- sured by the Cirrus HD-OCT was associated with age.
The correlations were prominent in superior and inferior areas, whereas those in nasal and temporal areas were less remarkable.
Various studies have investigated the correlation be- tween age and RNFL thickness. Cross-sectional histologic studies revealed that the optic nerve of a normal subject loses its axons in the range of 4,900 to 6,700 per year [4-7].
However, histologic methods have limitations of artifacts caused by tissue swelling, autolysis, shrinkage, or differ- ences in sampling location [8].
Regarding in vivo methods, studies with scanning laser Table 2. Absolute and normalized slopes of retinal nerve fiber layer thickness on average, quadrants, and clock-hour sectors
Absolute slope (μm/decade of year) 95% confidence interval p-value
*Normalized slope
Average -2.05 -2.39 to -1.72 <0.001 -0.02156
Superior -3.40 -4.11 to -2.70 <0.001 -0.02792
Nasal -0.97 -1.41 to -0.53 <0.001 -0.01397
Inferior -2.88 -3.57 to -2.18 <0.001 -0.02353
Temporal -1.08 -1.55 to -0.61 <0.001 -0.01622
Clock-hour sectors
12 -3.16 -4.54 to -1.79 <0.001 -0.02467
1 -4.05 -5.22 to -2.87 <0.001 -0.03635
2 -2.09 -2.95 to -1.23 <0.001 -0.02454
3 -0.23 -0.77 to 0.30 <0.391 -0.00386
4 -0.56 -1.12 to 0.01 <0.052 -0.00881
5 -2.28 -3.23 to -1.34 <0.001 -0.02356
6 -4.52 -5.87 to -3.18 <0.001 -0.03341
7 -1.82 -2.93 to -0.70 <0.002 -0.01346
8 -0.89 -1.56 to -0.22 <0.010 -0.01298
9 -0.81 -1.23 to -0.39 <0.001 -0.01495
10 -1.52 -2.17 to -0.87 <0.001 -0.01974
11 -2.99 -4.16 to -1.81 <0.001 -0.02376
*
p-value for the absolute slope difference from a zero slope.
polarimetry and OCT have been reported [9-22]. In cross- sectional studies with scanning laser polarimetry, the av- erage RNFL thickness decay ranged from -0.8 to -5.0 μm per decade of age [9-12]. However, topographic patterns of decrease in RNFL were different between the studies: one study showed only significant changes in nasal and inferior areas [9], whereas another study revealed a faster rate of change in the superior area compared to the inferior area [12].
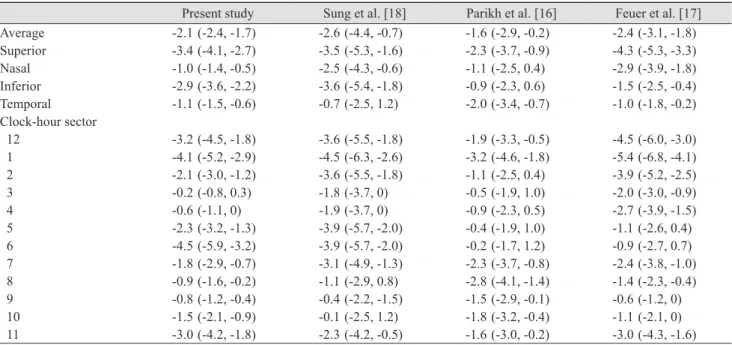
Various cross-sectional studies with OCT reported the relationship between age and RNFL thickness [13-22]. The reported rates of RNFL thickness change ranged from -1.6 to -3.3 μm per decade of age, which includes our outcome (-2.1 μm). However, in terms of topographic patterns of RNFL slope, inconsistent results were found among the studies using OCT [13-21]. To date, the results of 3 studies with Stratus OCT (Carl Zeiss Meditec) are available for comparison of the average, quadrant, and clock-hour sec- tor slopes of RNFL changes with 95% confidence intervals (Table 3). A study by Parikh et al. [16] showed that the average RNFL thickness slope was -1.6 μm per decade of age; the rates of the superior and inferior quadrants were -2.3 and -0.9 μm per decade of age, respectively. This find- ing was in agreement with the study results of Feuer et al.
[17] who reported that the average slope was -2.4 μm per decade of age, and those of superior and inferior quad- rants were -4.3 and -1.5 μm per decade of age, respectively.
Both of these studies showed a shallower slope of RNFL changes in the inferior area. Parikh et al. [16] suggested
the axons of the inferior RNFL are more resistant to age- related changes than axons of the superior area.
On the contrary, in another study using Stratus OCT, Sung et al. [18] reported that average RNFL slope was -2.6 μm per decade of age, and both superior and inferior quad- rant RNFLs showed the greatest slopes (-3.5 and -3.6 μm per decade of age, respectively) which was in line with the present study results. The slope of the inferior area in our study results was steeper than those of other studies [16,17]
as presented in Table 3. For instance, the 95% confidence interval of the clock-hour 6 slope in the present study did not overlap with those of previous studies [16,17], which may imply significant differences. Other studies had dif- fering findings, demonstrating similar RNFL slopes in all regions [19], significant slopes at superior, inferior, and temporal areas [20], or the steepest slope in the inferior- temporal and superior-temporal areas [21,22]. These discrepancies may be explained a part by differences in ethnicity, refractive error, or imaging device between the present study and other studies.
In the present study, the topographic distribution of RNFL change with age was not uniform: the slopes of superior and inferior areas (except for the 7 o’clock hour sector) were significantly steeper than those of the nasal and temporal areas. This topographic difference in RNFL changes may be explained by two hypotheses. First, an area with greater axonal diameter may have a steeper de- cline than an area with thinner axons. In the present study, areas with greater RNFL thickness had steeper slopes, as
60 75 90 105 120 135
1
6
12 11 5
2 10 4.0
3.0
2.0
1.0 9 8
4 3
7
RNFL thickness (μm) for each clock-hour sector
Absolute rate of change (μm/decade of year)
60 75 90 105 120 135
10
8 9
4
3
2
1
6
5
12 11
7 0.032
0.025
0.017
0.010
RNFL thickness (μm) for each clock-hour sector
Normalized rate of change (μm/decade of year)