• 검색 결과가 없습니다.

Characterization of Peripapillary Atrophy Using Spectral Domain Optical Coherence Tomography

N/A
N/A
Protected

Academic year: 2022

Share "Characterization of Peripapillary Atrophy Using Spectral Domain Optical Coherence Tomography"

Copied!
7
0
0

로드 중.... (전체 텍스트 보기)

전체 글

(1)

Original Article

Characterization of Peripapillary Atrophy Using Spectral Domain Optical Coherence Tomography

Jung Hwa Na, Byung Gil Moon, Kyung Rim Sung, Youngrok Lee, Michael S. Kook

Department of Ophthalmology, Asan Medical Center, University of Ulsan College of Medicine, Seoul, Korea

Purpose: To characterize the features of peripapillary atrophy (PPA), as imaged by spectral-domain optical coher- ence tomography (SD-OCT).

Methods: SD-OCT imaging of the optic disc was performed on healthy eyes, eyes suspected of having glaucoma, and eyes diagnosed with glaucoma. From the peripheral β-zone, the retinal nerve fiber layer (RNFL), the junction of the inner and outer segments (IS/OS) of the photoreceptor layer, and the Bruch’s membrane/retinal pigment epithelium complex layer (BRL) were visualized.

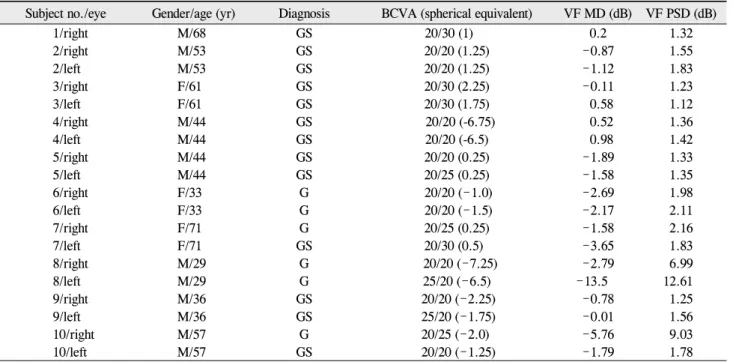
Results: Nineteen consecutive eyes of 10 subjects were imaged. The RNFL was observed in the PPA β-zone of all eyes, and no eye showed an IS/OS complex in the β-zone. The BRL was absent in the β-zone of two eyes. The BRL was incomplete or showed posterior bowing in the β-zone of five eyes.

Conclusions: The common findings in the PPA β-zone were that the RNFL was present, but the photoreceptor layer was absent. Presence of the BRL was variable in the β-zone areas.

Key Words: Bruch’s membrane, Glaucoma, Peripapillary atrophy, Retinal nerve fiber layer, Spectral-domain opti- cal coherence tomography

ⓒ2010 The Korean Ophthalmological Society

This is an Open Access article distributed under the terms of the Creative Commons Attribution Non-Commercial License (http://creativecommons.org/licenses /by-nc/3.0/) which permits unrestricted non-commercial use, distribution, and reproduction in any medium, provided the original work is properly cited.

Received: March 15, 2010 Accepted: August 13, 2010

Reprint requests to Kyung Rim Sung. Department of Ophthalmology, Asan Medical Center, #388-1 Pungnap 2-dong, Songpa-gu, Seoul 138-736, Korea. Tel: 82-2-3010-3680, Fax: 82-2-2-470-6440, E-mail: sungeye

@gmail.com

Structural change precedes irreversible functional decay in glaucomatous eyes [1,2]. Therefore, detection of structural changes has been emphasized for early glaucoma diagnosis.

Traditionally, glaucoma structural diagnosis has been fo- cused on the optic disc and the peripapillary retinal nerve fi- ber layer (RNFL). Objective and quantitative assessment of the optic disc and the peripapillary RNFL is useful both in glaucoma diagnosis and monitoring of disease progression [3-7].

Optical coherence tomography (OCT) is a noninvasive imaging modality, which can quantitatively assess both the optic disc and the RNFL. In both optic disc and RNFL evalu- ation, the fundamental starting point is the delineation of the optic disc margin. Measurements of optic disc parameters, including the disc area, cup/disc ratio, and rim area, are influ- enced by optic disc demarcation. It is also crucial to define the disc margin prior to peripapillary RNFL assessment be-

cause, physiologically, the RNFL is thickest around the disc margin and gradually becomes thinner at distances further from the margin.

Previous versions of OCT (OCT1, OCT2, and Stratus OCT) automatically defined the optic disc margin in optic disc analysis as the border between the retinal pigment epi- thelium (RPE)/choriocapillaries and the tissue beyond this border [8-10]. Although Stratus OCT employs interpolation between 12 measured points of the RPE/choriocapillary edge to create a best-fit curve for the optic disc margin, rather than directly connecting the 12 points, the margin remains princi- pally determined by reference to the RPE/choriocapillary border. This may be problematic in optic discs with peri- papillary atrophy (PPA). The β-zone of the PPA, which is close to the disc margin, is defined as an area devoid of RPE or where the RPE is atrophied with visible large choroidal vessels and sclera [11]. PPA can be seen in both healthy and glaucomatous eyes but is known to be more frequent and se- vere in glaucomatous eyes [11-13]. Some studies have re- ported that an increase in the PPA area can be an indicator of glaucoma progression [14,15]. Thus, PPA is not rare in glau- coma patients, although PPA size can vary.

The recently introduced spectral domain OCT (SD-OCT)

offers higher resolution and a faster scan speed than that of-

(2)

A B

Fig. 1. (A) The optic disc image acquired in the fast optic disc mode of the Stratus optical coherence tomography (OCT). The posterior boundary of the retina was shown as a single thick hyper-reflective red-colored band, displayed in false color (black arrow). This posterior boundary has been interpreted as the complex of the retinal pigment epithelium (RPE) and the junction between the inner and outer seg- ment (IS/OS) of photoreceptor layer. The white arrow indicates peripapillary retinal nerve fiber layer (RNFL). (B) Spectralis OCT images showed posterior retinal boundaries as composed of at least two layers, one thick and one thin layer. The red arrow indicates peripapillary RNFL, and the inner thinner layer has been defined as the junction between the IS/OS of the photoreceptor layer (yellow arrow), whereas the outer thicker layer has been considered to represent the Bruch’s membrane/RPE border (blue arrow).

fered by previous instruments. One commercially-available SD-OCT, the Spectralis OCT (Heidelberg Engineering, Heidelberg, Germany) has a scan speed 100-fold faster than that offered by conventional Stratus OCT. This increased scan speed allows more data points to be collected within a short timeperiod [16]. Improved scan resolution and more data acquisition may provide a higher quality image sur- rounding the optic disc. Therefore, we imaged and evaluated detailed eye structures of PPA patients, with particular atten- tion focused on the peripheral β-zone among healthy eyes, glaucomatous eyes, and glaucoma-suspect eyes using SD-OCT.

Materials and Methods

Study participants were recruited in a consecutive manner from our glaucoma clinic at the Asan Medical Center, be- tween December 2008 and January 2009. All participants gave informed consent before enrollment. All procedures conformed to the Declaration of Helsinki, and the study was approved by the Institutional Review Board of the Asan Medical Center.

All subjects underwent a complete ophthalmologic exami- nation; visual acuity testing; the Humphrey field analyzer Swedish interactive threshold algorithm 24-2 test (Carl Zeiss Meditec Inc., Dublin, CA, USA); multiple intraocular pres- sure (IOP) measurements using Goldmann applanation ton- ometry; stereoscopic optic nerve photography; and Spectralis OCT, including medical, ocular, and family history.

Glaucomatous eyes were defined as those with a glaucoma- tous visual field (VF) defect confirmed by two reliable VF examinations and by the appearance of a glaucomatous optic disc, irrespective of the level of IOP. A glaucomatous optic disc was defined by increased cupping (vertical cup-disc ra- tio > 0.6), a difference in vertical cup-disc ratio > 0.2 be- tween eyes, diffuse or focal neural rim thinning, hemorrhage, and RNFL defects. Glaucoma-suspect eyes were defined as

those with glaucomatous optic disc test results, but showing normal VF test data. Healthy eyes were defined as those with healthy optic discs and normal VF test results. Glaucomatous VF defects were defined when eyes met at least two of the following criteria: 1) a cluster of three points with a proba- bility of less than 5% on the pattern deviation map in at least one hemifield and including at least one point with a proba- bility of less than 1%, or a cluster of two points with a proba- bility less than 1%; 2) a glaucoma hemifield test result out- side 99% of the age-specific normal limits; and 3) a pattern standard deviation outside 95% of the normal limit.

Among subjects qualified by other inclusion criteria, pa- tients with discernable PPA, regardless of PPA size on stereo- scopic optic disc photography, were analyzed. PPA was dif- ferentiated into PPA of the peripheral α-zone, with irregular pigmentation, and PPA of the central β-zone, with visible sclera and large choroidal vessels. The presence and extent of a β-zone on an optic disc photograph was independently as- sessed by three glaucoma experts (MSK, KRS, and JHN), and those cases agreed upon by all three experts were in- cluded in the analyses.

The raster scan mode of the Spectralis OCT, which covers

an area of 6 mm × 6 mm, was used to acquire optic disc

images. The Spectralis OCT obtains two images, using si-

multaneous dual laser scanning which include an infrared

image in the scanning laser ophthalmoscope (SLO) mode

and an OCT scan. SLO images were used as a reference for

OCT scans. An online tracking system was used to correct

for eye movements. A three-dimensional volumetric dataset

composed of 25 line scans was obtained for each subject. All

images obtained by the Spectralis OCT were reviewed and

independently evaluated by two glaucoma experts (MSK and

KRS). As the Spectralis OCT does not provide any scan

quality score measurement, images of poor quality were sub-

jectively excluded when over 10% of reflectance signals

(3)

Table 1. Demographics and clinical characteristics of study participants

Subject no./eye Gender/age (yr) Diagnosis BCVA (spherical equivalent) VF MD (dB) VF PSD (dB)

1/right M/68 GS 20/30 (1) 0.2 1.32

2/right M/53 GS 20/20 (1.25) - 0.87 1.55

2/left M/53 GS 20/20 (1.25) - 1.12 1.83

3/right F/61 GS 20/30 (2.25) - 0.11 1.23

3/left F/61 GS 20/30 (1.75) 0.58 1.12

4/right M/44 GS 20/20 (-6.75) 0.52 1.36

4/left M/44 GS 20/20 (-6.5) 0.98 1.42

5/right M/44 GS 20/20 (0.25) - 1.89 1.33

5/left M/44 GS 20/25 (0.25) -1.58 1.35

6/right F/33 G 20/20 (-1.0) - 2.69 1.98

6/left F/33 G 20/20 (-1.5) - 2.17 2.11

7/right F/71 G 20/25 (0.25) - 1.58 2.16

7/left F/71 GS 20/30 (0.5) -3.65 1.83

8/right M/29 G 20/20 (-7.25) - 2.79 6.99

8/left M/29 G 25/20 (-6.5) - 13.5 12.61

9/right M/36 GS 20/20 (-2.25) - 0.78 1.25

9/left M/36 GS 25/20 (-1.75) - 0.01 1.56

10/right M/57 G 20/25 (-2.0) - 5.76 9.03

10/left M/57 GS 20/20 (-1.25) - 1.79 1.78

BCVA = best corrected visual acuity; VF = visual field; MD = mean deviation; PSD = pattern standard deviation; GS = glaucoma suspect; G = glaucoma.

were absent in the line data. Pharmacologic dilation was per- formed if the pupil was small. All images were acquired by a single, well-trained operator (YL).

Optic disc scan images acquired by the Spectralis OCT show the detailed configuration of the retinal layer posterior boundary. With the Stratus OCT, the optic disc image ac- quired in the fast mode, featuring 128 A scans, shows the posterior boundary as a single thick hyper-reflective red-col- ored band, displayed in false color (Fig. 1A, black arrow).

This posterior boundary has been interpreted as the complex of the RPE and the junction between the inner and outer seg- ment (IS/OS) of the photoreceptor layer. In Fig. 1A, a white arrow indicates peripapillary RNFL.

The Spectralis OCT images, however, show posterior reti- nal boundaries composed of at least two layers, including one thinner and one thicker layer (Fig. 1B). In Fig. 1B, the red ar- row indicates peripapillary RNFL, and the inner thinner layer has been defined as the junction between the IS/OS of the photoreceptor layer (yellow arrow), whereas the outer thick- er layer has been considered to represent the Bruch’s mem- brane/RPE border (blue arrow) [17]. Due to these difficulties in interpretation, each of two glaucoma specialists (MSK and KRS) independently evaluated the detailed features of the posterior boundaries and RNFLs in PPA β-zones of eyes with healthy, glaucoma-suspect, and glaucomatous optic discs imaged by the Spectralis OCT. The evaluation of the PPA β -zones was performed along the multiple straight horizontal lines on the temporal sides of optic disc. We selected one rep- resentative scan line from each eye with PPA. The presence or absence of various layers (RNFL, IS/OS complex, and

Bruch’s membrane/retinal pigment epithelium complex lay- er [BRL]) was noted. A final description of the retinal layers present was obtained by consensus.

Results

Nineteen eyes of 10 healthy, glaucoma, and glaucoma- suspect subjects, all with PPA, were consecutively imaged.

Demographic and clinical characteristics of participants are described in Table 1. RNFLs were observed in the β-zones of all PPA eyes. IS/OS complexes were absent from the PPA β -zone areas of all eyes. BRLs could not be seen in the PPA β -zones of two eyes. BRLs were atrophic and showed posteri- or bowing in the PPA β-zones of five eyes. Table 2 summa- rizes the SD-OCT findings for each PPA eye. Representative cases are presented below as examples.

Case 1

A 68-year-old man was examined under suspicion of glaucoma. All three glaucoma experts agreed that the subject showed a glaucomatous optic disc and accompanying PPA.

The extent of the β-zone (red arrow) and optic disc margin

(blue arrow) was demarcated on the temporal side of optic

disc (Fig. 2A). PPA was well visualized on the SLO images

from the Spectralis OCT (Fig. 2B). Cross-sectional imaging

of the optic disc scanned by the Spectralis OCT showed reti-

nal layer details at high resolution. The extent of the β-zone

(red arrow) was shown in SLO and cross-sectional images of

the Spectralis OCT. The RNFL (yellow arrow) and BRL

(4)

Table 2. Features of the peripapillary atrophy β-zone observed by spectral domain optical coherence tomography imaging of healthy, glaucoma-suspect, and glaucomatous eyes

Subject no./eye Gender/age (yr) Diagnosis RNFL IS/OS complex BRL Bowing of BRL

1/right M/68 GS Y N Y N

2/right M/53 GS Y N Y N

2/left M/53 GS Y N Y N

3/right F/61 H Y N Y Y

3/left F/61 GS Y N Y N

4/right M/44 H Y N N N

4/left M/44 GS Y N N N

5/right M/44 GS Y N Y Y

5/left M/44 GS Y N Y Y

6/right F/33 G Y N Incomplete Y

6/left F/33 G Y N Incomplete Y

7/right F/71 G Y N Y N

7/left F/71 GS Y N Y N

8/right M/29 G Y N Incomplete Y

8/left M/29 G Y N Incomplete Y

9/right M/36 GS Y N Y Y

9/left M/36 GS Y N Incomplete Y

10/right M/57 G Y N Y N

10/left M/57 GS Y N Y N

RNFL=retinal nerve fiber layer; IS/OS=inner and outer segment of photoreceptor; BRL=Bruch’s membrane/retinal pigment epithelium complex layer; GS=glaucoma suspect; G=glaucoma; H=healthy; Y=yes; N=no.

A

Fig. 2. (A) Showed the extent of the β-zone (red arrow) and optic disc mar- gin (blue arrow) demarcated on the temporal side of a glaucomatous optic disc. (B) Peripapillary atrophy (PPA) was visualized on scanning laser oph- thalmoscope (SLO) images from the Spectralis optical coherence tomog- raphy (OCT). (C) The extent of the β-zone (red arrow) was described in SLO and cross-sectional images of the Spectralis OCT. The retinal nerve fi- ber layer (yellow arrow) and Bruch’s membrane/retinal pigment epithelium complex layer (BRL) (green arrow) were easily seen in the β-zone of OCT PPA images. The BRL was intact around the optic disc margin and showed hyper-reflectance. However, the inner and outer segment complexes (pink arrow) were absent from the β-zone of the PPA area.

B C

(5)

A C

B D

Fig. 3. (A) Showed the extent of the β-zone (red arrow) and optic disc margin (blue arrow) on the temporal side of a healthy optic disc.

(B) Peripapillary atrophy (PPA) was well-visualized by Spectralis optical coherence tomography (OCT) scanning laser ophthalmoscope imaging. (C) In a cross-sectional image of the optic disc scanned by the Spectralis OCT, the retinal nerve fiber layer (yellow arrow) and Bruch’s membrane/retinal pigment epithelium complex layer (BRL) (green arrow) were observed in the β-zone PPA area, whereas the inner and outer segment complexes (pink arrow) were absent. The BRL edge showed slight posterior bowing around the optic disc margin. (D) The Stratus OCT image also showed slight posterior bowing of the BRL (white arrow), and the automatic disc margin de- tection algorithm failed to detect the edge of the optic disc margin (black arrow).

(green arrow) were easily seen in the β-zone of the OCT PPA images. The BRL was intact around the optic disc margin and showed hyper-reflectance. However, the IS/OS complexes (pink arrow) were absent from the β-zone of the PPA area (Fig. 2C).

Case 2

A 61-year-old woman with a healthy optic disc showed PPA on the temporal side and the extent of the β-zone (red ar- row) and optic disc margin (blue arrow) was indicated on the temporal side of optic disc (Fig. 3A). PPA was well-vi- sualized by Spectralis OCT SLO imaging (Fig. 3B). In a cross-sectional image of the optic disc scanned by the Spectralis OCT, the RNFL (yellow arrow) and BRL (green arrow) were observed in the β-zone PPA area, whereas the IS/OS complexes (pink arrow) were absent. The BRL was in- tact and showed strong reflectance, but the BRL edge showed slight posterior bowing around the optic disc margin (Fig. 3C). The Spectralis OCT image and the image obtained from the Stratus OCT fast optic disc mode were compared.

The Stratus OCT image also showed slight posterior bowing of the BRL (white arrow), but the automatic disc margin de- tection algorithm failed to detect the edge (Fig. 3D, black ar- row).

Case 3

A 29-year-old man was examined under suspicion of

glaucoma. Examination of the optic disc revealed advanced

cupping, multiple RNFL bundle defects, and marked PPA in

fundus photography (Fig. 4A). The extent of the β-zone (red

arrow) and optic disc margin (blue arrow) was shown on the

temporal side of the optic disc (Fig. 4A). PPA and RNFL

bundle defects were also seen on Spectralis OCT SLO imag-

ing (Fig. 4B). In a cross-sectional image of the optic disc ob-

tained by the Spectralis OCT, the RNFL was thinner when

the scan line passed through the RNFL bundle defect area

(Fig. 4B, green scan line), but the RNFL (yellow arrow) was

nonetheless observed in the β-zone of PPA. The IS/OS com-

plexes (pink arrow) were absent from the β-zone of the PPA

area. The BRL was atrophic and posteriorly bowed in the β

(6)

A

Fig. 4. (A) Showed the extent of the β-zone (red arrow) and optic disc margin (blue arrow) on the temporal side of a glaucomatous optic disc.

(B) Peripapillary atrophy (PPA) and retinal nerve fiber layer (RNFL) bundle defects were also seen on Spectralis optical coherence tomog- raphy (OCT) scanning laser ophthalmoscope imaging. In a cross-sec- tional image of the optic disc obtained by Spectralis OCT, the RNFL was thinner when the scan line passed through the RNFL bundle defect area (green scan line in B), but RNFL (yellow arrow) was observed in the β-zone of PPA. Inner and outer segment complexes (pink arrow) were absent from the β-zone of the PPA area. The Bruch’s mem- brane/retinal pigment epithelium complex layer was atrophic and pos- teriorly bowed in the β-zone of the PPA area (C).

B C

-zone of the PPA area (Fig. 4C).

Discussion

When using Stratus OCT to examine optic discs, we sometimes find that disc margin detection is inappropriate and this (if uncorrected) may lead to unreliable optic disc pa- rameter measurements. This may be one reason why OCT optic disc analysis has been less frequently used in both re- search and clinical settings, as compared to RNFL analysis.

Inappropriate automatic disc margin determination by Stratus OCT may be explained in two ways. First, although Stratus OCT employs an RPE/choriocapillary edge detection algo- rithm to determine the optic disc margin, we have demon- strated that the RPE/choriocapillary edge may not be an ac- curate disc margin marker in optic discs with PPA [8-10].

Second, the poor scan quality around the disc margin af- forded by OCT may contribute to errors in optic disc margin detection.

In the vicinity of the optic disc, ocular structure is very complex. This may result in difficulties in image delineation.

The fast optic disc mode of the Stratus OCT instrument makes only 128 A scans in each optic disc pass, leading to poor image resolution. It is difficult to discern complex struc- tures around the optic disc. Poor image quality means that RPE edge detection is unreliable. Thus, we aimed to image the complex structures of the peripapillary retinal layer, in- cluding the β-zone of PPA, using high-resolution SD-OCT.

The higher-quality images of SD-OCT showed that the β -zone of the PPA features were not uniform in healthy and glaucomatous optic discs, or in discs of glaucoma-suspect eyes. The presence or absence of particular structures varied among PPA eyes. A common finding was that the IS/OS junction was not observed in the β-zones of PPA eyes, usu- ally indicating that photoreceptors are absent from the β-zone of the PPA areas. The other important finding was that detec- tible RNFLs were observed in the β-zone of most PPA areas.

Thus, RNFLs were retained despite glaucoma-induced RNFL thickness reductions in the β-zone of the PPA areas.

We found that 12 of 19 eyes showed intact BRL complexes

within the β-zone of the PPA areas. However, as exemplified

in case 2 above, some eyes showed posterior bowing of the

(7)

Bruch’s membrane/RPE complex rather than a relatively lin- ear arrangement. In such cases, the current automatic disc margin detection algorithm of the Stratus OCT may fail to demarcate disc margins with precision. As shown in case 2, automatic disc margin detection by the Stratus OCT did not include the posteriorly bowed terminus of the BRL, resulting in delineation of an erroneously large disc margin.

In 7 of 19 eyes, the BRL was atrophic or absent within the PPA β-zone. As illustrated in case 3, the BRL appeared to be thinner and incomplete around the optic disc margin, and showed posterior bowing. This finding is in line with the original definition of the PPA β-zone, which is an area devoid of, or atrophic for, RPE and choriocapillaries [11]. This em- phasizes that the BRL cannot serve as a useful disc marginal marker in PPA eyes. In these situations, the Stratus OCT is prone to error when determining the optic disc margin.

A limitation of our study is that we did not quantitatively define the β-zone of PPA areas, nor did we match such areas with OCT images. However, our primary goal was to show how the PPA β-zone is presented on high-quality OCT images. Such data have never been previously reported.

Furthermore, we demonstrate that retinal layer features are not uniform in the β-zone of PPA areas.

In conclusion, the β-zones of PPA showed fine-structure variability when evaluated by SD-OCT imaging. If both PPA and the disc margin are important concepts in glaucoma diag- nosis, then determination of the optic disc margin needs to be customized, based on PPA characteristics. Application of au- tomated disc margin detection software without consid- eration of specific PPA architecture may be scientifically invalid.

Conflict of Interest

No potential conflict of interest relevant to this article was reported.

References

1. Sommer A, Katz J, Quigley HA, et al. Clinically detectable nerve fiber atrophy precedes the onset of glaucomatous field loss. Arch Ophthalmol 1991;109:77-83.

2. Quigley HA, Katz J, Derick RJ, et al. An evaluation of optic disc and nerve fiber layer examinations in monitoring pro- gression of early glaucoma damage. Ophthalmology 1992;99:

19-28.

3. Schuman JS, Pedut-Kloizman T, Hertzmark E, et al. Repro-

ducibility of nerve fiber layer thickness measurements using optical coherence tomography. Ophthalmology 1996;103:1889-98.

4. Weinreb RN, Shakiba S, Zangwill L. Scanning laser polar- imetry to measure the nerve fiber layer of normal and glau- comatous eyes. Am J Ophthalmol 1995;119:627-36.

5. Medeiros FA, Zangwill LM, Bowd C, Weinreb RN.

Comparison of the GDx VCC scanning laser polarimeter, HRT II confocal scanning laser ophthalmoscope, and stratus OCT optical coherence tomograph for the detection of glaucoma.

Arch Ophthalmol 2004;122:827-37.

6. Leung CK, Chan WM, Chong KK, et al. Comparative study of retinal nerve fiber layer measurement by Stratus OCT and GDx VCC. I: correlation analysis in glaucoma. Invest Ophthalmol Vis Sci 2005;46:3214-20.

7. Kanamori A, Nagai-Kusuhara A, Escaño MF, et al. Comparison of confocal scanning laser ophthalmoscopy, scanning laser po- larimetry and optical coherence tomography to discriminate ocular hypertension and glaucoma at an early stage. Graefes Arch Clin Exp Ophthalmol 2006;244:58-68.

8. Hee MR, Izatt JA, Swanson EA, et al. Optical coherence to- mography of the human retina. Arch Ophthalmol 1995;113:

325-32.

9. Schuman JS, Hee MR, Puliafito CA, et al. Quantification of nerve fiber layer thickness in normal and glaucomatous eyes using optical coherence tomography. Arch Ophthalmol 1995;

113:586-96.

10. Pieroth L, Schuman JS, Hertzmark E, et al. Evaluation of focal defects of the nerve fiber layer using optical coherence tomography.

Ophthalmology 1999;106:570-9.

11. Jonas JB, Naumann GO. Parapapillary chorioretinal atrophy in normal and glaucoma eyes. II. Correlations. Invest Ophthalmol Vis Sci 1989;30:919-26.

12. Jonas JB, Königsreuther KA, Naumann GO. Optic disc histo- morphometry in normal eyes and eyes with secondary an- gle-closure glaucoma. II. Parapapillary region. Graefes Arch Clin Exp Ophthalmol 1992;230:134-9.

13. Jonas JB, Fernández MC, Naumann GO. Glaucomatous para- papillary atrophy. Occurrence and correlations. Arch Ophthalmol 1992;110:214-22.

14. Araie M, Sekine M, Suzuki Y, Koseki N. Factors contributing to the progression of visual field damage in eyes with nor- mal-tension glaucoma. Ophthalmology 1994;101:1440-4.

15. Park KH, Tomita G, Liou SY, Kitazawa Y. Correlation be- tween peripapillary atrophy and optic nerve damage in nor- mal-tension glaucoma. Ophthalmology 1996;103:1899-906.

16. Menke MN, Dabov S, Knecht P, Sturm V. Reproducibility of retinal thickness measurements in healthy subjects using spec- tralis optical coherence tomography. Am J Ophthalmol 2009;147:467-72.

17. Srinivasan VJ, Monson BK, Wojtkowski M, et al. Characteriz-

ation of outer retinal morphology with high-speed, ultrahigh-

resolution optical coherence tomography. Invest Ophthalmol

Vis Sci 2008;49:1571-9.

수치

Table 1. Demographics and clinical characteristics of study participants
Fig. 2. (A) Showed the extent of the β-zone (red arrow) and optic disc mar- mar-gin (blue arrow) demarcated on the temporal side of a glaucomatous optic  disc
Fig. 3. (A) Showed the extent of the β-zone (red arrow) and optic disc margin (blue arrow) on the temporal side of a healthy optic disc
Fig. 4. (A) Showed the extent of the β-zone (red arrow) and optic disc  margin (blue arrow) on the temporal side of a glaucomatous optic disc

참조

관련 문서

Retinal nerve fiber layer (RNFL) thickness curves for control and peripapillary (PPA) groups obtained by optical coherence to- mography with various scan circle sizes.. The

Retinal Nerve Fiber Layer Thickness Measurement Comparison Using Spectral Domain and Swept Source Optical Coherence Tomography.. Ahnul Ha, Seung Hyen Lee, Eun Ji Lee,

Purpose: To evaluate the effect of the scanning laser ophthalmoscope (SLO) guided re-test mode on short- and long-term measurement variability of peripapillary retinal nerve

Purpose: To evaluate the association between age and peripapillary retinal nerve fiber layer (RNFL) thickness measured by Cirrus high-definition (HD) spectral domain optical

Age and visual acuity of patients dif- fered significantly between the high- and low-SS groups when data acquired using the optic disc (p = 0.027 and 0.012, respectively) and

We reviewed the medical records of 185 normal and primary open angle glaucoma (POAG) subjects for whom peripapillary retinal nerve fiber layer (PP-RNFL), ganglion

The aim of this study was to investigate the direct relation- ship between peripapillary retinal nerve fiber layer (RNFL) thickness measured by optical coherence tomogra- phy (OCT)

Comparison of the gan- glion cell complex and retinal nerve fibre layer measurements us- ing Fourier domain optical coherence tomography to detect gan- glion cell loss in