INTRODUCTION
Glaucoma is a disease that leads to blindness, and early diag- nosis is important to maintain vision. Because glaucoma pa- tients do not experience the subjective symptoms of glauco- matous visual field loss or visual damage until the disease has progressed to an advanced stage, the role of ophthalmic exam-
inations for measurement of retinal nerve fiber layer (RNFL) thickness or visual field is important for ensuring timely diag- nosis. Optical coherence tomography (OCT) is a well-known modality providing objective evaluation of structural altera- tions in the optic nerve head or macular area.1-3 The develop- ment of OCT from time-domain OCT to spectral-domain OCT has increased the resolution and acquisition speed of OCT images, as well as the accuracy of glaucoma diagnosis.4,5 Re- cently, swept-source OCT, a new OCT system with a novel light source and detector, has been introduced. This device uses a 1050-nm tunable light source with narrow line width and a simply designed light detector. The long-wave light source allows for the identification of the deep retinal struc- ture. In addition, a large covering range (from the macula to the optic disc) can be obtained using the wide scanning mode, with a scanning speed up to 100000 A-scans/s. We previously compared swept-source OCT and spectral-domain OCT in terms of artifact type and frequency in source data and final
Diagnostic Ability of Swept-Source and Spectral-Domain Optical Coherence Tomography for Glaucoma
Sang Yeop Lee, Hyoung Won Bae, Gong Je Seong, and Chan Yun Kim
Department of Ophthalmology, Severance Hospital, Institute of Vision Research, Yonsei University College of Medicine, Seoul, Korea.
Purpose: To compare the diagnostic abilities of swept-source optical coherence tomography (OCT) [Deep Range Imaging OCT-1 (DRI-OCT)] and spectral-domain OCT (Cirrus HD-OCT) for glaucoma in Korean adults.
Materials and Methods: This retrospective study involved measuring peripapillary retinal nerve fiber layer (PP-RNFL) thickness, full macular thickness, and ganglion cell-inner plexiform layer (GC-IPL) thickness on two different OCT systems. We used three- dimensional optic disc scanning of DRI-OCT and included 12 clock-hour sectors for measurement of the PP-RNFL. Areas under receiver operating characteristic curves (AUCs) were calculated and compared to determine how well each system could distin- guish control and glaucomatous patients.
Results: Ninety-one healthy and 58 glaucomatous eyes were included. Both systems could clearly distinguish between control eyes and eyes with moderate to severe glaucoma. Among all sectors, the AUC values of areas associated with glaucoma were >0.7 for both OCTs. The PP-RNFL sector of highest AUC value on both OCTs was the inferior sector of the clock-hour map (0.968 and 0.959 in DRI-OCT and Cirrus HD-OCT, respectively). Among macular thickness sectors, AUC values were highest on both OCTs for the outer inferior sector (0.859 and 0.853 in DRI-OCT and Cirrus HD-OCT, respectively). The GC-IPL also provided high diagnostic values (DRI-OCT and Cirrus HD-OCT were the best in the average and inferior sectors, respectively).
Conclusion: Although the two OCT systems provided different thickness measurements, DRI-OCT exhibited as good, if not bet- ter, diagnostic ability for glaucoma as Cirrus HD-OCT in Korean adults.
Key Words: Glaucoma, diagnostic ability, spectral domain optical coherence tomography, swept source optical coherence tomog- raphy
pISSN: 0513-5796 · eISSN: 1976-2437
Received: March 22, 2018 Revised: June 25, 2018 Accepted: July 3, 2018
Corresponding author: Chan Yun Kim, MD, PhD, Department of Ophthalmology, Severance Hospital, Institute of Vision Research, Yonsei University College of Med- icine, 50-1 Yonsei-ro, Seodaemun-gu, Seoul 03722, Korea.
Tel: 82-2-2228-3570, Fax: 82-2-312-0541, E-mail: [email protected]
•The authors have no financial conflicts of interest.
© Copyright: Yonsei University College of Medicine 2018
This is an Open Access article distributed under the terms of the Creative Com- mons Attribution Non-Commercial License (https://creativecommons.org/licenses/
by-nc/4.0) which permits unrestricted non-commercial use, distribution, and repro- duction in any medium, provided the original work is properly cited.
Yonsei Med J 2018 Sep;59(7):887-896 https://doi.org/10.3349/ymj.2018.59.7.887
print out,6 and measured repeatability and agreement be- tween the two types of OCT.7 From these studies, we verified that swept-source OCT provides results that are sufficiently reliable to be used in clinical practice. Determining the diag- nostic ability of swept-source OCT for glaucoma was the next step, and several studies were conducted to compare the di- agnostic ability between spectral-domain OCT and swept- source OCT.8-11 However, most studies used Spectralis OCT (Heidelberg Engineering, Heidelberg, Germany) as spectral-do- main OCT.9-11 Only one study used Cirrus HD-OCT (Carl Zeiss Meditec, Inc., Dublin, CA, USA) with the wide angle mode of swept-source OCT to measure the thickness of macular or peripapillary area in a non-Asian population.8
Therefore, in the present study, we compared the diagnostic ability of swept-source OCT [Deep Range Imaging OCT-1 (DRI-OCT), software version 9.1.2.28693, Topcon, Tokyo, Ja- pan] and spectral-domain OCT (Cirrus HD-OCT, software version 6.0.2.81) for glaucoma in the adult Korean population using wide-angle and three-dimensional (3D) optic disc pro- tocols for DRI-OCT.
MATERIALS AND METHODS
This study was approved by the Institutional Review Board of Yonsei University Severance Hospital (Reference No. 4-2017- 0112). All conducted research adhered to the tenets of the Declaration of Helsinki, and informed consent was obtained.
All subjects were examined at the glaucoma clinic of the De- partment of Ophthalmology at Severance Hospital, Yonsei University School of Medicine in Seoul, Korea. We reviewed the medical records of 185 normal and primary open angle glaucoma (POAG) subjects for whom peripapillary retinal nerve fiber layer (PP-RNFL), ganglion cell-inner plexiform layer (GC-IPL), and macular thickness measurements were obtained using both DRI-OCT and Cirrus HD-OCT on the same day, between June and December 2014. All subjects un- derwent ophthalmic examinations to evaluate Snellen best- corrected visual acuity, refractive spherical equivalent, and intraocular pressure using Goldmann applanation tonometry.
IOL Master (Carl Zeiss Meditec AG, Jena, Germany) and ultra- sonic pachymetry (DGH-1000; DGH Technology, Inc., Frazer, PA, USA) were used to measure axial length and central cor- neal thickness, respectively. RNFL defect and optic disc evalu- ation were performed using a +90 diopter lens and a red-free photograph (VISUCAM 200; Carl Zeiss Meditec AG). To screen POAG, a visual field test (24-2 Swedish Interactive Threshold Algorithm, Humphrey Visual Field Analyzer; Carl Zeiss Meditec, Inc., Dublin, CA, USA) was conducted. All ex- amination results were reviewed by two glaucoma specialists (S.Y.L. and H.W.B.) to recheck the diagnosis results of medical records. Another glaucoma specialist (C.Y.K.) confirmed medi- cal records again, if there was a disagreement.
Subjects
A group of normal patients was included in the study to serve as a control group. All control subjects were at least 19 years of age and had a best-corrected visual acuity of 20/25 or better.
Only individuals with a normal fundus, intraocular pressure <
21 mm Hg, and normal visual field were included in the con- trol group. The inclusion criteria for control group in this study were the same as those in a previous study,7 since the current study was conducted as a follow-up to the previous study. Sub- jects were excluded from participation if they had an spherical equivalent larger than ±5 diopter, a cylindrical refractive error larger than 3 diopter, an axial length longer than 26.5 mm, any type of cataract more severe than a Grade 3 (Lens Opacities Classification System III12), a pre-existing optic nerve or reti- nal abnormality, a systemic or ocular condition associated with visual field defects, previous intraocular surgery, or glau- comatous changes discovered during study assessments. Sub- jects showing an image quality score of DRI-OCT <60 or signal strength of Cirrus HD-OCT <6 were also excluded.
Subjects placed into POAG study groups had glaucomatous optic nerve head changes related to a visual field defect that satisfied at least two Anderson and Patella criteria with open angle structure. These patients had undergone at least three visual field tests, demonstrating a visual field defect in at least three tests. Glaucoma patients were classified as either early or moderate-to-severe according to the Hodapp-Parrish-An- derson criteria.13 Inclusion criteria regarding age and vision and exclusion criteria regarding refractive error, cataract sta- tus, medical history, and OCT quality score were identical to those used for the control group. In addition, other types of glaucoma were also excluded. For glaucomatous subjects, the eye with a more severe glaucoma status was chosen as the study eye. If subjects had a similar glaucoma severity in both eyes, the study eye was randomly selected. For subjects with normal eyes, the study eye was also randomly selected.
Thickness measurements using optical coherence tomography
For Cirrus HD-OCT scans, the optic disc cube 200×200 and macular cube scan 512 A-scans×128 B-scans protocols were used to measure PP-RNFL, macular, and GC-IPL thickness. To measure PP-RNFL thickness from Cirrus HD-OCT scans, a scan circle of 3.46 mm in diameter was used. The 3D optic disc and wide scan protocols were used to measure PP-RNFL, macular, and GC-IPL thickness using DRI-OCT. The 3D optic disc scan is comprised of 512 A-scans×256 B-scans covering a 6×6 mm square area centered on the optic disc. Data along a scan cir- cle of 3.4 mm in diameter was used to evaluate PP-RNFL thick- ness. The 3D wide scan images a 12×9 mm rectangular area centered between the optic disc and the fovea. The final scan is composed of 512 A-scans×256 B-scans. This wide scan was used to evaluate macular and GC-IPL thickness.
A total of 17, 10, and seven retinal sectors were investigated
for PP-RNFL, macular, and GC-IPL evaluations, respectively.
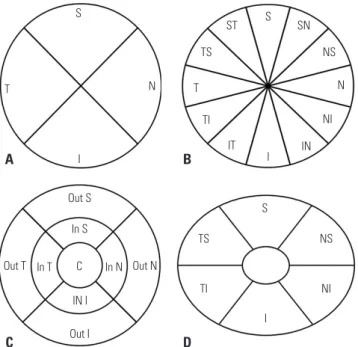
All thickness data were obtained using the automated segmen- tation algorithms of each OCT device. The PP-RNFL measure- ments were obtained by measurements in four and 12 sectors (Fig. 1A and B, respectively). To classify measurement areas, quadrant PP-RNFL sector names were started with the num- ber 4 and 12 clock hour sector names were started with the number 12. The macular thickness was obtained in each of the nine Early Treatment Diabetic Retinopathy Study (Fig. 1C) sectors. The diameters of three concentric circles that make up the Early Treatment Diabetic Retinopathy Study sector grid were 1, 3, and 6 mm. The GC-IPL was measured in each of six sectors (Fig. 1D). With these sectorial thicknesses, the average thickness of the total measurement area was also obtained for PP-RNFL (PP Aver), macular (Macular Aver), and GC-IPL (GC- IPL Aver) evaluations.
Statistical analyses
All statistical analyses were performed using SAS statistical software (version 9.2; SAS Inc., Cary, NC, USA). Data were compared between study groups using analysis of variance and chi-squared tests. The predictive power for glaucoma was compared between the two OCT systems using the receiver operating characteristic (ROC) curve. Areas under ROC curves (AUCs) were calculated and compared among control, early
glaucoma, and moderate-to-severe glaucoma groups using the Delong method.14 Statistical significance was defined as p<
0.05.
RESULTS
Among 185 subjects, 36 subjects were excluded. Among the excluded subjects, 18 subjects had a false diagnosis, and 11 subjects showed low OCT image quality. Finally, 91 eyes of 91 subjects were normal and 58 eyes of 58 subjects were glauco- matous. Of the 58 glaucomatous eyes, 32 had early disease and 26 had moderate-to-severe disease. Table 1 summarizes the subject characteristics. None of the study groups showed significant differences in any systemic or ocular characteristic, with the exception of the visual field mean deviation.
Thickness comparison among control and study groups in each OCT system
All measurement sectors showed significant thickness differ- ences among control, early glaucoma, and moderate-to-se- vere glaucoma patients, except for four sectors in DRI-OCT measurements and nine sectors in Cirrus HD-OCT measure- ments (Table 2). The sectors that did not show any significant differences were areas of low importance in the diagnosis of glaucoma. Additionally, each retinal layer was thickest in con- trol eyes and thinnest in the moderate-to-severe glaucoma eyes in every sector examined, even in sectors where there were no significant differences.
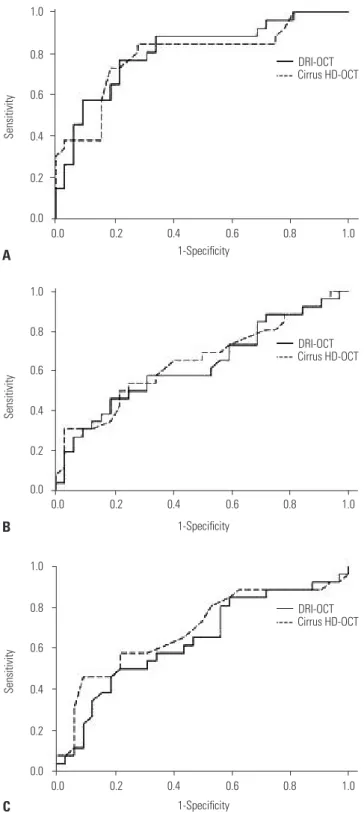
Comparison of glaucoma discrimination ability To determine how effectively each OCT system discriminated between normal and glaucomatous eyes, AUC values were examined in each sector (Table 3, Figs. 2, 3, and 4; only the ROC
Table 1. Subjects and Ocular Characteristics Control
(n=91)
Glaucoma (n=58) Early
(n=32)
Moderate to
severe (n=26) p value*
Age (yr) 54.3±15.81 54.6±14.72 54.4±12.33 0.832
Sex (M:F) 1:1.4 1:1.3 1:1.4 0.913
CCT (mm) 540.2±33.22 532.7±31.0 536.8±32.3 0.543 IOP (mm Hg) 14.3±2.63 14.2±2.35 13.6±2.48 0.274 AXL (mm) 23.5±1.40 23.7±1.40 23.4±1.57 0.262
>25.0 to ≤26.5 4 (4.4) 2 (6.3) 2 (8.3)
>23.0 to ≤25.0 87 (95.6) 30 (93.8) 24 (92.3)
SE (D) -1.31±2.31 -1.32±3.04 -1.18±2.94 0.681 MD (dB) -0.65±1.53 -2.38±1.55 -11.90±6.20 <0.001 CCT, central corneal thickness; IOP, intraocular pressure; AXL, axial length; SE, spherical equivalent; MD, mean deviation of visual field testing; SD, standard deviation.
Data are presented as mean±SD or number (%).
*ANOVA or chi-square test was used for statistical analyses.
S
T
I
N
S
S TS
TS
NS NS SN ST
T TI
TI C
Out S
Out I In S
In T In N
IN I
Out T Out N
IT I
I IN
NI
NI N
A
C
B
D
Fig. 1. Sectors used for optical coherence tomography (OCT) thickness measurements of peripapillary retinal nerve fiber layer thickness in both OCT systems (A: 4 sectors, B: 12 sectors). Sectors used for macular thick- ness (C) and ganglion cell inner plexiform layer thickness (D) measure- ments are also shown. All sectors shown are those used for right eye analyses. S, superior; N, nasal; I, inferior; T, temporal; SN, superonasal; NS, nasosuperior; NI, nasoinferior; IN, inferonasal; IT, inferotemporal; TI, tempo- roinferior; TS, temporosuperior; ST, superotemporal; Out S, outer superior;
Out N, outer nasal; Out I, outer inferior; Out T, outer temporal; In S, inner su- perior; In N, inner nasal; In I, inner inferior; In T, inner temporal.
curves for sectors of PP Aver, Macular Aver, and GC-IPL Aver are presented). In most sectors, the highest AUC value was ob- tained with both OCT data when the control and moderate-to- severe glaucoma groups were compared. PP-RNFL measure- ments revealed three sectors (4 nasal, 12 superior, and 12 nasosuperior) that had significantly different AUC values be-
tween the two OCT systems for control versus early glaucoma comparisons (Table 3, p=0.017, p=0.048, and p=0.005, respec- tively). Among these sectors, 12 superior sectors showed AUC values >0.7 in both OCT devices. Six different sectors (4 nasal, 12 superior, 12 superonasal, 12 nasosuperior, 12 nasal, and 12 nasoinferior) had significantly different PP-RNFL AUC values
Table 2. Average Retinal Layer Thickness in Normal and Glaucomatous Eyes
DRI-OCT (Mean±SD) Cirrus HD OCT (Mean±SD)
Control (n=91) E (n=32) MS (n=26) Overall p value* Control (n=91) E (n=32) MS (n=26) Overall p value*
PP-RNFL
PP Aver 107.31±10.67 87.12±16.61 67.96±14.97 <0.001 94.23±8.96 79.91±12.56 66.96±11.81 <0.001 4T 81.21±14.33 72.08±13.52 63.82±14.25 <0.001 71.44±13.45 63.22±12.41 57.31±12.66 <0.001 4S 132.72±17.50 107.96±24.16 84.34±25.77 <0.001 116.98±15.76 96.78±21.46 80.62±21.04 <0.001
4N 74.9±16.11 65.77±17.60 55.723±15.78 <0.001 65.96±10.35 64.25±10.27 61.69±8.94 0.158
4I 140.57±18.47 107.53±29.10 69.19±23.86 <0.001 121.47±20.42 95.44±22.76 68.58±19.75 <0.001
12T 67.6±11.21 65.01±12.68 62.88±10.55 0.146 55.99±10.59 53.75±11.15 52.04±9.22 0.197
12TS 95.9±19.37 89.27±23.07 71.17±22.06 <0.001 84.58±16.68 76.47±18.73 63.89±15.8 <0.001 12ST 142.38±23.57 118.33±29.21 80.14±32.65 <0.001 130.22±21.29 106.81±24.69 78.42±24.99 <0.001 12S 136.44±27.28 105.22±30.49 88.49±23.56 <0.001 119.56±25.51 98.28±30.19 84.96±23.88 <0.001 12SN 118.83±27.01 97.99±29.94 83.74±29.49 <0.001 101.75±23.55 83.94±23.39 80.77±19.95 <0.001
12NS 87.25±21.63 79.48±29.13 61.43±24.07 <0.001 76.67±16.18 75±14.27 68.73±12.22 0.066
12N 63.44±13.42 61.27±22.17 50.34±15.96 <0.001 57.98±10.02 56.845±9.64 55.96±10.99 0.780 12NI 73.79±19.19 65.47±18.10 56.49±15.63 <0.001 62.26±11.22 60.6±13.69 60.01±10.43 0.385 12IN 115.7±23.48 95.71±28.66 74.76±21.61 <0.001 96.69±18.55 82.22±19.86 67.58±13.51 <0.001 12I 155.5±29.31 114.91±32.39 73.07±30.96 <0.001 132.01±26.05 101.09±28.45 68.12±22.55 <0.001 12IT 150.41±27.23 107.29±38.38 61.34±37.68 <0.001 139.6±23.51 98.84±35.41 66.89±30.48 <0.001 12TI 80.4±18.04 71.48±25.90 58.69±17.32 <0.001 73.71±19.06 60.16±12.06 54.81±17.66 <0.001 MT
MT Aver 270.54±13.92 260.47±16.51 253.24±16.89 <0.001 279.09±13.27 269.38±16.9 260.58±17.54 <0.001 Center 225.60±18.37 224.77±15.60 223.33±25.51 0.484 245.63±19.45 245.37±13.92 241.58±27.18 0.387 In T 289.06±16.29 278.34±13.28 273.90±20.28 <0.001 309.84±18.80 303.31±16.19 302.81±20.56 0.026 In S 299.15±16.48 292.93±13.44 291.83±23.66 0.072 319.01±18.14 314.34±15.83 312.46±22.22 0.195 In N 299.07±17.73 295.43±15.15 295.28±20.03 0.517 316.67±18.84 315.3±17.53 313.54±28.21 0.753 In I 297.83±17.40 287.87±17.20 281.37±25.27 <0.001 314.95±18.07 304.81±19.16 297±27.38 <0.001 Out T 253.67±14.58 241.4±16.01 234.86±18.76 <0.001 270.48±21.67 257.31±20.86 255.73±24.15 <0.001 Out S 268.39±15.03 259.55±21.02 249.03±18.75 <0.001 280.01±15.01 273±21.33 260.77±18.31 <0.001 Out N 281.26±15.95 271.36±19.33 268.87±20.36 <0.001 287.55±22.30 284.56±23.22 275.12±26.60 0.060 Out I 255.20±14.52 239.5±21.88 226.58±28.91 <0.001 265.8±13.95 251.16±23.1 237.54±27.38 <0.001 GC-IPL
GC-IPL Aver 70.57±5.72 64.64±6.90 61.44±7.82 <0.001 81.3±7.02 73.94±8.57 67.54±10.38 <0.001
TS 72.72±5.85 67.47±6.67 63.47±8.05 <0.001 80.65±6.60 73.59±8.64 66.69±11.53 <0.001
S 69.03±5.91 63.87±7.63 59.33±10.04 <0.001 82.31±7.23 77.19±10.07 70.46±13.30 <0.001
NS 72.91±6.73 69.46±7.14 67.61±9.13 <0.001 83.54±7.74 79.41±8.71 77.62±10.69 <0.001
NI 70.96±6.22 64.81±8.26 62.80±8.19 <0.001 80.98±7.53 75.47±10.05 70.62±10.28 <0.001
I 65.53±5.96 57.83±8.58 56.31±10.79 <0.001 79.31±7.46 70.03±11.23 60.54±14.23 <0.001
TI 72.19±6.35 64.42±8.58 60.69±10.23 <0.001 81.21±7.95 69.88±13.16 59.27±15.01 <0.001 SD, standard deviation; E, early glaucoma; MS, moderate to severe glaucoma; PP-RNFL, peripapillary retinal nerve fiber layer thickness; PP Aver, average PP-RN- FL; MT, macular thickness; MT Aver, average MT; GC-IPL, ganglion cell-inner plexiform layer thickness; GC-IPL Aver, average GC-IPL; S, superior; N, nasal; I, infe- rior; T, temporal; SN, superonasal; NS, nasosuperior; N, nasoinferior; IN, inferonasal; IT, inferotemporal; TI, temporoinferior; TS, temporosuperior; ST, superotem- poral; Out S, outer superior; Out N; outer nasal; Out I, outer inferior; Out T, outer temporal; In S, inner superior; In N, inner nasal; In I, inner inferior; In T, inner temporal; TS, temporosuperior; NI, nasoinferior.
*ANOVA test was used for statistical analyses.
when the control and moderate-to-severe glaucoma groups were compared (Table 3, p=0.003, 0.013, 0.022, 0.003, 0.021, and 0.001, respectively). Among these sectors, 12 superior, 12 superonasal, and 12 inferonasal sectors showed AUC values
>0.7 in both OCT devices. Only 12 superonasal sectors had a
significantly different AUC value between OCT modalities in early glaucoma versus moderate to severe glaucoma compari- sons (Table 4). Most sectors showing significantly different AUC values were nasal areas of low importance for glaucoma diagnosis. The measurement sectors indicating superotempo-
Table 3. Receiver Operating Characteristic Curve Comparison for Glaucoma Discrimination Ability between Control Group and Glaucoma Group Control vs. Early glaucoma (C-E) Control vs. Moderate to severe glaucoma (C-MS)
DRI Cirrus
p value* DRI Cirrus
p value*
AUC 95% CI AUC 95% CI AUC 95% CI AUC 95% CI
PP-RNFL
PP Aver 0.851 0.755–0.947 0.818 0.715–0.921 0.242 0.979 0.956–1.000 0.951 0.906–0.996 0.070
4T 0.689 0.579–0.800 0.691 0.582–0.799 0.951 0.811 0.711–0.912 0.789 0.678–0.899 0.314
4S 0.824 0.727–0.919 0.780 0.673–0.885 0.140 0.932 0.874–0.991 0.899 0.817–0.983 0.147
4N 0.649 0.537–0.761 0.554 0.437–0.671 0.017 0.795 0.708–0.882 0.627 0.510–0.744 0.003
4I 0.816 0.717–0.915 0.809 0.712–0.905 0.654 0.981 0.959–1.000 0.958 0.923–0.993 0.133
12T 0.599 0.483–0.714 0.575 0.464–0.687 0.468 0.614 0.494–0.735 0.601 0.482–0.720 0.673
12TS 0.618 0.495–0.740 0.638 0.519–0.756 0.59 0.795 0.687–0.903 0.827 0.727–0.927 0.275
12ST 0.745 0.642–0.848 0.773 0.680–0.866 0.364 0.938 0.890–0.987 0.943 0.901–0.985 0.779
12S 0.795 0.701–0.890 0.725 0.611–0.839 0.048 0.910 0.848–0.971 0.856 0.763–0.950 0.013
12SN 0.749 0.646–0.851 0.735 0.629–0.842 0.592 0.814 0.720–0.909 0.753 0.647–0.859 0.022
12NS 0.621 0.499–0.742 0.519 0.407–0.632 0.005 0.791 0.695–0.887 0.637 0.523–0.750 0.003
12N 0.578 0.457–0.699 0.525 0.410–0.641 0.616 0.720 0.610–0.830 0.546 0.412–0.680 0.021
12NI 0.638 0.523–0.753 0.562 0.439–0.686 0.061 0.746 0.642–0.851 0.539 0.419–0.660 0.001
12IN 0.712 0.595–0.829 0.695 0.582–0.809 0.564 0.904 0.836–0.972 0.899 0.838–0.960 0.793
12I 0.828 0.743–0.913 0.794 0.697–0.891 0.263 0.968 0.938–0.997 0.959 0.924–0.992 0.504
12IT 0.822 0.738–0.906 0.838 0.757–0.919 0.465 0.933 0.863–1.000 0.937 0.878–0.995 0.653
12TI 0.686 0.581–0.790 0.719 0.625–0.814 0.275 0.810 0.713–0.915 0.799 0.685–0.912 0.530
MT
MT Aver 0.712 0.599–0.826 0.725 0.609–0.842 0.554 0.807 0.702–0.912 0.808 0.696–0.921 0.954
Center 0.500 0.384–0.617 0.558 0.447–0.668 0.605 0.575 0.454–0.696 0.582 0.458–0.705 0.811
In T 0.722 0.625–0.820 0.665 0.561–0.770 0.148 0.740 0.617–0.863 0.623 0.495–0.752 0.015
In S 0.637 0.531–0.742 0.571 0.457–0.686 0.060 0.592 0.452–0.732 0.573 0.435–0.711 0.494
In N 0.590 0.476–0.700 0.511 0.395–0.627 0.473 0.515 0.378–0.651 0.513 0.371–0.656 0.992
In I 0.675 0.564–0.784 0.661 0.549–0.773 0.554 0.713 0.579–0.846 0.724 0.589–0.859 0.548
Out T 0.761 0.660–0.862 0.716 0.602–0.829 0.282 0.808 0.683–0.933 0.713 0.584–0.842 0.043
Out S 0.690 0.574–0.805 0.668 0.549–0.788 0.262 0.795 0.691–0.899 0.782 0.678–0.886 0.496
Out N 0.670 0.549–0.792 0.553 0.434–0.672 0.006 0.681 0.554–0.808 0.635 0.506–0.763 0.338
Out I 0.772 0.664–0.881 0.754 0.637–0.870 0.431 0.859 0.746–0.973 0.853 0.737–0.969 0.473
GC-IPL
GC-IPL Aver 0.747 0.644–0.849 0.751 0.649–0.853 0.788 0.832 0.726–0.938 0.862 0.759–0.965 0.053
TS 0.726 0.627–0.824 0.747 0.649–0.846 0.266 0.827 0.729–0.925 0.848 0.746–0.949 0.239
S 0.712 0.604–0.819 0.681 0.567–0.795 0.150 0.793 0.683–0.903 0.772 0.657–0.888 0.228
NS 0.642 0.528–0.755 0.655 0.543–0.768 0.342 0.680 0.561–0.800 0.671 0.553–0.787 0.587
NI 0.715 0.606–0.823 0.668 0.553–0.785 0.017 0.793 0.693–0.893 0.802 0.703–0.901 0.674
I 0.759 0.648–0.871 0.745 0.633–0.858 0.426 0.794 0.676–0.913 0.867 0.757–0.977 0.002
TI 0.758 0.653–0.862 0.762 0.652–0.872 0.780 0.820 0.700–0.940 0.853 0.739–0.966 0.062
AUC, area of under the receiver operating characteristic curve; PP-RNFL, peripapillary retinal nerve fiber layer thickness; PP Aver, average PP-RNFL; MT, macular thickness; MT Aver, average MT; GC-IPL, ganglion cell-inner plexiform layer thickness; GC-IPL Aver, average GC-IPL; S, superior; N, nasal; I, inferior; T, temporal;
SN, superonasal; NS, nasosuperior; N, nasoinferior; IN, inferonasal; IT, inferotemporal; TI, temporoinferior; TS, temporosuperior; ST, superotemporal; Out S, outer superior; Out N, outer nasal; Out I, outer inferior; Out T, outer temporal; In S, inner superior; In N, inner nasal; In I, inner inferior; In T, inner temporal; TS, temporo- superior; NI, nasoinferior.
*Delong method was used for statistical analyses.
ral and inferotemporal directions, which were important area for glaucoma diagnosis, showed AUC values >0.7 or >0.8 in both OCT devices.
AUC values for macular thickness differed significantly be- tween OCT systems in four sectors (Tables 3 and 4). These in-
cluded the outer nasal sector in the control versus early glau- coma comparison (p=0.006), the inner temporal sector and outer temporal sectors in the control versus moderate to se- vere glaucoma comparison (p=0.015 and p=0.043, respective- ly), and the outer temporal sector in the early glaucoma versus
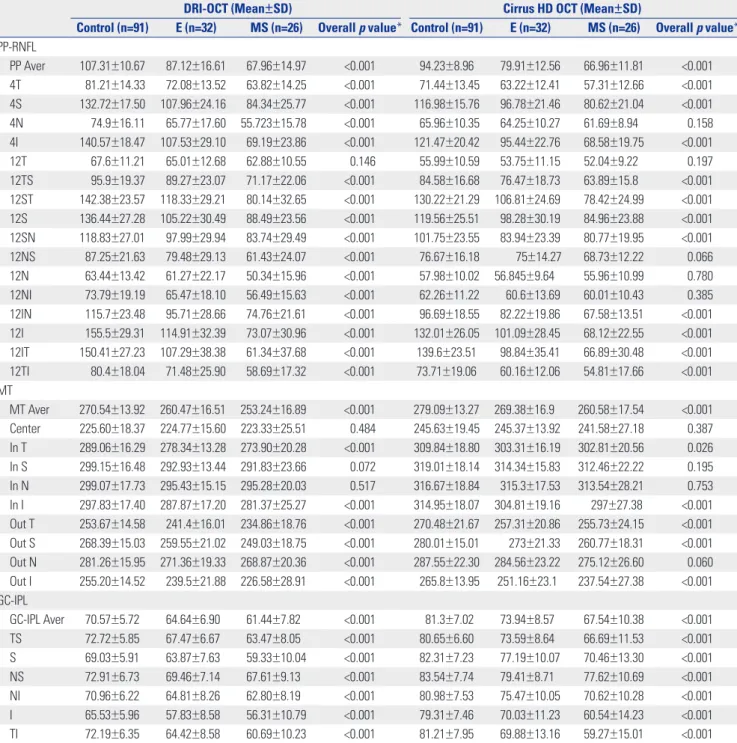
Fig. 2. Receiver operating characteristics curve of average peripapillary retinal nerve fiber layer thickness (A), macular thickness (B), and ganglion cell-inner plexiform layer thickness (C) measurements made with two opti- cal coherence tomography (OCT) modalities (DRI-OCT and Cirrus HD-OCT) between control and early glaucoma.
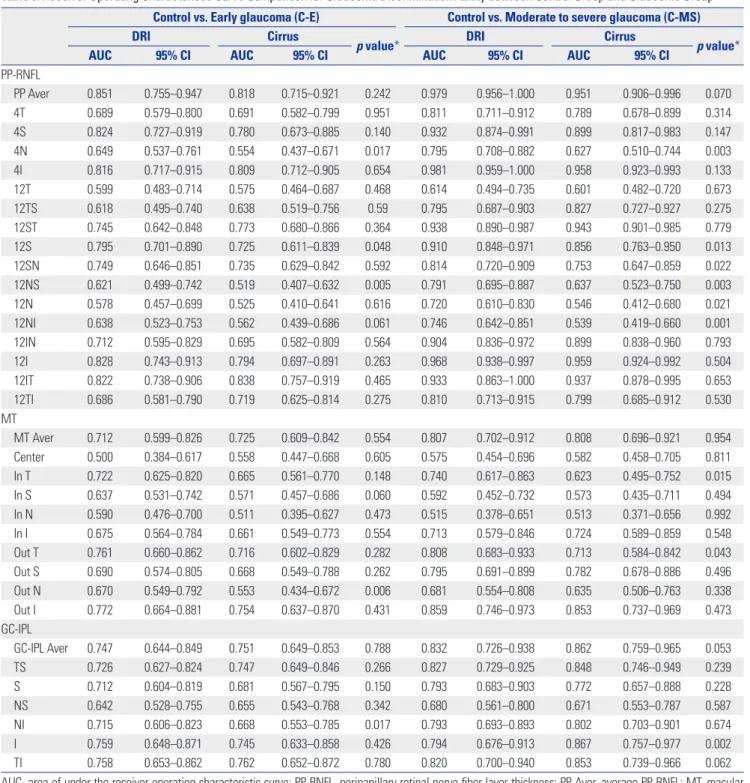
Fig. 3. Receiver operating characteristics curve of average peripapillary retinal nerve fiber layer thickness (A), macular thickness (B), and ganglion cell- inner plexiform layer thickness (C) measurements made with two optical coherence tomography (OCT) modalities (DRI-OCT and Cirrus HD-OCT) be- tween control and moderate to severe glaucoma.
1.0 0.8 0.6 0.4 0.2 0.0
Sensitivity
0.0 0.2 0.4 0.6 0.8 1.0 1-Specificity
C 1.0 0.8 0.6 0.4 0.2 0.0
Sensitivity
0.0 0.2 0.4 0.6 0.8 1.0 1-Specificity
B 1.0 0.8 0.6 0.4 0.2 0.0
Sensitivity
0.0 0.2 0.4 0 .6 0.8 1 .0 1-Specificity
A
DRI-OCT Cirrus HD-OCT
DRI-OCT Cirrus HD-OCT
DRI-OCT Cirrus HD-OCT
1.0 0.8 0.6 0.4 0.2 0.0
Sensitivity
0.0 0.2 0.4 0.6 0.8 1.0 1-Specificity
C 1.0 0.8 0.6 0.4 0.2 0.0
Sensitivity
0.0 0.2 0.4 0.6 0.8 1.0 1-Specificity
B 1.0 0.8 0.6 0.4 0.2 0.0
Sensitivity
0.0 0.2 0.4 0.6 0.8 1.0 1-Specificity
A
DRI-OCT Cirrus HD-OCT
DRI-OCT Cirrus HD-OCT
DRI-OCT Cirrus HD-OCT
moderate to severe glaucoma comparison (p=0.034) showing higher AUC in DRI-OCT than Cirrus HD-OCT.
Sector GC-IPL AUC measurements revealed four sectors with statistically significant differences between OCT modali- ties (Tables 3 and 4). The DRI-OCT AUC was significantly high-
er than the Cirrus HD-OCT AUC in the nasoinferior sector for the control versus early glaucoma comparison (p=0.017). How- ever, the Cirrus HD-OCT AUC was significantly higher than
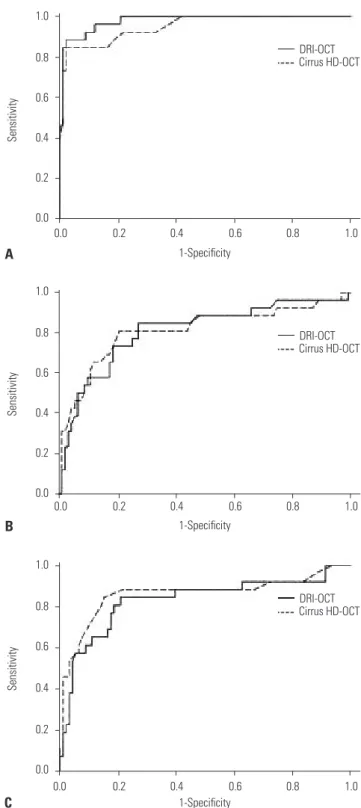
Fig. 4. Receiver operating characteristics curve of average peripapillary retinal nerve fiber layer thickness (A), macular thickness (B), and ganglion cell-inner plexiform layer thickness (C) measurements made with two opti- cal coherence tomography (OCT) modalities (DRI-OCT and Cirrus HD-OCT) between early and moderate to severe glaucoma.
1.0 0.8 0.6 0.4 0.2 0.0
Sensitivity
0.0 0.2 0.4 0.6 0.8 1.0 1-Specificity
C 1.0 0.8 0.6 0.4 0.2 0.0
Sensitivity
0.0 0.2 0.4 0.6 0.8 1.0 1-Specificity
B 1.0 0.8 0.6 0.4 0.2 0.0
Sensitivity
0.0 0.2 0.4 0.6 0.8 1.0 1-Specificity
A
DRI-OCT Cirrus HD-OCT
DRI-OCT Cirrus HD-OCT
DRI-OCT Cirrus HD-OCT
Table 4. Receiver Operating Characteristic Curve Comparison for Glau- coma Discrimination Ability between Early and Moderate to Severe Glau- coma
Early vs. moderate to severe glaucoma (E-MS)
DRI Cirrus
p value*
AUC 95% CI AUC 95% CI
PP-RNFL
PP Aver 0.810 0.696–0.925 0.792 0.669–0.915 0.634 4T 0.661 0.517–0.806 0.650 0.502–0.799 0.760 4S 0.748 0.614–0.881 0.721 0.584–0.858 0.351 4N 0.650 0.508–0.793 0.563 0.412–0.714 0.221 4I 0.862 0.764–0.960 0.831 0.722–0.939 0.269 12T 0.509 0.355–0.663 0.525 0.372–0.677 0.728 12TS 0.701 0.563–0.838 0.695 0.557–0.834 0.863 12ST 0.791 0.672–0.910 0.787 0.666–0.907 0.901 12S 0.668 0.523–0.809 0.646 0.501–0.791 0.584 12SN 0.622 0.473–0.773 0.503 0.349–0.657 0.005 12NS 0.666 0.526–0.806 0.621 0.475–0.770 0.357 12N 0.610 0.467–0.761 0.576 0.422–0.729 0.676 12NI 0.630 0.478–0.770 0.519 0.367–0.671 0.440 12IN 0.715 0.582–0.849 0.723 0.593–0.853 0.843 12I 0.826 0.718–0.930 0.823 0.716–0.929 0.920 12IT 0.814 0.691–0.937 0.770 0.639–0.901 0.195 12TI 0.688 0.546–0.831 0.686 0.537–0.834 0.939 MT
MT Aver 0.629 0.480–0.780 0.648 0.502–0.795 0.509 Center 0.569 0.418–0.719 0.527 0.373–0.681 0.362 In T 0.606 0.446–0.766 0.508 0.350–0.665 0.510 In S 0.498 0.337–0.658 0.516 0.357–0.675 0.511 In N 0.579 0.422–0.734 0.513 0.355–0.672 0.660 In I 0.603 0.448–0.750 0.626 0.470–0.782 0.349 Out T 0.676 0.527–0.824 0.556 0.400–0.712 0.034 Out S 0.633 0.486–0.781 0.654 0.507–0.801 0.417 Out N 0.525 0.371–0.679 0.578 0.424–0.732 0.318 Out I 0.696 0.553–0.837 0.696 0.552–0.839 1.000 GC-IPL
GC-IPL Aver 0.637 0.489–0.785 0.688 0.544–0.832 0.071 TS 0.663 0.516–0.810 0.693 0.549–0.837 0.294 S 0.634 0.485–0.784 0.632 0.482–0.782 0.914 NS 0.545 0.392–0.699 0.518 0.363–0.672 0.204 NI 0.563 0.413–0.713 0.626 0.480–0.773 0.024 I 0.537 0.384–0.689 0.716 0.578–0.855 0.001 TI 0.613 0.461–0.765 0.705 0.561–0.849 0.002 AUC, area of under the receiver operating characteristic curve; PP-RNFL, peripapillary retinal nerve fiber layer thickness; PP Aver, average PP-RNFL;
MT, macular thickness; MT Aver, average MT; GC-IPL, ganglion cell-inner plexiform layer thickness; GC-IPL Aver, average GC-IPL; S, superior; N, nasal;
I, inferior; T, temporal; SN, superonasal; NS, nasosuperior; N, nasoinferior;
IN, inferonasal; IT, inferotemporal; TI, temporoinferior; TS, temporosuperior;
ST, superotemporal; Out S, outer superior; Out N, outer nasal; Out I, outer in- ferior; Out T, outer temporal; In S, inner superior; In N, inner nasal; In I, inner inferior; In T, inner temporal; TS, temporosuperior; NI, nasoinferior.
*Delong method was used for statistical analyses.
the DRI-OCT AUC in the inferior sector for the control versus moderate to severe glaucoma comparison (p=0.002) and in the nasoinferior, inferior, and temporoinferior sectors for the early glaucoma versus moderate to severe glaucoma compari- son (p=0.024, p=0.001, and p=0.002, respectively).
DISCUSSION
In a previous study,7 we assessed the repeatability and agree- ment of measurement results between DRI-OCT and Cirrus HD-OCT in normal eyes. According to the previous study, each OCT system showed different thickness values in the same measurement sector. PP-RNFL thickness obtained by DRI-OCT was larger than that obtained by Cirrus HD-OCT.
However, GC-IPL thickness as measured by Cirrus HD-OCT was larger than that measured by DRI-OCT. These two OCT systems showed excellent repeatability in all measurement areas for normal subjects. Although the present study mea- sured thickness for glaucoma patients, we expected that the repeatability of measurements for each OCT system would be maintained. In addition, as we discussed in the aforemen- tioned study,7 differences in thickness values between two OCT systems within same subjects might be attributed to differ- ences in segmentation algorithm, measurement diameter, or light source. Even though there were differences between the thicknesses measured using the two OCT systems, their abili- ties to discriminate between normal and glaucomatous eyes using PP-RNFL, total macular, and GC-IPL thickness sector measurements were similar between two OCT devices in the present study. These results corroborate the results of recent studies showing similar abilities of DRI-OCT and spectral-do- main-OCT to detect glaucomatous damage.8-11 However, un- like a previous study,8 we used 3D optic disc scanning of DRI- OCT for the measurement of PP-RNFL thickness. The wide scan mode of DRI-OCT, another scanning protocol used in previous studies, includes the area from the optic disc to the macula. Therefore, PP-RNFL thickness can be measured using the wide scan mode, and the measurements obtained are similar to those obtained using Cirrus HD-OCT optic disc scan.8 However, they showed different thickness values from those obtained using the 3D optic disc scan in DRI-OCT.9 In addition, regarding the shape of the scan area, 3D optic disc scan is more similar to the Cirrus HD-OCT than it is to the wide scan. Therefore, it is more reasonable to compare the PP- RNFL thicknesses obtained using the 3D optic disc scan in DRI-OCT and that in Cirrus HD-OCT. Another novel feature of our study was that we investigated sectoral PP-RNFL thick- ness not only in the 4 clock-hour sector but also in the 12 clock- hour sector. According to our data, average, superior, and infe- rior sectors of the peripapillary area showed high glaucoma diagnosis ability in both OCT modalities regardless of glauco- ma severity. A thick RNFL bundle of vertical sectors explains
the easier detection of RNFL change in the superior and inferi- or sectors.15 This result is in line with those of previous studies that used time-domain OCT and/or spectral-domain OCT.15-18 The macular area is another critical location for the diagnosis or follow-up of glaucoma because it is relatively free from con- founding factors that can affect interpretation of the results, such as peripapillary atrophy, alignment of the measurement circle around the optic disc, and variable retinal vasculature.19 The usefulness of full retinal thickness of the macular area for glaucoma detection has been shown in previous studies.20-22 In addition, considering the importance of inner retinal layers in glaucomatous damage, it is thought that change in GC-IPL thickness is more related with glaucomatous damage.15,23,24 In the present study, we could verify that both full macular thick- ness and GC-IPL thickness show good diagnostic ability for glaucoma. In particular, the high discriminative ability in the outer sectors for full macular thickness is consistent with the results obtained in previous studies.22,25 Inner sectors of macu- lar area are related with papillomacular fibers. Because these fi- bers get damaged later, the outer sectors are affected by glauco- matous change of the superior or inferior arcuate fibers in the early stage of glaucoma.
Our study results reflect the spatial distribution of nerve fi- bers. Hood, et al.26-28 investigated the correspondence between functional and anatomical findings in the macula and peri- papillary area using OCT and visual field test. They found that optic disc location affected how these corresponded.27 Because the optic disc is located above the horizontal line that passes through the foveal center, inferior macular ganglion cells proj- ect to the inferotemporal and inferior optic disc margins. How- ever, superior and nasal macular ganglion cells project to the temporal optic disc margin. This positional relationship was also identified in our study. Macular sectors with high discrim- inative abilities with both OCT systems were spatially well- matched with peripapillary sectors.
As in previous studies, discriminative ability was associated with glaucoma severity.1,29,30 Among the three comparisons made in our study, the control versus moderate to severe glau- coma comparison had the largest AUC values in almost all peripapillary and macular measurement sectors examined.
The control versus early glaucoma comparison tended to have higher AUC values than the early glaucoma versus moderate to severe glaucoma comparison, although this difference was not remarkable. Nouri-Mahdavi, et al.30 investigated how well GC-IPL measurements can detect early glaucoma relative to RNFL measurements in the Cirrus HD-OCT. They showed that GC-IPL measurements have comparable glaucoma de- tection abilities to those found for PP-RNFL. Additionally, it was verified that inferior sectors within the PP-RNFL and GC- IPL measurement areas had the best glaucoma detection abilities. Our study also showed that inferior sector PP-RNFL and GC-IPL measurements are effective in distinguishing glaucomatous eyes from normal eyes. Interestingly, there were
significant differences in inferior sectors for GC-IPL (inferior sector in control versus moderate to severe glaucoma and na- soinferior, inferior, and temporoinferior in early glaucoma ver- sus moderate to severe glaucoma comparisons), where Cirrus HD-OCT AUC values were high. Further research is required to determine the clinical significance of our results. Our study had several limitations. A larger group of glaucomatous eyes would have allowed us to have more subgroups based on glau- coma severity. Additionally, prospective longitudinal studies should be conducted to examine how OCT systems can be used to detect glaucoma progression.
In conclusion, both OCT systems had similar abilities to discriminate between normal and glaucomatous eyes in criti- cal thickness measurement sectors for glaucoma diagnosis for the adult Korean population, even though the 3D optic disc scan of DRI-OCT was used to measure PP-RNFL thickness. Togeth- er with the results of previous studies performed on other eth- nic groups, our results verify the usefulness of DRI-OCT in di- agnosis of glaucoma in comparison with Cirrus HD-OCT.
ACKNOWLEDGEMENTS
The authors are grateful to Hye Sun Lee (Department of Re- search Affairs, Biostatistics Collaboration Unit, Yonsei Univer- sity College of Medicine, Seoul, Korea) for her help with the sta- tistical analyses.
ORCID
Chan Yun Kim https://orcid.org/0000-0002-8373-9999
REFERENCES
1. Bussel II, Wollstein G, Schuman JS. OCT for glaucoma diagnosis, screening and detection of glaucoma progression. Br J Ophthal- mol 2014;98 Suppl 2:ii15-9.
2. Leung CK. Diagnosing glaucoma progression with optical coher- ence tomography. Curr Opin Ophthalmol 2014;25:104-11.
3. Bae HW, Lee SY, Kim S, Park CK, Lee K, Kim CY, et al. Asymmetry of peak thicknesses between the superior and inferior retinal nerve fiber layers for early glaucoma detection: a simple screening method. Yonsei Med J 2018;59:135-40.
4. Gabriele ML, Wollstein G, Ishikawa H, Kagemann L, Xu J, Folio LS, et al. Optical coherence tomography: history, current status, and laboratory work. Invest Ophthalmol Vis Sci 2011;52:2425-36.
5. Mrejen S, Spaide RF. Optical coherence tomography: imaging of the choroid and beyond. Surv Ophthalmol 2013;58:387-429.
6. Lee SY, Kwon HJ, Bae HW, Seo SJ, Lee YH, Hong S, et al. Frequen- cy, type and cause of artifacts in swept-source and cirrus HD opti- cal coherence tomography in cases of glaucoma and suspected glaucoma. Curr Eye Res 2016;41:957-64.
7. Lee SY, Bae HW, Kwon HJ, Seong GJ, Kim CY. Repeatability and agreement of swept source and spectral domain optical coher- ence tomography evaluations of thickness sectors in normal eyes.
J Glaucoma 2017;26:e46-53.
8. Yang Z, Tatham AJ, Weinreb RN, Medeiros FA, Liu T, Zangwill LM.
Diagnostic ability of macular ganglion cell inner plexiform layer
measurements in glaucoma using swept source and spectral do- main optical coherence tomography. PLoS One 2015;10:e0125957.
9. Yang Z, Tatham AJ, Zangwill LM, Weinreb RN, Zhang C, Medeiros FA. Diagnostic ability of retinal nerve fiber layer imaging by swept- source optical coherence tomography in glaucoma. Am J Oph- thalmol 2015;159:193-201.
10. Ha A, Lee SH, Lee EJ, Kim TW. Retinal nerve fiber layer thickness measurement comparison using spectral domain and swept source pptical coherence tomography. Korean J Ophthalmol 2016;30:
140-7.
11. Lee KM, Lee EJ, Kim TW, Kim H. Comparison of the abilities of SD- OCT and SS-OCT in evaluating the thickness of the macular inner retinal layer for glaucoma diagnosis. PLoS One 2016;11:e0147964.
12. Chylack LT Jr, Wolfe JK, Singer DM, Leske MC, Bullimore MA, Bai- ley IL, et al. The lens opacities classification system III. The longi- tudinal study of cataract study group. Arch Ophthalmol 1993;111:
831-6.
13. Budenz DL, Rhee P, Feuer WJ, McSoley J, Johnson CA, Anderson DR. Comparison of glaucomatous visual field defects using stan- dard full threshold and Swedish interactive threshold algorithms.
Arch Ophthalmol 2002;120:1136-41.
14. DeLong ER, DeLong DM, Clarke-Pearson DL. Comparing the ar- eas under two or more correlated receiver operating characteris- tic curves: a nonparametric approach. Biometrics 1988;44:837-45.
15. Mwanza JC, Durbin MK, Budenz DL, Sayyad FE, Chang RT, Neelakantan A, et al. Glaucoma diagnostic accuracy of ganglion cell-inner plexiform layer thickness: comparison with nerve fiber layer and optic nerve head. Ophthalmology 2012;119:1151-8.
16. Medeiros FA, Zangwill LM, Bowd C, Vessani RM, Susanna R Jr, Weinreb RN. Evaluation of retinal nerve fiber layer, optic nerve head, and macular thickness measurements for glaucoma detec- tion using optical coherence tomography. Am J Ophthalmol 2005;
139:44-55.
17. Wollstein G, Schuman JS, Price LL, Aydin A, Stark PC, Hertzmark E, et al. Optical coherence tomography longitudinal evaluation of retinal nerve fiber layer thickness in glaucoma. Arch Ophthalmol 2005;123:464-70.
18. Mwanza JC, Oakley JD, Budenz DL, Anderson DR; Cirrus Optical Coherence Tomography Normative Database Study Group. Ability of cirrus HD-OCT optic nerve head parameters to discriminate normal from glaucomatous eyes. Ophthalmology 2011;118:241-8.
e1.
19. Harwerth RS, Wheat JL, Fredette MJ, Anderson DR. Linking struc- ture and function in glaucoma. Prog Retin Eye Res 2010;29:249-71.
20. Leung CK, Chan WM, Yung WH, Ng AC, Woo J, Tsang MK, et al.
Comparison of macular and peripapillary measurements for the detection of glaucoma: an optical coherence tomography study.
Ophthalmology 2005;112:391-400.
21. Ojima T, Tanabe T, Hangai M, Yu S, Morishita S, Yoshimura N.
Measurement of retinal nerve fiber layer thickness and macular volume for glaucoma detection using optical coherence tomogra- phy. Jpn J Ophthalmol 2007;51:197-203.
22. Nakatani Y, Higashide T, Ohkubo S, Takeda H, Sugiyama K. Evalu- ation of macular thickness and peripapillary retinal nerve fiber layer thickness for detection of early glaucoma using spectral do- main optical coherence tomography. J Glaucoma 2011;20:252-9.
23. Wang M, Hood DC, Cho JS, Ghadiali Q, De Moraes CG, Zhang X, et al. Measurement of local retinal ganglion cell layer thickness in patients with glaucoma using frequency-domain optical coher- ence tomography. Arch Ophthalmol 2009;127:875-81.
24. Lee JW, Morales E, Sharifipour F, Amini N, Yu F, Afifi AA, et al. The relationship between central visual field sensitivity and macular ganglion cell/inner plexiform layer thickness in glaucoma. Br J
Ophthalmol 2017;101:1052-8.
25. Nakano N, Hangai M, Nakanishi H, Mori S, Nukada M, Kotera Y, et al. Macular ganglion cell layer imaging in preperimetric glaucoma with speckle noise-reduced spectral domain optical coherence to- mography. Ophthalmology 2011;118:2414-26.
26. Hood DC, Anderson SC, Wall M, Raza AS, Kardon RH. A test of a linear model of glaucomatous structure-function loss reveals sources of variability in retinal nerve fiber and visual field measure- ments. Invest Ophthalmol Vis Sci 2009;50:4254-66.
27. Hood DC, Raza AS, de Moraes CG, Liebmann JM, Ritch R. Glauco- matous damage of the macula. Prog Retin Eye Res 2013;32:1-21.
28. Hood DC, Wang DL, Raza AS, de Moraes CG, Liebmann JM, Ritch
R. The locations of circumpapillary glaucomatous defects seen on frequency-domain OCT scans. Invest Ophthalmol Vis Sci 2013;54:
7338-43.
29. Elbendary AM, Mohamed Helal R. Discriminating ability of spec- tral domain optical coherence tomography in different stages of glaucoma. Saudi J Ophthalmol 2013;27:19-24.
30. Nouri-Mahdavi K, Nowroozizadeh S, Nassiri N, Cirineo N, Knip- ping S, Giaconi J, et al. Macular ganglion cell/inner plexiform layer measurements by spectral domain optical coherence tomography for detection of early glaucoma and comparison to retinal nerve fiber layer measurements. Am J Ophthalmol 2013;156:1297-307.e2.