Introduction
Glaucoma is a progressive glaucomatous optic neuropathy with a glaucomatous visual field defect.1-3 Various condi- tions, such as myopia, are considered risk factors for glau- coma.4-6 It has been postulated that the optic nerve head in a myopic eye is weaker because of the structural changes in the connective tissue.7,8 In addition, it is difficult to identify glaucomatous optic disc changes in myopic eyes because of the physiologically large cup, tilting of the disc and peripap-
illary atrophy (PPA).9-11 PPA is observed in eyes with my- opia as well as glaucoma. The retina and choroid become thin in the PPA, exposing some of the underlying sclera.12,13 The retinal pigment epithelium is absent or irregular in cho- rioscleral crescent or PPA.12,13
Various methods have been introduced for measuring retinal nerve fiber layer (RNFL) thickness. Among them, optical coherence tomography (OCT), scanning laser pola- rimetry (GDx) with variable corneal compensation (VCC) and enhanced corneal compensation (ECC) are commonly used.14-20 It is possible that PPA can influence the meas- urement of RNFL thickness by GDx because abnormal birefringence can occur due to diminution of reflectivity from the retinal pigment epithelium, which can produce an augmentation of the polarization signal from deeper retinal structures such as the sclera.21 Likewise, it may also be possible that PPA can influence the measurement of RNFL
Measurement of Retinal Nerve Fiber Layer Thickness by Optical Coherence Tomography and Scanning Laser Polarimetry in Myopic Eyes with Peripapillary Atrophy
Young Hoon Hwang, MD1, Yong Yeon Kim, MD, PhD2
1Department of Ophthalmology, Konyang University, Kim’s Eye Hospital, Myung-Gok Eye Research Institute, Seoul, Korea
2Department of Ophthalmology, Korea University College of Medicine, Seoul, Korea
Purpose: To determine how myopia and peripapillary atrophy (PPA) affect the measurement of retinal nerve fiber layer (RNFL) thickness by optical coherence tomography (OCT) and scanning laser polarimetry (GDx) with variable and enhanced corneal compensation (VCC and ECC).
Methods: We measured RNFL thickness in 20 eyes from 20 subjects without glaucoma and with myopic PPA (PPA group) and 20 eyes from 20 normal subjects without PPA (control group) with various scan circle sizes by OCT, GDx-VCC and GDx-ECC.
Results: On OCT analysis, the individual clock-hour RNFL thickness of the PPA group was significantly less than that of the control group in the nasal, superior and inferior areas, whereas the thickness was similar in the temporal area where PPA was most commonly seen. On GDx-VCC and GDx-ECC analyses, the individual clock-hour RNFL thickness of the PPA group was similar or less in the nasal, superior and inferior areas than that of the control group, whereas the thickness was greater in the PPA group than in the control group in the temporal area. This RNFL thickness pattern seen with both OCT and GDx measurement was consistent for all the scan circle sizes even though the scan circle was large enough that it did not encompass the PPA area.
Conclusions: When measured by OCT and GDx, the thickening of the RNFL in the temporal area was observed in the PPA group. Our results suggest that PPA per se may not be responsible for the temporal thickening of RNFL in myopic eyes with PPA.
Key words: Glaucoma; Myopia; Optical coherence tomography; Retinal nerve fiber layer
Received: 2015. 9. 11. Revised: 2015. 10. 15.
Accepted: 2015. 11. 5.
Corresponding Author: Yong Yeon Kim, MD, PhD
Department of Ophthalmology, Korea University Guro Hospital, 148 Gurodong-ro, Guro-gu, Seoul 08308, Korea
Tel: +82-2-2626-1260, Fax: +82-2-857-8580 E-mail: [email protected]
thickness by OCT because the accuracy of the bottom of the nerve fiber layer of the NFL is arbitrarily defined as a change in the refractive index in the retinal tissue, 22,23 and the presence of PPA can change the reflection of lights.
Measuring RNFL thickness in myopic eyes by GDx has been reported in various studies, which showed abnormal retardation patterns of RNFL on areas with PPA.24,25 How- ever, there is a paucity of reports on the clinical results from using OCT to measure RNFL thickness in eyes with myop- ic PPA.
This study was performed to investigate the influence of myopic PPA on the measurement of RNFL thickness by OCT, GDx-VCC and GDx-ECC. We measured RNFL thickness with various scan circle sizes including a large scan circle that did not include the PPA area. We postulated that if a change in RNFL thickness is still found in the large scan circle not including the PPA area, PPA itself does not affect the RNFL thickness measurement.
Patients and Methods
In July 2008, we analyzed 20 eyes from 20 enrolled sub- jects without PPA (control group) and 20 eyes from 20 en- rolled subjects with myopic PPA (PPA group). The subjects included hospital staff from the Korea University Guro Hospital and students of the Korea University Medical College. We selected one eye at random from each subject for the analysis. The Institutional Review Board of Korea University Guro Hospital approved our protocol and all pro- cedures adhered to the tenets of the Declaration of Helsinki.
All investigations were performed with informed consent.
All subjects underwent comprehensive ophthalmic exam- inations, including refraction, intraocular pressure (IOP) measurement by Goldmann applanation tonometer, slit- lamp biomicroscopy and funduscopic examination. PPA was defined as chorioretinal atrophy with visible large cho- roidal vessels and sclera around the optic disc.Visual fields were tested by the Humphrey Field Analyzer (Zeiss-Hum- phrey Systemis, Dublin, CA) using a 30-2 Swedish In- teractive Threshold Algorithm. Inclusion criteria were as follows: best corrected visual acuity greater than 20/25, IOP
less than 21 mmHg, no visual field defects, no ocular abnor- malities except for myopia and no systemic diseases includ- ing diabetes and hypertension. We excluded eyes with glau- comatous optic disc changes, visual field abnormalities and retinal diseases including myopic macular degeneration.
OCT measurement was performed by a well-trained ex- aminer with the optic nerve head scan mode of the Stratus OCT 3000 (Carl Zeiss Meditec, Dublin, CA, USA). RNFL thickness around the optic disc was measured for each eye with four different scan circle sizes (3.2, 3.4, 3.6 and 4.0 mm). We included results that had a centered optic disc, were well focused and had a signal strength equal to or greater than 8. GDx-VCC and GDx-ECC (Carl Zeiss Med- itec, Dublin, CA, USA, version 5.5.1) measurements were also performed by the same examiner without pupil dila- tion. Again, we only included images that had a centered optic disc, were well-focused and had a quality score of 8 or more. Each obtained image was analyzed with three dif- ferent scan circle sizes (small, 2.4 mm; medium, 3.2 mm;
and large, 4.0 mm in inner diameter). To analyze individual clock-hour RNFL thickness, raw data for all the eyes were extracted from the GDx device. The horizontal and vertical diameters of the optic discs were obtained from the GDx- ECC measurements.
We analyzed the differences between the two groups in average RNFL thickness and RNFL thickness at each clock hour area as measured by OCT, GDx-VCC and GDx-ECC.
All differences in the parameters between the two groups were analyzed by t test. To analyze the correlation between spherical equivalent (SE) and RNFL thickness, we calculat- ed Pearson’s correlation coefficient. A p value less than 0.05 was considered significant.
Results
The mean ages of the control and PPA groups were 27.00
± 4.52 (SD) and 27.20 ± 5.13 years old, respectively. The mean SEs of the control and PPA groups were -2.15 ± 2.23, and -5.90 ± 3.33 diopter, respectively. The mean IOPs of the control and PPA groups were 14.88 ± 2.96 and 15.31 ± 2.80 mmHg, respectively, and the horizontal and vertical
optic disc diameter were 1358.00 ± 283.06 and 1606.11 ± 215.18 μm, respectively, for the control group, and 1446.08
± 277.42 and 1682.15 ± 246.65 μm, respectively, for the PPA group. Age, IOP and optic disc diameters were not signif- icantly different between the two groups (p > 0.05). The eyes of the PPA group were more myopic than those of the control group (p = 0.000) (Table 1).
When identifying the temporal outermost area as 9 o’clock and nasal innermost area as 3 o’clock, the distribution of PPA in the PPA group was as follows: PPA of six eyes (30%) presented between 7 and 11 o’clock, PPA of four eyes (20%) between 7 and 12 o’clock, PPA of three eyes (15%) between 6 and 11 o’clock, PPA of five eyes (25%) between 6 and 12 o’clock, and PPA of two eyes (10%) between 5 and
12 o’clock. Thus, all the eyes (100%) in the PPA group had a PPA between 7 and 11 o’clock (temporal area), 11 eyes (55%) had PPA at 12 o’clock, eight eyes (40%) had PPA at 6 o’clock, and two eyes (10%) had PPA at 5 o’clock.
The relationship between the scan circle size and the dis- tance between the outermost margin of the PPA and the optic disc margin was as follows: the 2.4 mm (small) scan circle was across the PPA area in 17 eyes (85%), the 3.2 mm (medium) scan circle was across the PPA area in 12 eyes (60%), the 3.4 mm scan circle was across the PPA area in nine eyes (45%), the 3.6 mm scan circle was across the PPA area in three eyes (15%), and the 4.0 mm (large) scan circle was across the PPA area in no eyes (0%).
On OCT analysis, the average RNFL thickness of the
Table 1. Demographic data and optic disc parameters of the control group and the peripapillary atrophy (PPA) group (mean ± standard deviation)
Control Group (n=20) PPA Group (n=20) p-value*
Age (years) 27.15 ± 4.50 27.35 ± 5.07 0.894
Spherical equivalent (diopters) -1.90 ± 2.18 (-5.88 to +1.75)
-6.04 ± 3.19 (-15.25 to -2.13)
< 0.001
Intraocular pressure (mmHg) 14.45 ± 2.62 15.28 ± 2.87 0.445
Disc diameter (μm)
Horizontal 1358.00 ± 283.06 1446.08 ± 277.42 0.258
Vertical 1606.11 ± 215.18 1682.15 ± 246.65 0.237
*p-value: t-test.
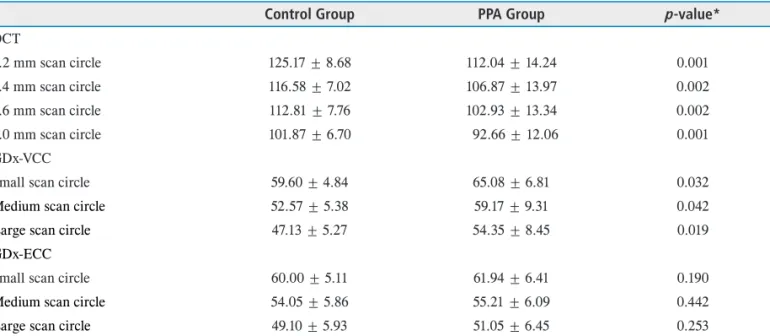
Table 2. Average retinal nerve fiber layer thickness measured by OCT, GDx-VCC and GDx-ECC (mean ± standard deviation, μm)
Control Group PPA Group p-value*
OCT
3.2 mm scan circle 125.17 ± 8.68 112.04 ± 14.24 0.001
3.4 mm scan circle 116.58 ± 7.02 106.87 ± 13.97 0.002
3.6 mm scan circle 112.81 ± 7.76 102.93 ± 13.34 0.002
4.0 mm scan circle 101.87 ± 6.70 92.66 ± 12.06 0.001
GDx-VCC
Small scan circle 59.60 ± 4.84 65.08 ± 6.81 0.032
Medium scan circle 52.57 ± 5.38 59.17 ± 9.31 0.042
Large scan circle 47.13 ± 5.27 54.35 ± 8.45 0.019
GDx-ECC
Small scan circle 60.00 ± 5.11 61.94 ± 6.41 0.190
Medium scan circle 54.05 ± 5.86 55.21 ± 6.09 0.442
Large scan circle 49.10 ± 5.93 51.05 ± 6.45 0.253
PPA = peripapillary atrophy.
*p-value: t-test.
control group was greater than that of the PPA group for all four different scan circle sizes (Table 2). The average RNFL thickness measured by OCT was significantly correlated with the SE for all subjects, showing that the RNFL thick- ness decreased as the degree of myopia increased (Table 3).
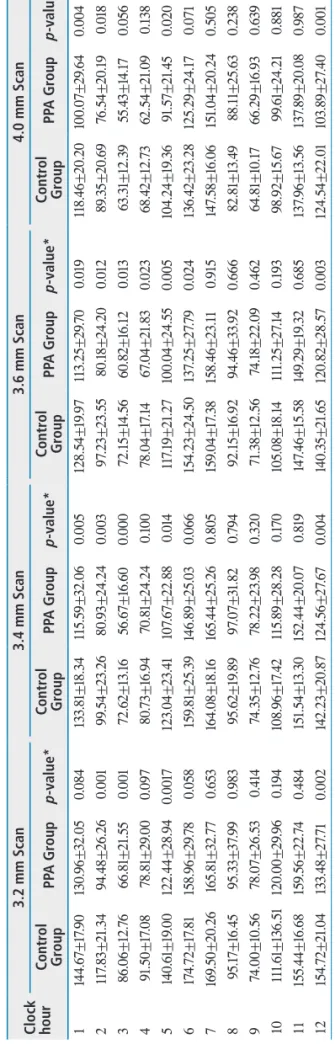
The RNFL thicknesses in the clock hour areas without PPA in the PPA group were significantly lower than those in the corresponding clock hour areas in the control group (p <
0.05). However, RNFL thicknesses in the clock hour areas with PPA (7 to 11 o’clock hour areas) showed no significant differences between the two groups (P>0.05). This pattern of RNFL thickness differences between the two groups was consistent for all the four different scan circle sizes (Table 4, Fig. 1).
On GDx analysis, the average RNFL thickness obtained by GDx-VCC in the PPA group was significantly greater than that of the control group (p < 0.05). However, the av- erage RNFL thickness obtained by GDx-ECC showed no significant difference between the two groups (p > 0.05) (Table 2). When comparing RNFL thickness measured by GDx-VCC and GDx-ECC between the PPA and control groups at each clock hour area, the RNFL thickness in ar- eas with PPA (temporal area) was greater in the PPA group Table 3. Correlation between spherical equivalent and average retinal nerve fiber layer thickness measured by OCT, GDx-VCC and GDx-ECC
Correlation coefficient (p-value*) OCT
3.2 mm scan circle 0.743 (0.000) 3.4 mm scan circle 0.648 (0.000) 3.6 mm scan circle 0.629 (0.000) 4.0 mm scan circle 0.680 (0.000) GDx-VCC
Small scan circle -0.275 (0.094) Medium scan circle -0.262 (0.107) Large scan circle -0.494 (0.004) GDx-ECC
Small scan circle 0.105 (0.401)
Medium scan circle 0.141 (0.259)
Large scan circle 0.072 (0.606)
*p-value: Pearson’s correlation.
Table 4. Comparison of clock-hour sector retinal nerve fiber layer thicknesses between the two groups measured by OCT with various scan circle sizes (mean±standard deviation, μm).
Clock hour
3.2 mm Scan3.4 mm Scan3.6 mm Scan4.0 mm Scan Control GroupPPA Groupp-value*Control GroupPPA Groupp-value*Control GroupPPA Groupp-value*Control GroupPPA Groupp-value* 1144.67±17.90130.96±32.050.084133.81±18.34115.59±32.060.005128.54±19.97113.25±29.700.019118.46±20.20100.07±29.640.004 2117.83±21.3494.48±26.260.00199.54±23.2680.93±24.240.00397.23±23.5580.18±24.200.01289.35±20.6976.54±20.190.018 386.06±12.7666.81±21.550.00172.62±13.1656.67±16.600.00072.15±14.5660.82±16.120.01363.31±12.3955.43±14.170.056 491.50±17.0878.81±29.000.09780.73±16.9470.81±24.240.10078.04±17.1467.04±21.830.02368.42±12.7362.54±21.090.138 5140.61±19.00122.44±28.940.0017123.04±23.41107.67±22.880.014117.19±21.27100.04±24.550.005104.24±19.3691.57±21.450.020 6174.72±17.81158.96±29.780.058159.81±25.39146.89±25.030.066154.23±24.50137.25±27.790.024136.42±23.28125.29±24.170.071 7169.50±20.26165.81±32.770.653164.08±18.16165.44±25.260.805159.04±17.38158.46±23.110.915147.58±16.06151.04±20.240.505 895.17±16.4595.33±37.990.98395.62±19.8997.07±31.820.79492.15±16.9294.46±33.920.66682.81±13.4988.11±25.630.238 974.00±10.5678.07±26.530.41474.35±12.7678.22±23.980.32071.38±12.5674.18±22.090.46264.81±10.1766.29±16.930.639 10111.61±136.51120.00±29.960.194108.96±17.42115.89±28.280.170105.08±18.14111.25±27.140.19398.92±15.6799.61±24.210.881 11155.44±16.68159.56±22.740.484151.54±13.30152.44±20.070.819147.46±15.58149.29±19.320.685137.96±13.56137.89±20.080.987 12154.72±21.04133.48±27.710.002142.23±20.87124.56±27.670.004140.35±21.65120.82±28.570.003124.54±22.01103.89±27.400.001 PPA = peripapillary atrophy. *p-value:t-test.
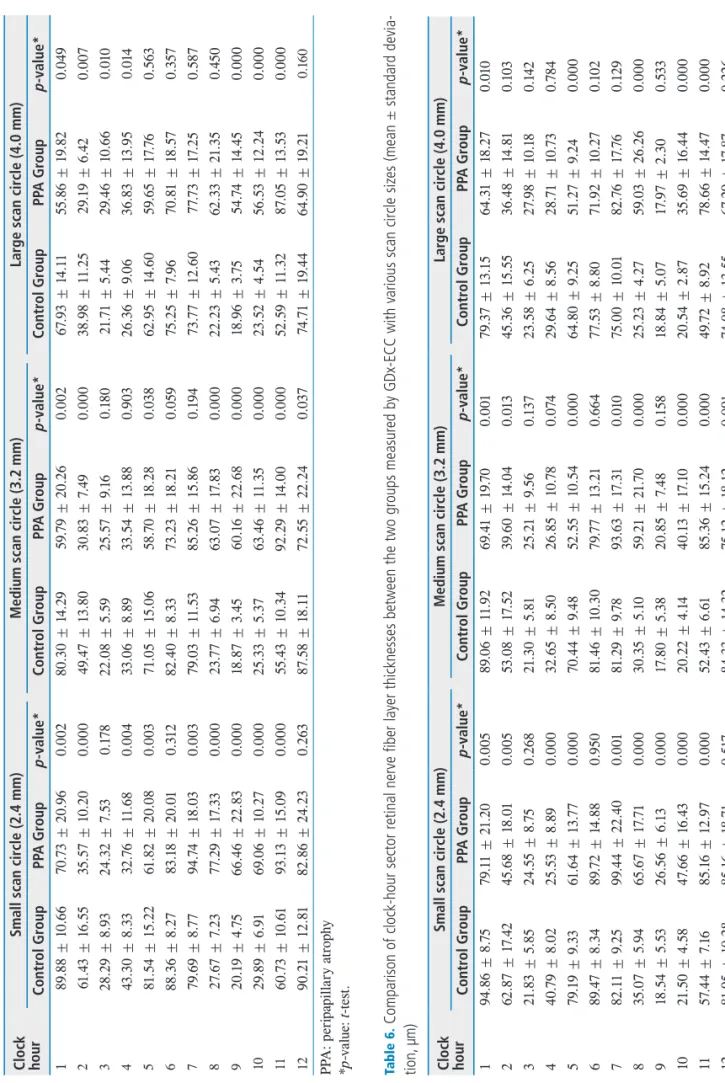
(p < 0.05) than in the control group. However, in areas without PPA (nasal, superior, and inferior areas), the RNFL thickness showed no difference or was less in the PPA group. The pattern of RNFL thickness differences between the two groups was consistent for all three of the different scan circle sizes (Table 5, 6, Fig. 2). The average RNFL thicknesses measured by GDx-VCC and GDx-ECC were not correlated with SE for overall subjects, except for the RNFL thickness measured by the large scan circle of GDx- VCC, which showed a negative correlation between the SE and average RNFL thickness (Table 3).
Discussion
An OCT study previously showed that RNFL thickness was less in highly myopic eyes than in eyes with lower myopia, and there was a linear correlation between RNFL thickness and axial length/spherical equivalent.26 Other
studies have also shown similar correlations between my- opia and RNFL thickness measured by OCT. 27-29 A similar difference in RNFL thickness according to the degree of myopia was also found in our own study using OCT. In ad- dition, the RNFL thicknesses at each clock hour measured by OCT with various scan circle sizes were thinner in the PPA group than in the control group, except for the tempo- ral area where PPA most commonly exists. The pattern of RNFL thickness seen in OCT measurement was consistent for all scan circles of various sizes even though the scan cir- cle was large enough that it did not include the PPA.
We found that average RNFL thickness of the PPA group measured by GDx-VCC was higher than that of the control group, although the PPA group had a higher degree of myo- pia. On the other hand, when analyzing RNFL thickness at each clock hour area, the RNFL thickness of the PPA group was greater in areas with PPA than that of the control group, whereas in areas without PPA, the RNFL thickness of the Figure 1. Retinal nerve fiber layer (RNFL) thickness curves for control and peripapillary (PPA) groups obtained by optical coherence to- mography with various scan circle sizes. The RNFL thickness of the PPA group was less than that of the control group except for in the temporal area. In the temporal area, no differences in RNFL thickness were found between the two groups.
Table 5. Comparison of clock-hour sector retinal nerve fiber layer thicknesses between the two groups measured by GDx-VCC with various scan circle sizes (mean ± standard deviation, μm).
Clock hour
Small scan circle (2.4 mm)Medium scan circle (3.2 mm) Large scan circle (4.0 mm) Control GroupPPA Groupp-value*Control GroupPPA Groupp-value*Control GroupPPA Groupp-value* 189.88 ± 10.6670.73 ± 20.960.00280.30 ± 14.2959.79 ± 20.260.00267.93 ± 14.1155.86 ± 19.820.049 261.43 ± 16.5535.57 ± 10.200.00049.47 ± 13.8030.83 ± 7.490.00038.98 ± 11.2529.19 ± 6.420.007 328.29 ± 8.9324.32 ± 7.530.17822.08 ± 5.5925.57 ± 9.160.18021.71 ± 5.4429.46 ± 10.660.010 443.30 ± 8.3332.76 ± 11.680.00433.06 ± 8.8933.54 ± 13.880.90326.36 ± 9.0636.83 ± 13.950.014 581.54 ± 15.2261.82 ± 20.080.00371.05 ± 15.0658.70 ± 18.280.03862.95 ± 14.6059.65 ± 17.760.563 688.36 ± 8.2783.18 ± 20.010.31282.40 ± 8.3373.23 ± 18.210.05975.25 ± 7.9670.81 ± 18.570.357 779.69 ± 8.7794.74 ± 18.030.00379.03 ± 11.5385.26 ± 15.860.19473.77 ± 12.6077.73 ± 17.250.587 827.67 ± 7.2377.29 ± 17.330.00023.77 ± 6.9463.07 ± 17.830.00022.23 ± 5.4362.33 ± 21.350.450 920.19 ± 4.7566.46 ± 22.830.00018.87 ± 3.4560.16 ± 22.680.00018.96 ± 3.7554.74 ± 14.450.000 1029.89 ± 6.9169.06 ± 10.270.00025.33 ± 5.3763.46 ± 11.350.00023.52 ± 4.5456.53 ± 12.240.000 1160.73 ± 10.6193.13 ± 15.090.00055.43 ± 10.3492.29 ± 14.000.00052.59 ± 11.3287.05 ± 13.530.000 1290.21 ± 12.8182.86 ± 24.230.26387.58 ± 18.1172.55 ± 22.240.03774.71 ± 19.4464.90 ± 19.210.160 PPA: peripapillary atrophy *p-value:t-test. Table 6. Comparison of clock-hour sector retinal nerve fiber layer thicknesses between the two groups measured by GDx-ECC with various scan circle sizes (mean ± standard devia- tion, μm)
Clock hour
Small scan circle (2.4 mm)Medium scan circle (3.2 mm) Large scan circle (4.0 mm) Control GroupPPA Groupp-value*Control GroupPPA Groupp-value*Control GroupPPA Groupp-value* 194.86 ± 8.7579.11 ± 21.200.00589.06 ± 11.9269.41 ± 19.700.00179.37 ± 13.1564.31 ± 18.270.010 262.87 ± 17.4245.68 ± 18.010.00553.08 ± 17.5239.60 ± 14.040.01345.36 ± 15.5536.48 ± 14.810.103 321.83 ± 5.8524.55 ± 8.750.26821.30 ± 5.8125.21 ± 9.560.13723.58 ± 6.2527.98 ± 10.180.142 440.79 ± 8.0225.53 ± 8.890.00032.65 ± 8.5026.85 ± 10.780.07429.64 ± 8.5628.71 ± 10.730.784 579.19 ± 9.3361.64 ± 13.770.00070.44 ± 9.4852.55 ± 10.540.00064.80 ± 9.2551.27 ± 9.240.000 689.47 ± 8.3489.72 ± 14.880.95081.46 ± 10.3079.77 ± 13.210.66477.53 ± 8.8071.92 ± 10.270.102 782.11 ± 9.2599.44 ± 22.400.00181.29 ± 9.7893.63 ± 17.310.01075.00 ± 10.0182.76 ± 17.760.129 835.07 ± 5.9465.67 ± 17.710.00030.35 ± 5.1059.21 ± 21.700.00025.23 ± 4.2759.03 ± 26.260.000 918.54 ± 5.5326.56 ± 6.130.00017.80 ± 5.3820.85 ± 7.480.15818.84 ± 5.0717.97 ± 2.300.533 1021.50 ± 4.5847.66 ± 16.430.00020.22 ± 4.1440.13 ± 17.100.00020.54 ± 2.8735.69 ± 16.440.000 1157.44 ± 7.1685.16 ± 12.970.00052.43 ± 6.6185.36 ± 15.240.00049.72 ± 8.9278.66 ± 14.470.000 1281.95 ± 10.2885.16 ± 18.710.51784.33 ± 14.3275.12 ± 18.120.09174.08 ± 13.5567.29 ± 17.870.226 PPA = peripapillary atrophy. *p-value:t-test.
PPA group was not significantly different or less than that of the control group. Therefore, our results suggest that the difference in average RNFL thickness measured by GDx- VCC was primarily caused by the difference in the tempo- ral area where PPA existed. This may be attributed to the high scleral reflectivity, which can cause an increase in the retardation values because of retinal and choroidal atrophy in myopic eyes with PPA.21,24,25 However, even though the size of scan circle was large enough not to include the PPA area, the RNFL thickness was still overestimated using GDx, as it was with OCT.
The average RNFL thickness measured by GDx-ECC did
not demonstrate any difference between the two groups, in contrast to the result obtained by GDx-VCC. When RNFL thickness at each clock hour area was analyzed, the RNFL thickness of the PPA group in areas with PPA was greater than that of the control group, whereas the RNFL thickness of the PPA group was not significantly different or less than the control group in areas without PPA. This may suggest that RNFL thickness in the temporal area can be overesti- mated when measured by GDx-ECC, although the degree of overestimation is less than that with GDx-VCC. Previous studiescomparing RNFL thickness measured by GDx-VCC and by GDx-ECC also showed similar results.19,20,25 This Figure 2. Retinal nerve fiber layer (RNFL) thickness curves of control and peripapillary (PPA) groups obtained by GDx-VCC and GDx-ECC with various scan circle sizes. The RNFL thickness of the PPA group was less than that of control group except for in the temporal area.
In the temporal area, the RNFL thickness of the PPA group was greater than that of the control group.
may be due to the fact that measuring by GDx-ECC resulted in an improvement in the typical scan score and reduction in the high retardation values in the area with PPA.
Most of the OCT and GDx studies on myopia have used one scan circle and included myopic eyes that had a small PPA that was not included in the scan circle. 25,26,28 We wanted to know whether PPA per se has an effect on the measurement of RNFL thickness. Our results revealed that the difference in the pattern of RNFL thickness between the two groups in the temporal area was consistent with all scan circles, regardless of size, even when the scan circle was large enough not to include the PPA area. When the RNFL thickness was measured with a 4.0 mm diameter scan circle, no scan circle included the PPA in the subject eye. However, the RNFL measurement with this large scan circle showed similar results as those with the smaller scan circles. Therefore, the RNFL thickness in the temporal area measured by OCT did not differ between the two groups and the RNFL thickening measured by GDx-VCC and GDx-ECC in the temporal area between the two groups was not affected by PPA.
Abnormal retardation is a possible cause of overestima- tion of RNFL thickness with GDx. However, it is unclear why the RNFL thickness in the temporal area measured by OCT showed no significant difference, whereas a thinner RNFL was found in the nasal, superior and inferior areas in eyes with myopia. In addition, little is known about the temporal thickening in the area outside the PPA in myopia.
Histological studies have demonstrated that the sensory retina becomes thinner in myopic eyes.30,31 However, those studies did not address RNFL thickness in each quadrant.
Therefore, it remains to be determined whether or not actu- al thickening is present in the temporal area in myopic eyes.
The possibility of overestimating the RNFL thickness in the temporal areas also needs to be considered. For exam- ple, optic disc tilting could influence the measurement of the RNFL thickness. Optic disc tilting is frequently seen in myopic eyes,9 and errors in RNFL measurements could oc- cur by off-axis scanning. OCT evaluates images presumed to be taken perpendicularly to the longitudinal axis of the eyeball.32 However, in myopic eyes, the nasal half of the
optic disc is elevated, and the temporal half is depressed.30 Therefore, when the OCT scan reflects oblique, there could be a change in the RNFL thickness.
It is known that a larger optic disc can exhibit a thicker RNFL with a fixed scan circle size, because the scan circle is located closer to the optic disc edge in eyes with a larger optic disc.33 Therefore, size differences in optic discs may be a confounding factor in this study. However, we found no statistically significant differences between the vertical and horizontal diameters of the optic disc between the two groups.
Although we did not collect data for axial length, it is reasonable to assume that there could be axial length differ- ences between the two groups. Eyes with a higher degree of myopia have longer axial lengths.7,30 Studies using OCT de- termined that the average RNFL thickness decreases with increasing axial length and negative refractive power.26,27 Differences in axial lengths between the two groups could affect our results.
In conclusion, the measurement of RNFL thickness of myopic eyes by OCT, GDx-VCC and GDx-ECC in the temporal area where PPA exists produces different patterns that those in the areas where PPA does not exist. However, PPA itself does not appear to influence the measurement of RNFL thickness with these instruments. More attention is needed to evaluate the measurement of RNFL thickness by OCT, GDx-VCC, and GDx-ECC in the temporal area of myopic eyes, regardless of the presence of PPA.
References
1. Quigley HA, Katz J, Derrick RJ, et al. An evaluation of optic disc and nerve fiber layer examinations in monitor- ing progression of early glaucoma damage. Ophthalmol- ogy 1992;99:19-28.
2. Sommer HA, Quigley HA, Robin AL, et al. Evalua- tion of nerve fiber layer assessment. Arch Ophthalmol 1984;102:1766-71.
3. Quigley HA, Addicks EM, Green WR. Optic nerve damage in human glaucoma. Arch Ophthalmol 1982;100:135-46.
4. Fong DS, Epstein DL, Allingham RR. Glaucoma and myo- pia: are they related? Int Ophthalmol Clin 1990;30:215-8.
5. Perkins ES, Phelps CD. Open angle glaucoma, ocular
hypertension, low-tension glaucoma, and refraction. Arch Ophthalmol 1982;100:1464-7.
6. Mitchell P, Hourihan F, Sandbach J, Wang JJ. The relation- ship between glaucoma and myopia: the Blue Mountains Eye Study. Ophthalmology 1999;106:2010-5.
7. Curtin BJ, Iwamoto T, Renaldo DP. Normal and staphy- lomatous sclera of high myopia: an electron microscopic study. Arch Ophthalmol 1979;97:912-5.
8. Cahane M, Bartov E. Axial length and scleral thickenss ef- fect on susceptibility to glaucomatous damage: a theoreti- cal model implementing Laplace’s law. Ophthalmic Res 1992;24:280-4.
9. Chihara E, Chihara K. Covariation of optic disk measure- ments and ocular parameters in the healthy eye. Graefe’s Arch Clin Exp Ophthalmol 1994;232:265-71.
10. Dorrell D. The tilted disk. Br J Ophtlamol 1978;62:16-20.
11. Jonas JB, Gusek GC, Naumann GOH. Optic disk morphol- ogy in high myopia. Greafe’s Arch Clin Exp Ophthalmol 1988;226:587-90.
12. Fantes FE, Anderson DR. Clinical histologic correlation of human peripapillary anatomy. Ophthalmology 1989;96:20-5.
13. Kubota TK, Jonas JB, Naumann GOH. Direct clino-histo- logical correlation of parapapillary chorioretinal atrophy.
Br J Ophthalmol 1993;77:103-6.
14. Weinreb RN, Shakiba S, Zangwill L. Scanning laser po- larimetry to measure the nerve fiber layer of normal and glaucomatous eyes. Am J Ophthalmol 1995;119:627-36.
15. Hoh ST, Greenfield DS, Mistlberger A, et al. Optical co- herence tomography and scanning laser polarimetry in normal, ocular hypertensive, and glaucomatous eyes. Am J Ophthalmol 2000;129:129-35.
16. Schumann JS, Hee MR, Puliafito CA, et al. Quantification of nerve fiber layer thickness in normal and glaucomatous eyes using optical coherence tomography. Arch Ophthal- mol 1995;113:586-96.
17. Guedes V, Schumann JS, Hertzmaek E, et al. Optical co- herence tomography measurement of macular and nerve fiber layer thickness in normal and glaucomatous human eyes. Opthalmology 2003;110:177-89.
18. Tjon-Fo-Sang MJH, Lemij HG. The sensitivity and speci- ficity of nerve fiber layer measurements in glaucoma as determined with scanning laser polarimetry. Am J Oph- thalmol 1997;123:62-9.
19. Reus NJ, Zhou Q, Lemij HG. Enhanced imaging algo- rithm for scanning laser polarimetry with variable corneal compensation. Invest Ophthalmol Vis Sci 2006;47:3870-7.
20. Bowd C, Tavares IM, Medeiros FA, et al. Retinal nerve fiber layer thickness and visual sensitivity using scanning
laser polarimetry with variable and enhanced corneal com- pensation. Ophthalmology 2007;114:1259-65.
21. Bagga H, Greenfield DS, Feuer WJ. Quantitative assess- ment of atypical birefringence images using scanning laser polarimetry with variable corneal compensation. Am J Ophthalmol 2005;139:437-46.
22. Hee MR, Izatt JA, Swanson EA, et al. Optical coher- ence tomography of the human retina. Arch Ophthalmol 1995;113:325-32.
23. Jaffe GJ, Caprioli J. Optical coherence tomography to de- tect and manage retinal disease and glaucoma. Am J Oph- thalmol 2004;137:156-69.
24. Bozkurt B, Irkec M, Gedik S, et al. Effect of peripapil- lary chorioretinal atrophy on GDx parameters in patients with degenerative myopia. Clin Experiment Ophthalmol 2002;30:411-4.
25. Morishita S, Tanabe T, Yu S, et al. Retinal nerve fiber layer assessment in myopic glaucomatous eyes: comparison of GDx variable corneal compensation with GDx enhanced corneal compensation. Br J Ophthalmol 2008;92:1377-81.
26. Leung CKS, Mohamed S, Leung KS, et al. Retinal nerve fiber layer measurements in myopia: an optical coher- ence tomography study. Invest Ophthalmol Vis Sci 2006;47:5171-6.
27. Vermon SA, Rotchford AP, Negi A, et al. Peripapillary retinal nerve fiber layer thickness in highly myopic Cauca- sians as measured by Stratus optical coherence tomogra- phy. Br J Ophthalmol 2008;92:1076-80.
28. Choi SW, Lee SK. Thickness changes in the fovea and peripapillary retinal nerve fiber layer depend on the degree of myopia. Korean J Ophthalmol 2006;20:215-9.
29. Kim JW, Kim YY. Changes in retinal nerve fiber layer thickness according to the myopia in patients with glau- coma and ocular hypertension. J Korean Ophthalmol Soc 2008;49:1634-40.
30. Yanoff M, Fine BS: Ocular Pathology. 3rd ed, Philadel- phia, J. B. Lippincott, 1989, p.484.
31. Grossniklaus HE, Green WR. Pathologic findings in pathologic myopia. Ophthalmology 1992;12:127-33.
32. Park CY, Kim UT, Kee C. Evaluation of the influence of tilt of optic disc on the measurement of optic disc variables obtained by optical coherence tomography and confocal scanning laser ophthalmoscopy. J Glaucoma 2005;14:210-4.
33. Savini G, Barboni P, Carbonelli M, Zanini M. The effect of scan diameter on retinal nerve fiber layer thickness measurement using Stratus optic coherence tomography.
Arch Ophthalmol 2007;125:901-5.