© 2016 The Korean Ophthalmological Society
This is an Open Access article distributed under the terms of the Creative Commons Attribution Non-Commercial License (http://creativecommons.org/licenses /by-nc/3.0/) which permits unrestricted non-commercial use, distribution, and reproduction in any medium, provided the original work is properly cited.
Original Article
Retinal Nerve Fiber Layer Thickness Measurement Comparison Using Spectral Domain and Swept Source Optical Coherence Tomography
Ahnul Ha, Seung Hyen Lee, Eun Ji Lee, Tae-Woo Kim
Department of Ophthalmology, Seoul National University Bundang Hospital, Seongnam, Korea
Purpose: To investigate the retinal nerve fiber layer (RNFL) thickness concordance when measured by spectral domain (SD) and swept source (SS) optical coherence tomography (OCT), and to compare glaucoma-discrim- inating capability.
Methods: RNFL thicknesses were measured with the scan circle, centered on the optic nerve head, in 55 healthy, 41 glaucoma suspected, and 87 glaucomatous eyes. The RNFL thickness measured by the SD-OCT (sdRNFL thickness) and SS-OCT (ssRNFL thickness) were compared using the t-test. Bland-Altman analysis was performed to examine their agreement. We compared areas under the receiver operating characteristics curve and examined sdRNFL and ssRNFL thickness for discriminating glaucomatous eyes from healthy eyes, and from glaucoma suspect eyes.
Results: The average ssRNFL thickness was significantly greater than sdRNFL thickness in healthy (110.0 ± 7.9 vs. 100.1 ± 6.8 µm, p < 0.001), glaucoma suspect (96.8 ± 9.3 vs. 89.6 ± 7.9 µm, p < 0.001), and glaucomatous eyes (74.3 ± 14.2 vs. 69.1 ± 12.4 µm, p = 0.011). Bland-Altman analysis showed that there was a tendency for the difference between ssRNFL and sdRNFL to increase in eyes with thicker RNFL. The area under the curves of the average sdRNFL and ssRNFL thickness for discriminating glaucomatous eyes from healthy eyes (0.984 vs. 0.986, p = 0.491) and glaucoma suspect eyes (0.936 vs. 0.918, p = 0.132) were comparable.
Conclusions: There was a tendency for ssRNFL thickness to increase, compared with sdRNFL thickness, in eyes with thicker RNFL. The ssRNFL thickness had comparable diagnostic capability compared with sdRNFL thickness for discriminating glaucomatous eyes from healthy eyes and glaucoma suspect eyes.
Key Words: Diagnostic capability, Glaucoma, Optical coherence tomography, Retinal nerve fiber layer thick- nesses
Glaucoma is a chronic and progressive disease charac- terized by the loss of retinal ganglion cells and their axons [1,2]. Assessment of the retinal nerve fiber layer (RNFL) has been an important target for both glaucoma diagnosis and disease progression monitoring because the RNFL comprises the retinal ganglion cell axons [3,4].
With recent developments in imaging devices, RNFL thickness can be better evaluated both objectively and quantitatively. Optical coherence tomography (OCT), an
Received: July 31, 2015 Accepted: October 27, 2015
Corresponding Author: Tae-Woo Kim, MD. Department of Ophthal- mology, Seoul National University Bundang Hospital, #82 Gumi-ro 173 beon-gil, Bundang-gu, Seongnam 13620, Korea. Tel: 82-31-787-7374, Fax:
82-31-731-4057, E-mail: [email protected]
Part of this work was presented at the Association for Research in Vision and Ophthalmology 2014 Annual Meeting in Orlando, FL, USA on May 4-8, 2014.
imaging device that allows RNFL thickness to be mea- sured, has been increasingly used since it was first intro- duced [5]. The time domain (TD)-OCT. the earliest type of OCT, has a resolution of 8 to 10 μm and an acquisition speed of 400 A-scans/sec. A more recently introduced spectral domain-OCT (SD-OCT) has much faster scanning speed (24,000 to 55,000 A-scans/sec) with higher axial res- olution (3 to 6 μm) than TD-OCT [6]. Recently, swept source (SS)-OCT, has become commercially available, and this OCT uses a longer wave length light. This property could be applied to image the deep tissues such as the cho- roid or deep optic nerve head. In addition, SS-OCT has faster scanning speed (100,000 to 400,000 A-scan/sec), which reduces the image acquisition time [7].
The purpose of this study was to investigate the concor- dance between RNFL thicknesses measured by SD- and SS- OCT and to compare their ability to distinguish glaucoma.
Materials and Methods
The participants in this study were subjects from the Lamina Cribrosa Exploration Study and the Investigating Glaucoma Progression Study, which is an ongoing pro- spective study at the Seoul National University Bundang Hospital Glaucoma Clinic. This study was approved by the Seoul National University Bundang Hospital institutional review board and conformed to the Declaration of Helsin- ki. Informed consent was obtained from all participants.
Study subjects
All subjects received comprehensive ophthalmic exam- inations that included visual acuity measurement, Gold- mann applanation tonometry, refraction tests, slit-lamp biomicroscopy, gonioscopy, and dilated stereoscopic exam- ination of the optic disc. They also underwent SD-OCT (Spectralis OCT; Heidelberg Engineering, Heidelberg, Germany) and SS-OCT (DRI1 OCT; Topcon, Tokyo, Ja- pan) on the same day by a single well-trained operator. An open angle glaucoma was defined as the presence of glau- comatous optic neuropathy, such as rim thinning, notching and RNFL defect, and associated visual field loss with an open iridocorneal angle. Glaucomatous visual field defect was defined as (1) outside the normal limits on a glaucoma hemifield test, (2) 3 abnormal points, with p-value less than
0.05 of being normal, one with p-value less than 0.01 by pattern deviation, or (3) a pattern standard deviation of less than 5% confirmed on two consecutive reliable tests (fixa- tion loss rate ≤20%, false-positive and false-negative error rates ≤25%).
Glaucoma was suspected if the participant had an optic disk that was suspicious for glaucoma based on stereo pho- tograph review or ocular hypertension (intraocular pres- sure >21 mmHg) without a history of repeatable glaucoma- tous visual field damage. A normal subject was determined to have an intraocular pressure less than 21 mmHg, nor- mal-appearing optic nerve head without asymmetry, cup- ping, hemorrhages or notches; normal RNFL was deter- mined by red-free fundus photo and normal visual field results (i.e., the absence of glaucomatous visual field and neurological defects).
The following were used as exclusion criteria: a best-cor- rected visual acuity level worse than 20 / 40, spherical equivalent greater than ±6.0 diopters, cylinder correction greater than ±3.0 diopters, history of any ocular surgery except uncomplicated cataract, presence of a disease that could affect the peripapillary area (where OCT measure- ments were obtained), or presence of any retinal and/or op- tic nerve disease other than glaucoma.
Optical coherence tomography
The circumpapillary RNFL thickness was measured us- ing SD-OCT (Spectralis) and SS-OCT (DRI1) with a 3.46 mm-diameter scan circle centered on the optic disc. The Spectralis OCT combines confocal laser scanning ophthal- moscopy, which enables real-time 3D tracking of eye movements, with real-time averaging of multiple B-scans (870 nm axial resolution) acquired at an identical location of interest on the retina, in order to reduce speckle noise.
Spectralis provides RNFL thickness values for four quad- rants, six sectors, and a global average (360 degree mea- sure). The DRI1 OCT uses a light source of a wave- length-sweeping laser centered at 1,050 nm, with a repetition rate of 100,000 Hz (scan circle diameter). DRI1 OCT pro- vides RNFL thickness values for four quadrants, a 12-hour clock, and a global average.
Statistical analysis
For the sample size calculation, the results of a pilot
evaluation were used, and the mean difference of the aver- age RNFL thicknesses between the two devices measured to be 10 μm, with an expected standard deviation of 20 μm, were compared. Using a confidence level of 95% and a power of 80%, 128 subjects were estimated to be necessary for sufficient power comparisons in each group. By includ- ing 183 patients in each group, with an expected standard deviation of 20 μm, a difference of 4.16 μm could be dis- tinguished. Clinical characteristics of healthy, suspected glaucoma, and glaucoma eyes were compared by an analy- sis of variance and the Turkey test as a post hoc analysis.
The average and four quadrants of RNFL thickness measured by the SD-OCT (sdRNFL) and RNFL thickness measured by the SS-OCT (ssRNFL) thickness were com- pared by paired t-tests. The correlations between sdRNFL and ssRNFL measurements were assessed by the Pearson correlation coefficient. A Bland-Altman plot was graphed for the average, and four quadrants were used to assess the agreement between the sdRNFL and ssRNFL measure- ments. The ability of two OCTs to discriminate glaucoma- tous eyes from healthy and suspect eyes was determined by the area under the curve (AUC) of the receiver operat- ing characteristics. Statistical analyses were performed us- ing the IBM SPSS ver. 19.0 (IBM Corp., Armonk, NY, USA). Unless otherwise stated, the data are presented as the mean ± standard deviation values, and the cutoff for statistical significance was set at p-value less than 0.05.
Results
This study included 55 healthy, 41 suspected glaucoma, and 87 glaucomatous eyes. The clinical characteristics of
patient participants are shown in Table 1. Eighty-eight were male and 95 were female. The age of healthy, glauco- ma suspect and glaucoma participants was 60.6 ± 13.6, 63.9
± 13.1, and 63.3 ± 14.3 years, respectively. Glaucoma pa- tients had a higher incidence of myopathy than healthy subjects and glaucoma suspects (p < 0.001). The visual field mean deviation was lower in the glaucomatous group than other groups (p < 0.001).
Comparison and agreement of retinal nerve fiber layer thickness
The average ssRNFL thickness was significantly greater than the average sdRNFL thickness in all three subject groups (Table 2): healthy (110.0 ± 7.9 vs. 100.1 ± 6.8 µm, p
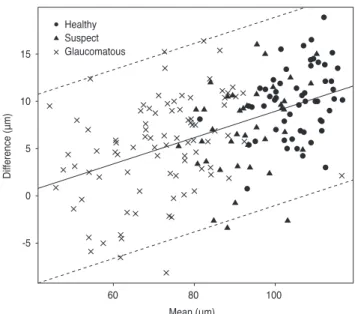
< 0.001), suspected glaucoma (96.8 ± 9.3 vs. 89.6 ± 7.9 µm, p < 0.001), and glaucomatous eyes (74.3 ± 14.2 vs. 69.1 ± 12.4 µm, p < 0.001). The same tendency was found for the quadrant thicknesses, although the tendency did not reach statistical significance in some quadrants (Table 2). The average and quadrant ssRNFL thickness and sdRNFL thickness (average of 183 eyes) were highly correlated (r = 0.97, p < 0.001) (Fig. 1). Significant correlation was also found for all diagnosis groups (Table 3). Among the four quadrants, the highest correlation was found in the inferior sector (r = 0.96, p < 0.001) with the nasal sector as the low- est (r = 0.84, p < 0.001). Fig. 2 demonstrates the Bland-Alt- man plot for average RNFL measurements of the 183 par- ticipants. The ssRNFL minus sdRNFL was positively associated with the ssRNFL and sdRNFL mean (SS - SD = -4.94 + 0.14 × (SS + SD) / 2, p < 0.001), indicating larger discrepancy between the two measurements in eyes with thicker RNFL. A similar tendency was also found for
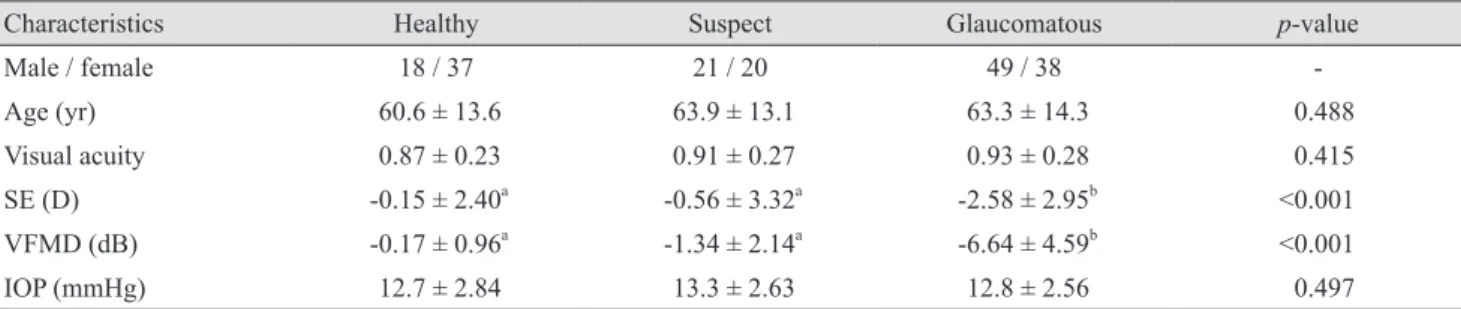
Table 1. Demographics
Characteristics Healthy Suspect Glaucomatous p-value
Male / female 18 / 37 21 / 20 49 / 38 -
Age (yr) 60.6 ± 13.6 63.9 ± 13.1 63.3 ± 14.3 0.488
Visual acuity 0.87 ± 0.23 0.91 ± 0.27 0.93 ± 0.28 0.415
SE (D) -0.15 ± 2.40a -0.56 ± 3.32a -2.58 ± 2.95b <0.001
VFMD (dB) -0.17 ± 0.96a -1.34 ± 2.14a -6.64 ± 4.59b <0.001
IOP (mmHg) 12.7 ± 2.84 13.3 ± 2.63 12.8 ± 2.56 0.497
Values are presented as number or mean ± standard deviation.
SE = spherical equivalent; D = diopters; VFMD = visual field mean deviation; IOP = intraocular pressure.
a,bValues with different superscript differ significantly.
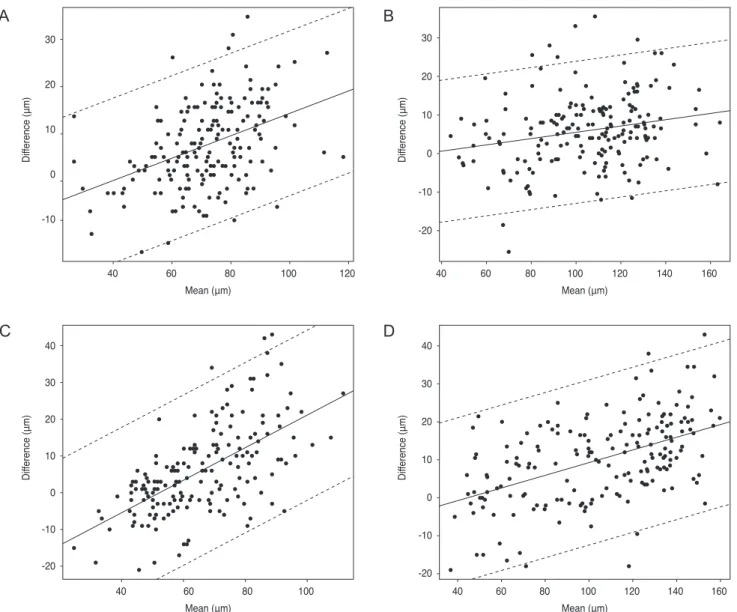
quadrant RNFL thicknesses (Fig. 3A-3D).
Glaucoma discriminating capability
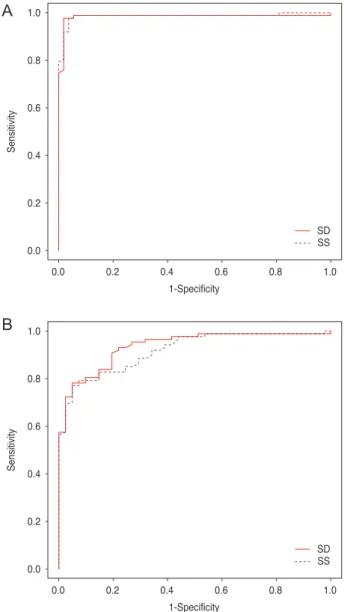
The AUC of average RNFL thickness revealed that both SS-OCT and SD-OCT performed similarly in discriminat- ing glaucomatous eyes from healthy ones (0.986 vs. 0.984, p = 0.385), and glaucomatous eyes from glaucoma suspect eyes (0.918 vs. 0.936, p = 0.132) (Table 4 and Fig. 4A and 4B). The global average RNFL thickness showed a higher capability for discriminating between diagnosis groups than individual quadrants. The AUC of individual quad- Table 2. Comparison of retinal nerve fiber laser thickness measured by SD- and SS-optical coherence tomography in different di- agnosis groups and quadrants
Healthy Suspect Glaucoma
SS SD p-value SS SD p-value SS SD p-value
Average 110.03 ± 7.91 100.05 ± 6.84 0.001 96.80 ± 9.32 89.61 ± 7.92 0.003 74.26 ± 14.19 69.08 ± 12.44 0.002 Temporal 85.25 ± 13.75 77.00 ± 11.25 0.003 80.71 ± 16.08 72.56 ± 12.20 0.011 66.08 ± 17.46 61.13 ± 13.66 0.025 Superior 129.78 ± 15.88 123.25 ± 13.80 0.075 115.17 ± 13.92 108.29 ± 11.81 0.106 90.02 ± 24.59 85.06 ± 22.49 0.089 Nasal 79.51 ± 19.41 70.87 ± 12.73 0.004 68.88 ± 20.08 65.37 ± 12.55 0.312 60.25 ± 17.89 55.39 ± 10.73 0.042 Inferior 145.56 ± 12.44 129.10 ± 10.73 <0.001 122.46 ± 17.93 112.22 ± 14.67 0.022 80.69 ± 27.23 74.75 ± 23.36 0.053 SD = spectral domain; SS = swept source.
Table 3. Correlation coefficient between retinal nerve fiber laser thicknesses measured by spectral domain and swept source optical coherence tomography in different diagnosis groups and in different quadrants
Correlation coefficient Probability Diagnosis group
Healthy 0.888 <0.001
Suspects 0.867 <0.001
Glaucoma 0.932 <0.001
Quadrants
Global average 0.971 <0.001
Temporal 0.864 <0.001
Superior 0.936 <0.001
Nasal 0.836 <0.001
Inferior 0.957 <0.001
Spectral domain (μm) Healthy
Suspect Glaucomatous
Swept source (μm)
40 60 80 100
120
100
80
60
R2 = 0.971
Fig. 1. Scatter plot of the average retinal nerve fiber layer thick- ness measurements for 183 eyes.
Mean (μm)
Difference (μm)
60 80 100
15 10 5 0 -5
Healthy Suspect Glaucomatous
Fig. 2. Bland-Altman plot of average retinal nerve fiber layer (RNFL) thickness between swept source and spectral domain optical coherence tomography (OCT). Note that the swept source OCT RNFL thickness was greater than that of spectral domain OCT in eyes with larger RNFL thickness. The solid line indicates the regression line and the dashed lines indicate the 95% limit of agreement.
rant RNFL thickness was similar between the two OCTs, except for the nasal sector, in which SD-OCT was better than SS-OCT in discriminating glaucomatous eyes from healthy eyes (0.824 vs. 0.768, p < 0.05) and glaucomatous eyes from glaucoma suspect eyes (0.721 vs. 0.618, p <
0.001).
Discussion
In this study, ssRNFL thickness was greater than that of sdRNFL in all diagnostic groups. There was a tendency for ssRNFL thickness to be increasingly greater than
sdRNFL thickness in eyes with thicker RNFL. In compar- ison, Matsuo et al. [8] observed thicker choroidal thickness with SS-OCT than SD-OCT. The authors assumed that the thicker measurement by SS-OCT may be attributable to a more distinct outer border of the choroid in SS-OCT imag- es, which was most likely because SS-OCT can record choroidal images deeper than the SD-OCT. We did not think that the discrepancy between SD- and SS-OCT in the RNFL thickness was also attributable to this because the RNFL layer was fully visualized using both OCTs. In addition, the increasingly greater difference in eyes with thicker RNFL cannot be explained by the difference in the ability of detecting RNFL borders between the devices.
Mean (μm)
Difference (μm)
60
40 80 100 120
30 20 10 0 -10
Mean (μm) 60
40 80 100 120 140 160
30 20 10 0 -10 -20
Mean (μm)
Difference (μm) Difference (μm)Difference (μm)
60
40 80 100
40 30 20 10 0 -10 -20
40 30 20 10 0 -10 -20
Mean (μm) 60
40 80 100 120 140 160
Fig. 3. Bland-Altman plots of agreement of quadrant retinal nerve fiber layer thicknesses between swept source and spectral domain opti- cal coherence tomography at temporal (A), superior (B), nasal (C), and inferior (D) quadrants.
A
C
B
D
Although we do not have a clear explanation for the dis- crepancy between SD- and SS-OCT, there are several pos- sible explanations for this outcome. First, the discrepancy may be attributable to the data processing procedure of the device (e.g., conversion of raw data to RNFL thickness).
The increasing discrepancies in eyes with thicker RNFL supports this possibility. However, we do not have detailed information about the software of each device, and thus, could not confirm this possibility. Second, the difference in the diameters of the circle scans of the two devices may contribute to the discrepancy; the Spectralis uses a 3.46 mm scan circle, while the DRI1 uses a 3.40 mm scan cir- cle. The RNFL is thicker near the optic disc and gets thin- ner towards the periphery [9,10]. Thus, the RNFL would be thicker when measured with a smaller scan circle (i.e., DRI1). If the thinning of the RNFL from the disc margin to the periphery is stiffer in eyes with thicker RNFL than in eyes with thinner RNFL, the effect of the scan circle difference would be greater in eyes with thicker RNFL.
However, it is not currently known whether the RNFL thickness decreases more rapidly as it moves towards the periphery in eyes with thicker RNFL.
Significant positive correlations were observed between ssRNFL and sdRNFL thickness for the global average and individual quadrant RNFL thicknesses. When the quad- rant RNFL thicknesses were compared, inferior and supe- rior quadrants had much higher correlation than temporal
and nasal quadrants. Similar findings have also been re- ported between TD- and SD-OCT [11,12]. A low degree of correlation in the temporal and nasal quadrants may be explained by less reliable measurements of the RNFL thickness in the temporal and nasal sectors [11].
Similar AUCs between SD- and SS-OCT observed in the current study indicated that both OCTs have compara- ble diagnostic capability. For both OCTs, the global aver- age RNFL thickness had the highest ability to distinguish between glaucoma and healthy eyes. The inferior quadrant thickness had the highest diagnostic capability, and these findings are in agreement with previous studies. It has Table 4. Discriminating ability of SD- and SS-OCT glauco-
matous from healthy and from suspect eyes as measured by the area under the curve method
Quadrant OCT
p-value
SD SS
Glaucomatous
from healthy Temporal 0.823 0.799 0.385 Superior 0.923 0.916 0.286
Nasal 0.824 0.768 0.036
Inferior 0.980 0.985 0.575
Average 0.984 0.986 0.491
Glaucomatous
from suspect Temporal 0.721 0.710 0.735 Superior 0.831 0.812 0.385
Nasal 0.721 0.618 0.001
Inferior 0.898 0.888 0.463
Average 0.936 0.918 0.132
SD = spectral domain; SS = swept source; OCT = optical coher- ence tomography.
1-Specificity
Sensitivity
0.2
0.0 0.4 0.6 0.8
SDSS 1.0 1.0
0.8 0.6 0.4 0.2 0.0
1-Specificity
Sensitivity
0.2
0.0 0.4 0.6 0.8
SDSS 1.0 1.0
0.8 0.6 0.4 0.2 0.0
Fig. 4. The area under the curve for receiver operating character- istics of retinal nerve fiber layer thickness to discriminate glau- comatous eyes from healthy eyes (A) and suspect eyes (B). SD = spectral domain; SS = swept source.
A
B
been demonstrated that the global average and inferior RNFL thickness were optimal for discriminating healthy eyes from those with glaucoma, using TD-OCT and SD- OCT [13-20]. A high discriminating ability of the inferior and, to a lesser extent, of the superior regions compared to the nasal and temporal regions may be explained by the fact that OCT can more easily detect RNFL changes in the vertical axis because of the thicker RNFL bundles in the vertical sectors [16], which can be substantiated by the fact that glaucomatous changes begin in inferior and superior poles of the optic nerve head [21].
In this study, the global average RNFL thickness had slightly higher AUC than the inferior quadrant thickness.
However, there have been conflicting results on this issue.
Shin and Cho [18] reported that average RNFL thickness, compared to quadrant values, demonstrated the best diag- nostic performance for both TD- and SD-OCT in discrim- inating between normal and glaucoma patients. Wollstein et al. [22] reported that average and inferior RNFL thick- ness had the same highest AUC, but average RNFL was more sensitive. In contrast to these results, a better AUC for inferior RNFL than average RNFL has been reported for discriminating glaucoma from glaucoma suspects [13,14]. Other studies reported a similar AUC between av- erage and inferior RNFL thickness in discriminating nor- mal and glaucoma suspect eyes [16] and normal and early glaucoma eyes [17,20]. Altogether, the ability to distinguish between average and inferior RNFL seems equivocal.
There were some limitations to this study. First, the sam- ple size was relatively small. Thus, further study with a larger sample population may be needed to confirm these findings. Second, the diagnostic performance was not compared, in terms of sensitivity and specificity, for device classification (i.e., less than 1 percentile and less than 5 percentile, etc.) for the measured values. This was because there is currently no normative data for the DRI1. Howev- er, when the data becomes available, comparison of the sensitivity at fixed specificity of the classification of the devices would provide additional insight into the diagnos- tic accuracy of these devices.
In conclusion, although ssRNFL and sdRNFL thick- nesses are highly correlated, the thicknesses were signifi- cantly different from each other across all diagnostic groups. There was a tendency for SS-OCT to measure a thicker RNFL in eyes and this finding should be consid- ered when a patient undergoes longitudinal follow-up with
different OCTs. Both SS-OCT and SD-OCT had high and comparable capabilities for discriminating glaucomatous eyes from suspected glaucoma and healthy eyes.
Conflict of Interest
No potential conflict of interest relevant to this article was reported.
Acknowledgements
The work was supported by a grant from the Seoul Na- tional University Bundang Hospital Research Fund (02- 2013-013).
References
1. Quigley HA, Katz J, Derick RJ, et al. An evaluation of optic disc and nerve fiber layer examinations in monitoring pro- gression of early glaucoma damage. Ophthalmology 1992;
99:19-28.
2. Yucel YH, Gupta N, Kalichman MW, et al. Relationship of optic disc topography to optic nerve fiber number in glau- coma. Arch Ophthalmol 1998;116:493-7.
3. Leung CK, Cheung CY, Lin D, et al. Longitudinal variabil- ity of optic disc and retinal nerve fiber layer measurements.
Invest Ophthalmol Vis Sci 2008;49:4886-92.
4. Sehi M, Greenfield DS. Assessment of retinal nerve fiber layer using optical coherence tomography and scanning la- ser polarimetry in progressive glaucomatous optic neurop- athy. Am J Ophthalmol 2006;142:1056-9.
5. Huang D, Swanson EA, Lin CP, et al. Optical coherence to- mography. Science 1991;254:1178-81.
6. Drexler W, Fujimoto JG. State-of-the-art retinal optical co- herence tomography. Prog Retin Eye Res 2008;27:45-88.
7. Potsaid B, Baumann B, Huang D, et al. Ultrahigh speed 1050nm swept source/Fourier domain OCT retinal and an- terior segment imaging at 100,000 to 400,000 axial scans per second. Opt Express 2010;18:20029-48.
8. Matsuo Y, Sakamoto T, Yamashita T, et al. Comparisons of choroidal thickness of normal eyes obtained by two differ- ent spectral-domain OCT instruments and one swept- source OCT instrument. Invest Ophthalmol Vis Sci 2013;54:
7630-6.
9. Schuman JS, Hee MR, Puliafito CA, et al. Quantification of nerve fiber layer thickness in normal and glaucomatous eyes using optical coherence tomography. Arch Ophthal- mol 1995;113:586-96.
10. Varma R, Skaf M, Barron E. Retinal nerve fiber layer thickness in normal human eyes. Ophthalmology 1996;103:
2114-9.
11. Budenz DL, Chang RT, Huang X, et al. Reproducibility of retinal nerve fiber thickness measurements using the stra- tus OCT in normal and glaucomatous eyes. Invest Oph- thalmol Vis Sci 2005;46:2440-3.
12. Sung KR, Kim DY, Park SB, Kook MS. Comparison of retinal nerve fiber layer thickness measured by Cirrus HD and Stratus optical coherence tomography. Ophthalmology 2009;116:1264-70.e1.
13. Gyatsho J, Kaushik S, Gupta A, et al. Retinal nerve fiber layer thickness in normal, ocular hypertensive, and glauco- matous Indian eyes: an optical coherence tomography study. J Glaucoma 2008;17:122-7.
14. Leung CK, Chan WM, Yung WH, et al. Comparison of macular and peripapillary measurements for the detection of glaucoma: an optical coherence tomography study. Oph- thalmology 2005;112:391-400.
15. Medeiros FA, Zangwill LM, Bowd C, et al. Evaluation of retinal nerve fiber layer, optic nerve head, and macular thickness measurements for glaucoma detection using opti-
cal coherence tomography. Am J Ophthalmol 2005;139:44- 55.
16. Mwanza JC, Oakley JD, Budenz DL, et al. Ability of cirrus HD-OCT optic nerve head parameters to discriminate nor- mal from glaucomatous eyes. Ophthalmology 2011;118:241- 8.e1.
17. Mwanza JC, Durbin MK, Budenz DL, et al. Glaucoma di- agnostic accuracy of ganglion cell-inner plexiform layer thickness: comparison with nerve fiber layer and optic nerve head. Ophthalmology 2012;119:1151-8.
18. Shin HJ, Cho BJ. Comparison of retinal nerve fiber layer thickness between Stratus and Spectralis OCT. Korean J Ophthalmol 2011;25:166-73.
19. Wollstein G, Schuman JS, Price LL, et al. Optical coher- ence tomography longitudinal evaluation of retinal nerve fiber layer thickness in glaucoma. Arch Ophthalmol 2005;
123:464-70.
20. Yuksel N, Altintas O, Ozkan B, et al. Discriminating abili- ty of optical coherence tomography data in staging glauco- matous damage. Can J Ophthalmol 2009;44:297-307.
21. Uchida H, Brigatti L, Caprioli J. Detection of structural damage from glaucoma with confocal laser image analysis.
Invest Ophthalmol Vis Sci 1996;37:2393-401.
22. Wollstein G, Ishikawa H, Wang J, et al. Comparison of three optical coherence tomography scanning areas for de- tection of glaucomatous damage. Am J Ophthalmol 2005;
139:39-43.