ISSN 2234-3806 • eISSN 2234-3814
https://doi.org/10.3343/alm.2018.38.3.204
Prognostic Role of High-sensitivity Cardiac Troponin I and Soluble Suppression of Tumorigenicity-2 in
Surgical Intensive Care Unit Patients Undergoing Non-cardiac Surgery
Hyun Suk Yang, M.D.1, Mina Hur, M.D.2, Ahram Yi, M.D.2, Hanah Kim, M.D.2, and Jayoun Kim, Ph.D.3
Departments of Cardiovascular Medicine1 and Laboratory Medicine2, Konkuk University School of Medicine, Seoul; Research Coordinating Center3, Konkuk University Medical Center, Seoul, Korea
Background: The prognostic utility of cardiac biomarkers, high-sensitivity cardiac troponin I (hs-cTnI) and soluble suppression of tumorigenicity-2 (sST2), in non-cardiac surgery is not well-defined. We evaluated hs-cTnI and sST2 as predictors of 30-day major adverse cardiac events (MACE) in patients admitted to the surgical intensive care unit (SICU) fol- lowing major non-cardiac surgery.
Methods: hs-cTnI and sST2 concentrations were measured in 175 SICU patients immedi- ately following surgery and for three days postoperatively. The results were analyzed in re- lation to 30-day MACE and were compared with the revised Goldman cardiac risk index (RCRI) score.
Results: Overall, 30-day MACE was observed in 16 (9.1%) patients. hs-cTnI and sST2 concentrations differed significantly between the two groups with and without 30-day MACE (P <0.05). The maximum concentration of sST2 was an independent predictor of 30-day MACE (odds ratio=1.016, P =0.008). The optimal cut-off values of hs-cTnI and sST2 for predicting 30-day MACE were 53.0 ng/L and 182.5 ng/mL, respectively. A com- bination of hs-cTnI and sST2 predicted 30-day MACE better than the RCRI score. More- over, 30-day MACE was observed more frequently with increasing numbers of above-opti- mal cut-off hs-cTnI and sST2 values (P <0.0001). Reclassification analyses indicated that the addition of biomarkers to RCRI scores improved the prediction of 30-day MACE.
Conclusions: This study demonstrates the utility of hs-cTnI and sST2 in predicting 30-day MACE following non-cardiac surgery. Cardiac biomarkers would provide enhanced risk stratification in addition to clinical RCRI scores for patients undergoing major non-cardiac surgery.
Key Words: High-sensitivity cardiac troponin I, Soluble suppression of tumorigenicity-2, Non-cardiac surgery, Prognosis
Received: September 23, 2017 Revision received: November 29, 2017 Accepted: December 26, 2017 Corresponding author: Mina Hur Department of Laboratory Medicine, Konkuk University School of Medicine, Konkuk University Medical Center, 120-1 Neungdong-ro, Hwayang-dong, Gwangjin-gu, Seoul 05030, Korea Tel: +82-2-2030-5581
Fax: +82-2-2636-6764 E-mail: [email protected]
© Korean Society for Laboratory Medicine This is an Open Access article distributed under the terms of the Creative Commons Attribution Non-Commercial License (http://creativecom- mons.org/licenses/by-nc/4.0) which permits unrestricted non-commercial use, distribution, and reproduction in any medium, provided the original work is properly cited.
INTRODUCTION
The term “major adverse cardiac events” (MACE) refers to a composite of clinical events; although MACE lacks a standard
definition, it is commonly used to evaluate procedural, short- term, or long-term clinical outcomes [1, 2]. The incidence of 30-day MACE in non-cardiac surgery has been reported to be approximately 10% following major surgery [3]; the risk depends
2017-03-16 https://crossmark-cdn.crossref.org/widget/v2.0/logos/CROSSMARK_Color_square.svg
https://doi.org/10.3343/alm.2018.38.3.204 www.annlabmed.org 205 on patient- and surgery-specific characteristics. Conventional
perioperative risk estimation models, such as the revised Gold- man cardiac risk index (RCRI), have been applied for patients scheduled to undergo non-cardiac surgery; further cardiac-spe- cific testing, such as echocardiography, stress testing, and car- diac biomarkers, is reserved for patients with known or suspected heart diseases [4-7]. However, risk estimation models remain quite limited in predicting perioperative deaths, and up to half of cardiac deaths occur in patients without prior known heart dis- eases [8].
Myocardial injury after non-cardiac surgery (MINS), a compo- nent of MACE, is defined as troponin T levels of ≥0.04 ng/mL;
its reported incidence is approximately 8% [9]. One in 10 MINS patients die within 30 days; without troponin monitoring, >80%
of MINS events would be missed [9]. The incidence of MINS in vascular surgery patients is 19.1%, and MINS is independently associated with 30-day mortality [10]. The potential role of bio- marker monitoring has been examined; the peak troponin T value during the first three days post-surgery is associated with 30- day mortality [11], and elevated postoperative troponin T with- out an ischemic feature is also associated with 30-day mortality [12]. The use of a high-sensitivity troponin T assay has been re- ported to increase the perioperative myocardial infarction (MI) detection rate [13]; however, until quite recently, it has been un- certain whether high-sensitivity cardiac troponin I (hs-cTnI) has better predictive power for 30-day morbidity or mortality.
Soluble suppression of tumorigenicity-2 (sST2), a novel bio- marker, has demonstrated strong prognostic value in patients with heart failure (HF) [14, 15], acute coronary syndrome [16, 17], chronic hemodialysis [18], and sepsis [19]; however, the prognostic role of sST2 in patients undergoing non-cardiac sur- gery is unknown.
The purpose of this study was to explore the association be- tween the hs-cTnI and sST2 concentrations and 30-day MACE in patients undergoing major non-cardiac surgery. We examined whether the use of hs-cTnI and sST2 could predict 30-day MACE better than clinical assessment using the RCRI score in these pa- tients. We hypothesized that a cardiac biomarker-based approach would have additive value on top of RCRI score-based clinical judgement. The novelty of this study is that combined hs-cTnI and sST2 analysis was performed for predicting 30-day MACE.
METHODS
1. Study populationThis prospective study was approved by the Institutional Review
Board of Konkuk University Medical Center, Seoul, Korea, and was conducted in compliance with the World Medical Associa- tion Declaration of Helsinki regarding ethical conduct of research involving human subjects. From June 2014 to May 2015, 1,140 patients underwent major surgery under general anesthesia and were admitted to the surgical intensive care unit (SICU) postop- eratively. Of these, we excluded patients younger than 45 years (N =451) [9], patients undergoing cardiac surgery (N =298), and/or patients who did not provide informed consent preopera- tively (N=145). In addition, we excluded 71 patients who could not undergo biomarker testing on the day of surgery, immediately postoperatively (D0), or on the following three postoperative days (D1, D2, and D3). A total of 175 patients (age 66 ±12 years, range 45–92 years; 90 males) were enrolled in this study, and their baseline characteristics are detailed in Table 1. Although there is no standard definition of MACE, we monitored 30-day MACE, including death, non-fatal cardiac arrest, MI, and acute decompensated HF [2]. We compared the serial changes in the biomarkers in patients with or without such events.
2. Assays
hs-cTnI and sST2 concentrations were measured according to the manufacturers’ instructions. The blood samples were ob- tained by venipuncture into serum-separating tubes (Greiner Bio-One GmbH, Frickenhausen, Germany) and were delivered to the laboratory without delay; the sera were separated promptly from whole blood and were stored at –70°C in small aliquots un- til analysis of each biomarker.
hs-cTnI concentration was measured using the ARCHITECT STAT High Sensitive Troponin-I chemiluminescence immunoas- say on an i2000 analyzer (Abbott diagnostics, Abbott Park, IL, USA). sST2 concentration was measured using the Presage ST2 Assay (Critical Diagnostics, San Diego, CA, USA), which is an enzyme-linked immunosorbent assay comprising a ready-to-use 96-well microtiter plate coated with mouse monoclonal anti-hu- man sST2 antibodies and measured using spectrophotometric absorbance at 450 nm with a microtiter well reader [20]. sST2 concentrations were measured in duplicate and the average value of the two measurements was used for statistical analysis.
The manufacturer-claimed measurable range of the hs-cTnI as- say was 1.0–50,000 ng/L; this assay was designed to have within- laboratory (total) imprecision of 10% coefficient of variation (CV) with controls or panels across this range. The manufacturer-claimed measurable range of the sST2 assays was 3.1–250 ng/mL. The CV (%) of each assay was determined in our laboratory accord- ing to the Clinical and Laboratory Standards Institute (CLSI) doc-
ument EP15-A2 [21]. The CVs were tested at two levels by run- ning three replicates over five days; the actual CV (%) of the hs- cTnI and sST2 assays were <4.0% and <3.0%, respectively.
3. Statistical analysis
Continuous variables were expressed as mean (standard devia- tion) or median (interquartile range, IQR) depending on data distribution. Normality was tested using Kolmogorov-Smirnov nonparametric tests, and sphericity was tested using Mauchly’s test. The Mann-Whitney U test was used to compare values be- tween the two groups with or without 30-day MACE. Univariate and multivariate logistic regression analyses were used to iden- tify predictors of 30-day MACE; variables included age, sex, pa- tient factors in the conventional risk prediction model (RCRI), and biomarkers (hs-cTnI and sST2). With regard to biomarkers, maximum values from the serial measurement (D0 to D3) were used for logistic regression analyses. Odds ratio (OR) was re- ported with 95% confidence interval (CI). The receiver operating characteristic (ROC) curves of each biomarker and RCRI score were compared to obtain optimal cut-off values for predicting 30-day MACE. Areas under the curves (AUC) were reported with their 95% CI and were assessed as follows: 0.5–0.6, fail;
0.6–0.7, poor; 0.7–0.8, fair; 0.8–0.9, good; 0.9–1.0, excellent.
Using the optimal cut-off values obtained from the ROC curve, hs-cTnI and sST2 concentrations were dichotomized (above and below the cut-off values) to compare the proportion of 30- day MACE according to the number of above cut-off values for hs-cTnI and sST2 (0, 1, and 2); the chi-square test was used to compare this proportion. Using the dichotomized variables, the ROC curves of RCRI score, combined biomarkers, and the com- bination of RCRI score and biomarkers were re-analyzed, and their AUC were compared for prognostic utility [22]. Reclassifi- cation analyses using net reclassification improvement (NRI) and integrated discrimination improvement (IDI) were used to assess the added value of the biomarker approach on top of RCRI score; NRI and IDI values were analyzed with their 95%
CI. Maximum values of hs-cTnI and sST2 throughout D0–D3 were used as variables for logistic regression, ROC curve, and reclassification analyses [9].
IBM SPSS Statistics (version 22, Armonk, NY, USA), MedCalc Software (version 17.9, MedCalc Software, Mariakerke, Belgium), and R Statistics (version 3.3.1, The R Foundation for Statistical Computing, Vienna, Austria) were used for statistical analyses.
P values<0.05 were considered statistically significant.
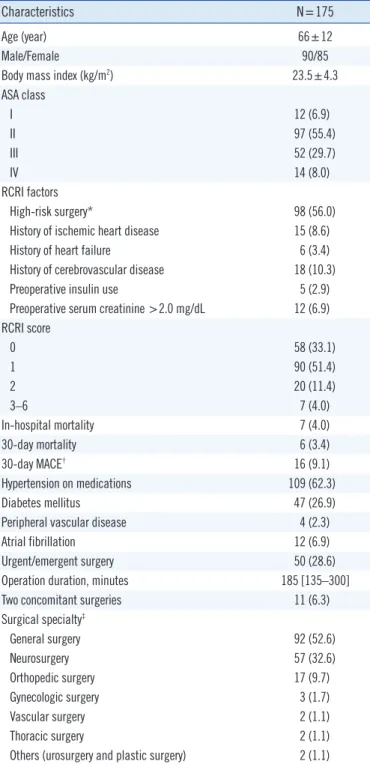
Table 1. Characteristics of the study population
Characteristics N=175
Age (year) 66±12
Male/Female 90/85
Body mass index (kg/m2) 23.5±4.3
ASA class
I 12 (6.9)
II 97 (55.4)
III 52 (29.7)
IV 14 (8.0)
RCRI factors
High-risk surgery* 98 (56.0)
History of ischemic heart disease 15 (8.6)
History of heart failure 6 (3.4)
History of cerebrovascular disease 18 (10.3)
Preoperative insulin use 5 (2.9)
Preoperative serum creatinine >2.0 mg/dL 12 (6.9) RCRI score
0 58 (33.1)
1 90 (51.4)
2 20 (11.4)
3–6 7 (4.0)
In-hospital mortality 7 (4.0)
30-day mortality 6 (3.4)
30-day MACE† 16 (9.1)
Hypertension on medications 109 (62.3)
Diabetes mellitus 47 (26.9)
Peripheral vascular disease 4 (2.3)
Atrial fibrillation 12 (6.9)
Urgent/emergent surgery 50 (28.6)
Operation duration, minutes 185 [135–300]
Two concomitant surgeries 11 (6.3)
Surgical specialty‡
General surgery 92 (52.6)
Neurosurgery 57 (32.6)
Orthopedic surgery 17 (9.7)
Gynecologic surgery 3 (1.7)
Vascular surgery 2 (1.1)
Thoracic surgery 2 (1.1)
Others (urosurgery and plastic surgery) 2 (1.1) Data are presented as mean±standard deviation, median [interquartile range], or number (%).
*Examples include vascular surgery and any open intraperitoneal or intra- thoracic procedures; †A total of 22 MACE events were observed in 16 pa- tients: death (N=6), non-fatal cardiac arrest (N=2), MI (N=5), and acute decompensated HF (N=9). Five patients had two or three MACE: MI and acute decompensated HF in one patient; MI, acute decompensated HF, and cardiac death in one patient; and acute decompensated HF and death in three patients; ‡In cases with multi-department surgeries, the major sur- gery was considered.
Abbreviations: ASA, American Society of Anesthesiologists physical status classification; RCRI, revised Goldman cardiac risk index; MACE, major ad- verse cardiac events; MI, myocardial infarction; HF, heart failure.
https://doi.org/10.3343/alm.2018.38.3.204 www.annlabmed.org 207
RESULTS
During the 30-day postoperative period, myocardial ischemia was suspected in 26 patients because of chest pain only (N=2) or electrocardiographic ST-T segment changes with or without
coronary angiography (N=24). Coronary angiography was per- formed for eight of these patients, proving acute coronary syn- drome with significant stenosis in five patients. The primary out- come of 30-day MACE was 22 events observed in 16 patients (9%): death (N=6), non-fatal cardiac arrest (N=2), MI (N=5),
Table 2. Distribution of biomarkers between the two groups with or without 30-day major adverse cardiac events
Total (N=175) 30-day MACE (+) (N=16) 30-day MACE (-) (N=159) P*
hs-cTnI, ng/L
POD 0 7.8 [3.0–20.6] 20.0 [6.0–151.7] 7.3 [3.0–19.9] 0.009
POD 1 10.4 [4.8–25.8] 52.4 [16.2–292.0] 9.9 [4.7–22.4] 0.001
POD 2 11.2 [5.0–30.3] 92.1 [17.8–310.9] 10.0 [4.8–28.6] <0.001
POD 3 9.8 [4.5–29.5] 81.0 [19.3–286.5] 8.4 [4.0–20.0] <0.001
POD1–POD0 1.60 [–0.40–6.50] 11.9 [0.75–141.4] 1.30 [–0.60–5.30] 0.003
POD2–POD0 1.80 [–0.90–10.30] 30.8 [0.50–244.4] 1.60 [–1.20–9.10] 0.005
POD3–POD0 0.90 [–1.40–7.20] 44.0 [1.18–276.4] 0.60 [–1.40–5.40] 0.005
sST2, ng/mL
POD 0 45.9 [29.0–107.0] 72.5 [42.2–210.8] 43.0 [29.0–102.0] 0.046
POD 1 155.0 [84.0–219.0] 188.8 [158.2–225.8] 144.0 [79.0–217.0] 0.058
POD 2 79.0 [50.0–158.0] 178.7 [107.3–229.3] 73.0 [46.0–140.0] <0.001
POD 3 59.5 [33.8–99.3] 118.0 [85.0–252.0] 52.0 [32.8–88.0] <0.001
POD1–POD0 68.0 [21.0–139.0] 102.4 [–7.8–145.5] 65.0 [21.0–137.0] 0.548
POD2–POD0 21.0 [0.0–65.0] 65.5 [–8.75–135.5] 20.7 [0.0–54.0] 0.165
POD3–POD0 1.0 [–18.0–17.8] 27.0 [–14.0–153.1] 0.0 [–20.0–15.0] 0.029
All data are presented as median and interquartile range.
*30-day MACE (+) vs 30-day MACE (–).
Abbreviations: MACE, major adverse cardiac events; hs-cTnI, high-sensitivity cardiac troponin I; sST2, soluble suppression of tumorigenicity-2; POD, post- operative day.
Table 3. Univariate and multivariate logistic regression analyses for 30-day major adverse cardiac events
Univariate Multivariate
OR (95% CI) P OR (95% CI) P
Age 1.037 (0.991–1.086) 0.116
Female 1.065 (0.381–2.977) 0.905
High-risk surgery 3.100 (1.029–9.343) 0.044 7.152 (0.807–63.420) 0.077
History of ischemic heart disease 6.773 (1.968–23.308) 0.002 11.735 (0.741–185.822) 0.081
History of heart failure 26.127 (4.343–157.670) <0.001 14.609 (0.885–241.139) 0.061
History of cerebrovascular disease 5.105 (1.538–16.944) 0.008 5.006 (0.356–70.422) 0.232
Diabetes on insulin 2.583 (0.271–24.620) 0.409
Serum creatinine >2.0 mg/dL 3.846 (0.926–15.976) 0.064
RCRI score 2.052 (1.212–3.476) 0.008 0.658 (0.127–3.395) 0.617
hs-cTnI, maximum (ng/L) 1.001 (1.001–1.001) 0.032 1.001 (1.001–1.001) 0.029
sST2, maximum (ng/mL) 1.011 (1.003–1.018) 0.004 1.016 (1.004–1.028) 0.008
Abbreviations: RCRI, revised Goldman cardiac risk index; hs-cTnI, high-sensitivity cardiac troponin I; sST2, soluble suppression of tumorigenicity-2; OR, odds ratio; CI, confidence interval.
and acute decompensated HF (N=9). Five patients had two or three MACE: MI and acute decompensated HF in one patient;
MI, acute decompensated HF, and cardiac death in one patient, and acute decompensated HF and death in three patients. Time- to-first MACE ranged from D1 to D22 postoperatively (median D3). The RCRI scores were: 0 (N=3); 1 (N=5); 2 (N=6); and 3 (N=2).
Table 2 shows the distribution of hs-cTnI and sST2 in patients with or without 30-day MACE. The concentrations of hs-cTnI and sST2 were significantly higher in patients with 30-day MACE than in patients without such events (all P <0.05), except for the D1 sST2 concentration (P =0.058). The hs-cTnI concentration was elevated in D1 and D2 compared with D0 (10.4 and 11.2 vs 7.8 ng/L; all P <0.05). The sST2 concentration was markedly elevated in D1 compared with D0, D2, and D3 (155.0 vs 45.9, 79.0, and 59.5 ng/mL, all P <0.05). The median values (IQR) of the maximum hs-cTnI and sST2 concentrations in 175 patients
Fig. 1. Receiver operator characteristic curve analyses for the pre- diction of 30-day MACE in patients following major non-cardiac sur- geries. The optimal cut-off value of hs-cTnI (max) for prediction of 30-day MACE was 53.0 ng/L (sensitivity, 68.8% [95% CI, 41.3–
89.0%]; specificity, 78.6% [95% CI, 71.4–84.7%]) and that of sST2 (max) was 182.5 ng/mL (sensitivity, 87.5% [95% CI, 61.7–
98.5%]; specificity, 56.6% [95% CI, 48.5–64.4%]). hs-cTnI (max) and sST2 (max) demonstrated fair predictive ability for 30-day MACE compared with the poor ability of RCRI score, although there was no statistical difference between the AUCs.
Abbreviations: MACE, major adverse cardiac events; CI, confidence interval;
RCRI, revised Goldman cardiac risk index; hs-cTnI, high-sensitivity cardiac troponin I; sST2, soluble suppression of tumorigenicity-2; AUC, area under the curve.
Fig. 1. Receiver operator characteristic curve analyses for the prediction of 30-day MACE in patients following major non-cardiac surgeries. The optimal cut-off value of hs-cTnI (max) for prediction of 30-day MACE was 53.0 ng/L (sensitivity, 68.8% [95% CI, 41.3% –89.0%];
specificity, 78.6% [95% CI, 71.4% –84.7%]) and that of sST2 (max) was 182.5 ng/mL (sensitivity, 87.5% [95% CI, 61.7% –98.5%]; specificity, 56.6% [95% CI, 48.5% –64.4%]).
hs-cTnI (max) and sST2 (max) demonstrated fair predictive ability for 30-day MACE compared with the poor ability of RCRI score, although there was no statistical difference between the AUCs.
1 - Specificity
0.0 0.2 0.4 0.6 0.8 1.0
Sensitivity
0.0 0.2 0.4 0.6 0.8 1.0
RCRIhs-cTnI sST2
Fig. 1. Receiver operator characteristic curve analyses for the prediction of 30-day MACE in patients following major non-cardiac surgeries. The optimal cut-off value of hs-cTnI (max) for prediction of 30-day MACE was 53.0 ng/L (sensitivity, 68.8% [95% CI, 41.3% –89.0%];
specificity, 78.6% [95% CI, 71.4% –84.7%]) and that of sST2 (max) was 182.5 ng/mL (sensitivity, 87.5% [95% CI, 61.7% –98.5%]; specificity, 56.6% [95% CI, 48.5% –64.4%]).
hs-cTnI (max) and sST2 (max) demonstrated fair predictive ability for 30-day MACE compared with the poor ability of RCRI score, although there was no statistical difference
1 - Specificity
0.0 0.2 0.4 0.6 0.8 1.0
Sensitivity
0.0 0.2 0.4 0.6 0.8 1.0
RCRIhs-cTnI sST2
1.0
0.8
0.6
0.4
0.2
0
0 0.2 0.4 0.6 0.8 1.0 1-Specificity
Sensitivity
RCRI vs hs-cTnI, P =0.403 RCRI vs sST2, P =0.738 hs-cTnI vs sST2, P =0.541 RCRI
hs-cTnI sST2
Fig. 2. Thirty-day MACE according to the number of hs-cTnI and sST2 above cut-off values (53.0 ng/L and 182.5 ng/mL, respective- ly). (A) Overall, 30-day MACE was observed more frequently as the number of above cut-off values increased (P <0.001). (B) This find- ing was also observed in 148 patients with an RCRI score of 0 or 1 (P <0.001).
Abbreviations: MACE, major adverse cardiac events; CI, confidence interval;
RCRI, revised Goldman cardiac risk index; hs-cTnI, high-sensitivity cardiac troponin I; sST2, soluble suppression of tumorigenicity-2; AUC, area under the curve.
100 90 80 70 60 50 40 30 20 10
0 + –
Both markers below cutoffs
(N=80)
+ – Any marker above cutoff
(N=62)
+ – Both markers above cutoffs
(N=33)
P <0.001 (Chi-square test)
Proportion (%)
RCRI total (N=175) A
1.3 98.7
8.1 91.9
30.3 69.7
30-day MACE Positive Negative
100 90 80 70 60 50 40 30 20 10
0 + –
Both markers below cutoffs
(N=73)
+ – Any marker above cutoff
(N=54)
+ – Both markers above cutoffs
(N=21)
P <0.001 (Chi-square test)
Proportion (%)
RCRI score 0 or 1 (N=148) B
0 100
5.6 94.4
23.8 76.2
30-day MACE Positive Negative
were 15.60 ng/L (7.50–55.20) and 174.0 ng/mL (98.0–233.0), respectively.
Logistic regression analyses demonstrated that the maximum concentrations of hs-cTnI and sST2 were two independent pre- dictors of 30-day MACE (Table 3). ROC curve analyses showed
https://doi.org/10.3343/alm.2018.38.3.204 www.annlabmed.org 209 that the optimal cut-off values of hs-cTnI and sST2 for predic-
tion of 30-day MACE were 53.0 ng/L and 182.5 ng/mL, respec- tively. hs-cTnI (max) and sST2 (max) showed fair predictive abil- ity for 30-day MACE (AUC=0.780 and 0.725, respectively) com- pared with the poor predictive ability of RCRI score (AUC=0.693);
however, there was no statistical difference between the AUCs (Fig. 1). Combination of hs-cTnI (max) and sST2 (max) predicted 30-day MACE better than RCRI score (AUC, 0.807 vs 0.693);
combination of RCRI, hs-cTnI (max), and sST2 (max) showed the highest AUC (0.843). The poor predictive ability of RCRI score improved to good predictive ability, although there was no statis- tical difference between the AUCs.
A combined approach using below/above cut-off values of hs- cTnI and sST2 demonstrated differences in terms of predicting 30-day MACE (P <0.001). The proportion of 30-day MACE dem- onstrated a stepwise increase: 1.3% in group 0; 8.1% in group 1; and 30.3% in group 2 (Fig. 2A). Interestingly, this difference was also observed in 148 patients with an RCRI score of 0 or 1 (P <0.001) (Fig. 2B). Reclassification analyses demonstrated that addition of hs-cTnI and sST2 on top of RCRI score increased the prediction of 30-day MACE compared with RCRI score alone (Table 4).
DISCUSSION
The novelty of this study is that combined analysis of hs-cTnI and sST2 was performed in non-cardiac surgery patients to pre- dict 30-day MACE. hs-cTnI and sST2 concentrations constituted independent predictors of 30-day MACE in patients admitted to the SICU following non-cardiac surgery; the optimal cut-off val- ues of hs-cTnI and sST2 were 53.0 ng/L and 182.5 ng/mL, re- spectively (Table 3 and Fig. 1). sST2 is produced by both cardiac fibroblasts and cardiomyocytes in response to injury or stress, but non-myocardial production also occurs [23]; its prognostic utility has been observed in various clinical scenarios [14, 16, 19]. Of note, the present study has added another clinical sce-
nario that could be predicted by sST2 measurement.
In contrast to most previous studies that used conventional cardiac troponin assays [9, 11, 24, 25], we used the hs-cTnI assay [26]. Until date, there is no generally accepted optimal cut-off value for post-operative hs-cTnI concentrations either for MINS diagnosis or for prognosis prediction of 30-day MACE. Based on our data, a peak hs-cTnI concentration of 53.0 ng/L could be used as an optimal cut-off value to predict 30-day MACE.
The incidence of adverse outcomes related to non-cardiac surgery depends on the baseline risk. Among unselective pa- tients older than 40 years, perioperative cardiac events were re- ported in 2.5% of cases [27]; using the RCRI model, in-hospital mortality increased from 1.4 to 7.4% [28]. Monitoring biomark- ers could uncover silent ischemia identifying MINS in approxi- mately 8% of patients, at least 45 years old, undergoing non- cardiac surgery [9]. The age of the enrolled patients in the pres- ent study was similar to that study; however, our study popula- tion was more selective, including only patients admitted to the SICU following major non-cardiac surgery and is thus predicted to have a higher incidence of adverse outcomes [9].
Utilization of perioperative biomarkers has been evolving in order to improve risk stratification in patients undergoing non- cardiac surgery. According to the 2014 European Society of Car- diology guidelines, cardiac troponins (T and I) should be con- sidered in high-risk patients, both prior to and 48–72 hours post major surgery, in addition to N-terminal pro B-type natriuretic peptide (NT-proBNP) and BNP (Class IIb) [19]. Thus far, both troponin and natriuretic peptide assays have been chosen based on different mechanisms of ischemic injury and endocrine car- diac response to stress. Troponin T values of at least 0.02 ng/
mL have been reported in 11.6% of patients with overnight ad- mission and were associated with higher 30-day mortality [11];
preoperative NT-proBNP ≥725 pg/mL has been associated with a 4.8-fold relative risk of adverse outcomes in patients over 50 years of age with emergent non-cardiac surgery [29]. Postoper- ative surveillance has been emphasized in addition to preopera- Table 4. Reclassification analyses using integrated discrimination improvement and net reclassification improvement
AUC (95% CI) P IDI NRI
Estimated value (95% CI) P Estimated value (95% CI) P
RCRI 0.693 (0.539–0.846) 0.011 - - - -
RCRI + hs-cTnI, max 0.792 (0.669–0.915) <0.001 0.041 (–0.004–0.118) 0.080 0.381 (–0.088–0.623) 0.173
RCRI + sST2 0.782 (0.665–0.899) <0.001 0.04 (0.006–0.128) 0.007 0.285 (0.021–0.495) 0.020
RCRI + sST2 + hs-cTnI, max 0.843 (0.756–0.930) <0.001 0.061 (0.017–0.134) <0.001 0.366 (0.020–0.555) 0.033 Abbreviations: RCRI, revised Goldman cardiac risk index; hs-cTnI, high-sensitivity cardiac troponin I; sST2, soluble suppression of tumorigenicity-2; IDI, inte- grated discrimination improvement; NRI, net reclassification improvement; AUC, area under the curve; CI, confidence interval.
tive basal state, because it indicates ongoing cardiac ischemia or whole neuroendocrine responses related to surgical stress [9, 11, 24]. Despite these supporting studies [9, 11, 24, 28, 30], perioperative routine biomarker testing is not generally recom- mended (Class III) [6]. The present study suggests that a bio- marker approach using hs-cTnI and sST2 may aid in prognosis prediction in patients following non-cardiac surgery. Our results are novel with respect to the combined use of a biomarker ap- proach and clinical assessment using RCRI score; adding bio- markers to RCRI score improved the prediction of 30-day MACE compared with clinical assessment alone (Fig. 2 and Table 4).
sST2 is increased by systemic inflammation, which is a promi- nent element following non-cardiac surgery, whereas hs-cTnI is specific for cardiac damage; therefore, the two biomarkers re- flect different disease mechanisms, and it is possible that their prognostic value is additive.
This study has several limitations. First, we measured the se- rial changes of biomarkers from D0 to D3, without measuring the preoperative basal levels of the biomarkers. Further elucida- tion of the changes in biomarker levels would have been possi- ble by measuring basal levels. Second, the blood samples were collected every morning, according to routine practice in the SICU, without maintaining a strict 24-hour interval for blood sam- pling. Third, a fundamental concern is how to interpret and man- age the elevated biomarkers during the 72-hour postoperative period. Morning sampling is routine in clinical practice, and this type of monitoring (over 72 hours) may be sufficient to capture peak levels; thus, we could provide fundamental data regarding serial changes in hs-cTnI and sST2 postoperatively. However, the median time-to-first MACE was three days (ranged from D1 to D22) postoperatively during ongoing biomarker sampling; this would limit the clinical utility of biomarker assessment for prog- nostic stratification. This single-center study involving a limited study population should be further validated by additional stud- ies in order to obtain a better understanding of the detailed im- plications of biomarker guidance for postoperative patient man- agement following major non-cardiac surgery.
In conclusion, this study demonstrated the prognostic role of hs-cTnI and sST2 in predicting 30-day MACE in patients admit- ted to the SICU following major non-cardiac surgery. The car- diac biomarker approach combining hs-cTnI and sST2 showed superior prognostic performance compared with clinical assess- ment using RCRI score, and addition of biomarkers to clinical assessment further improved prognostic efficacy. The cardiac biomarker approach could constitute an objective and reliable tool for prognosis prediction in patients undergoing major non-
cardiac surgery.
Authors’ Disclosures of Potential Conflicts of Interest
No potential conflicts of interest relevant to this study are reported.
REFERENCES
1. McCarthy CP, van Kimmenade RRJ, Gaggin HK, Simon ML, Ibrahim NE, Gandhi P, et al. Usefulness of multiple biomarkers for predicting in- cident major adverse cardiac events in patients who underwent diag- nostic coronary angiography (from the Catheter Sampled Blood Archive in Cardiovascular Disease [CASABLANCA] Study). Am J Cardiol 2017;
120:25-32.
2. Kip KE, Hollabaugh K, Marroquin OC, Williams DO. The problem with composite end points in cardiovsacular studies. J Am Coll Cardiol 2008;
51:701-7.
3. Khuri SF, Daley J, Henderson W, Hur K, Demakis J, Aust JB, et al. The Department of Veterans Affairs’ NSQIP: the first national, validated, out- come-based, risk-adjusted, and peer-controlled program for the mea- surement and enhancement of the quality of surgical care. National VA Surgical Quality Improvement Program. Ann Surg 1998;228:491-507.
4. Lee TH, Marcantonio ER, Mangione CM, Thomas EJ, Polanczyk CA, Cook EF, et al. Derivation and prospective validation of a simple index for prediction of cardiac risk of major noncardiac surgery. Circulation 1999;100:1043-9.
5. Devereaux PJ, Goldman L, Cook DJ, Gilbert K, Leslie K, Guyatt GH. Peri- operative cardiac events in patients undergoing noncardiac surgery: a review of the magnitude of the problem, the pathophysiology of the events and methods to estimate and communicate risk. CMAJ 2005;173:627- 34.
6. Kristensen SD, Knuuti J, Saraste A, Anker S, Bøtker HE, Hert SD, et al.
2014 ESC/ESA Guidelines on non-cardiac surgery: cardiovascular as- sessment and management: The Joint Task Force on non-cardiac sur- gery: cardiovascular assessment and management of the European So- ciety of Cardiology (ESC) and the European Society of Anaesthesiology (ESA). Eur Heart J 2014;35:2383-431.
7. Fleisher LA, Fleischmann KE, Auerbach AD, Barnason SA, Beckman JA, Bozkurt B, et al. 2014 ACC/AHA guideline on perioperative cardio- vascular evaluation and management of patients undergoing noncardi- ac surgery: a report of the American College of Cardiology/American Heart Association Task Force on practice guidelines. J Am Coll Cardiol 2014;64:e77-137.
8. Ford MK, Beattie WS, Wijeysundera DN. Systematic review: prediction of perioperative cardiac complications and mortality by the revised car- diac risk index. Ann Intern Med 2010;152:26-35.
9. Botto F, Alonso-Coello P, Chan MT, Villar JC, Xavier D, Srinathan S, et al.
Myocardial injury after noncardiac surgery: a large, international, pro- spective cohort study establishing diagnostic criteria, characteristics, predictors, and 30-day outcomes. Anesthesiology 2014;120:564-78.
10. Biccard BM, Scott DJA, Chan MTV, Archbold A, Wang CY, Sigamani A, et al. Myocardial injury after noncardiac surgery (MINS) in vascular sur- gical patients: a prospective observational cohort study. Ann Surg May 8. doi: 10.1097/SLA.0000000000002290. [Epub ahead of print].
11. Vascular Events in Noncardiac Surgery Patients Cohort Evaluation (VI- SION) Study Investigators, Devereaux PJ, Chan MT, Alonso-Coello P,
https://doi.org/10.3343/alm.2018.38.3.204 www.annlabmed.org 211
Walsh M, Berwanger O, et al. Association between postoperative tropo- nin levels and 30-day mortality among patients undergoing noncardiac surgery. JAMA 2012;307:2295-304.
12. Writing Committee for the VISION Study Investigators, Devereaux PJ, Biccard BM, Sigamani A, Xavier D, Chan MTV, et al. Association of post- operative high-sensitivity troponin levels with myocardial injury and 30- day mortality among patients undergoing noncardiac surgery. JAMA 2017;317:1642-51.
13. Brown JC, Samaha E, Rao S, Helwani MA, Duma A, Brown F, et al. High- sensitivity cardiac Troponin T improves the diagnosis of perioperative MI. Anesth Analg 2017;125:1455-62.
14. Aimo A, Vergaro G, Passino C, Ripoli A, Ky B, Miller WL, et al. Prognos- tic value of soluble suppression of tumorigenicity-2 in chronic heart fail- ure: a meta-analysis. JACC Heart Fail 2017;5:280-6.
15. Yang HS, Kim HJ, Shim HJ, Kim SJ, Hur M, Di Somma S, et al. Soluble ST2 and troponin I combination: useful biomarker for predicting devel- opment of stress cardiomyopathy in patients admitted to the medical intensive care unit. Heart Lung 2015;44:282-8.
16. Barbarash O, Gruzdeva O, Uchasova E, Dyleva Y, Belik E, Akbasheva O, et al. Prognostic value of soluble ST2 during hospitalization for ST-seg- ment elevation myocardial infarction. Ann Lab Med 2016;36:313-9.
17. Marino R, Magrini L, Orsini F, Russo V, Cardelli P, Salerno G, et al. Com- parison between soluble ST2 and high-sensitivity Troponin I in predict- ing short-term mortality for patients presenting to the emergency de- partment with chest pain. Ann Lab Med 2017;37:137-46.
18. Obokata M, Sunaga H, Ishida H, Ito K, Ogawa T, Ando Y, et al. Indepen- dent and incremental prognostic value of novel cardiac biomarkers in chronic hemodialysis patients. Am Heart J 2016;179:29-41.
19. Hur M, Kim H, Kim HJ, Yang HS, Magrini L, Marino R, et al. Soluble ST2 has a prognostic role in patients with suspected sepsis. Ann Lab Med 2015;35:570-7.
20. Mueller T and Dieplinger B. The Presage® ST2 Assay: analytical consid-
erations and clinical applications for a high-sensitivity assay for measure- ment of soluble ST2. Expert Rev Mol Diagn 2013;13:13-30.
21. CLSI. User verification of performance for precision and true. 2nd ed.
CLSI document EP15-A2. Wayne, PA, USA: Clinical and Laboratort Stan- dards Institute, 2005.
22. DeLong ER, DeLong DM, Clarke-Pearson DL. Comparing the areas un- der two or more correlated receiver operating characteristic curves: a nonparametric approach. Biometrics 1988;44:837-45.
23. Pascual-Figal DA and Januzzi JL. The biology of ST2: the International ST2 Consensus Panel. Am J Cardiol 2015;115(S7):3B-7B.
24. Torborg A, Ryan L, Kantor G, Biccard BM. The pharmacoeconomics of routine postoperative troponin surveillance to prevent and treat myocar- dial infarction after non-cardiac surgery. S Afr Med J 2014;104:619-23.
25. van Waes JA, Nathoe HM, de Graaff JC, Kemperman H, de Borst GJ, Peelen LM, et al. Myocardial injury after noncardiac surgery and its as- sociation with short-term mortality. Circulation 2013;127:2264-71.
26. Apple FS, Sandoval Y, Jaffe AS, Ordonez-Llanos J; IFCC Task Force on Clinical Applications of Cardiac Bio-Markers. Cardiac Troponin Assays:
guide to understanding analytical characteristics and their impact on clinical care. Clin Chem 2017;63:73-81.
27. Mangano DT. Adverse outcomes after surgery in the year 2001-a con- tinuing odyssey. Anesthesiology 1998;88:561-4.
28. Lindenauer PK, Pekow P, Wang K, Mamidi DK, Gutierrez B, Benjamin EM. Perioperative beta-blocker therapy and mortality after major non- cardiac surgery. N Engl J Med 2005;353:349-61.
29. Farzi S, Stojakovic T, Marko T, Sankin C, Rehak P, Gumpert R, et al. Role of N-terminal pro B-type natriuretic peptide in identifying patients at high risk for adverse outcome after emergent non-cardiac surgery. Br J Anaesth 2013;110:554-60.
30. Mauermann E, Puelacher C, Buse GL. Myocardial injury after noncardi- ac surgery: an underappreciated problem and current challenges. Curr Opin Anaesthesiol 2016;29:403-12.