1. Introduction
The Water vapor is one of the most critical elements in the Earth’s atmosphere, since it plays a significant role in the atmosphere process. Also, its distribution contributes to the vertical stability of atmosphere and evolution of the storm system. Furthermore, the water vapor is closely related with that of cloud and rainfall, which directly or indirectly impacts on the numerical weather prediction modelling.
The GPS METeorology (GPS/MET) has been successfully developed over the last two decades (Bevis, et al., 1992;
Bevis, et al., 1994; Duan, et al., 1996; Jin and Xi, 2014).
This technology basically enables to retrieve the integrated http://dx.doi.org/10.7848/ksgpc.2015.33.6.537
Retrieval and Analysis of Integrated Water Vapor from Precise GPS Data Processing at IEODO Ocean Research Station
Lee, Hungkyu1)·Musa, Tajul Ariffin2)·Choi, Yunsoo3)· Yoon, Hasu4)·Lee, Dong-In5)
Abstract
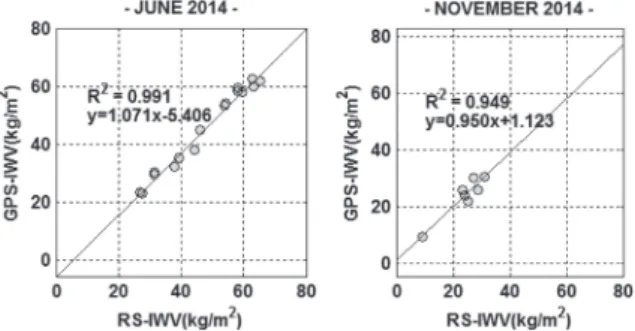
This paper deals with the retrieval of integrated water vapor (IWV) from the zenith tropospheric delay estimated by precisely processing GPS observations at IEODO ocean research station in the East China Sea. A comparison of GPS-IWV with the radiosonde profiling from June and November in 2014 was made to confirm the method and the procedure, adopted for the IWV determination. A series of analysis of these IWV values was performed to capture characteristics of their seasonal and diurnal variations. Furthermore, the troposphere around the ocean research station during typhoon events was spatiotemporally analyzed by including thirteen GPS sites over the Korean Peninsula, indicating correlation between the typhoon location and the tropospheric density.
Keywords : GPS, Integrated Water Vapor, Tropospheric Delay, IEODO
Original article
Received 2015. 11. 29, Revised 2015. 12. 14, Accepted 2015. 12. 22
1) Corresponding Author, Member, School of Civil, Environmental and Chemical Engineering, Changwon National University (E-mail: [email protected])
2) Faculty of Geoinformation and Real Estate, Universiti Tecknologi Malaysia (E-mail: [email protected]) 3) Member, Department of Geoinformatics, University of Seoul (E-mail: [email protected])
4) Member, Department of Geoinformatics, University of Seoul (E-mail: [email protected])
5) Department of Environmental Atmospheric Sciences, Pukyong National University (E-mail: [email protected])
This is an Open Access article distributed under the terms of the Creative Commons Attribution Non-Commercial License (http://
water vapor (IWV) from the zenith total tropospheric delay (ZTD) from the GPS measurements. Taking into account the density of liquid water, the IWV, expressed in
±
±
×
′
′
×
±
, is equivalent to the total percipitable water in
±
±
×
′
′
×
±
of liquid water.
Comparing to the traditional meteorological sensors, the GPS/MET has more benefits which make it possible to cost-effectively measure the IWV either in near real-time, or in post-mission mode with high temporal resolution and in all-weather conditions (Bevis, et al, 1992; Jin and Xi, 2014; Wang et al., 2013). The GPS/MET is also capable of delivering the water vapor estimates with competitive accuracy of microwave radiometer, radiosonde (RS) and
Journal of the Korean Society of Surveying, Geodesy, Photogrammetry and Cartography, Vol. 33, No. 6, 537-545, 2015
538
the very long baseline interferometry (VLBI) (Bevis, et al., 1992; Emardson, et al., 1998; Van Baelen, et al., 2005). Due to these factors, this technique has been mainly used for the short-term and the disastrous weather forecasting as an independent data source for data assimilation (Wang et al., 2013).
The Ieodo ocean research station (IORS), an offshore fixed plant structure, was constructed on the Scotra Rock in the East China Sea. The station has mainly supported scientific research activities on natural disaster and ocean environment, such as earthquakes, typhoons, and ocean climate changes. It equips with a great number of the state- of-art oceanic, environmental and meteorological sensors;
hence, their observations are provided via internet in real- time for 24 hours a day. The IORS, an unmanned research station, has been remotely operated by Korea Hydrographic and Oceanographic Authority (KHOA). In 2009, the Global Navigation Satellite System (GNSS) station was set up on the roof deck at the station (hereafter IEOD) to support marine geodetic research activities. While a Trimble NetRS receiver and TRM 41249.00 antenna were initially installed, they have been later replaced by NetR9 and TRM 55971.00 in January 2013. The typhoons normally pass through the IORS before they arrive to the Korean Peninsula. Therefore, the GNSS station has recently drawn meteorologists’ attention to use it as a meteorological sensor for numerical weather modelling during the severe weather event.
Those GPS measurements, obtained by IEOD from 2009 to 2014, have been precisely processed by using the Bernese 5.0 software to estimate the ZTD; the IWV has been retrieved if meteorological data was available.
The GPS-estimated IWV has been compared with those of RS profiled in June and November of 2014 to validate the method and the procedure, which adopted for the IWV retrieval process. The temporal analysis was carried out to understand seasonal and diurnal variations of the IWV.
Subsequently, the intensive spatiotemporal analysis on distributions of ZTD and IWV during two typhoon events was made over the East China Sea and the Korean Peninsula to observe the correlation of typhoon location and water vapor distributions. All the details of analyzed results are summarized in this paper with a view to maximize the role of IORS GPS station in the field of ocean atmospheric and meteorological researches.
2. Observation and Methodology
This section describes those GPS and RS observations and the methodology, which have used to retrieve the IWV from them in this research.
2.1 GPS
The IEOD station has been established on the roof deck of IORS in 2009 and operated continuously since then.
However, it is noted that the general operational condition of station faces the harshness due to the limited electric power supply and internet connection. This is mainly due to the fact that few tens of sensors at IORS are operating together; therefore, the power supply is controlled by an automatic system with the list of sensor priority during its shortage. Unfortunately, a GPS receiver is not ranked in the top of list, but resulted in unavoidable power disconnection. Since the IEOD receiver is not connected to communication network, the observation files can be only backed up if staffs of the KHOA pay visit to IORS for maintenance purpose. Furthermore, the GPS data, which if stored in the internal memory, had to be overwritten, if the periodic backup is not possible due to the severe weather condition. Table 1 summarizes the number of days, when GPS data was backed up at IEOD during the period of 2009 to 2014. Note that the GPS measurements of 2010 and 2012 were not considered in the data processing due to their limitation.
Year 2009 2010 2011 2012 2013 2014 Total
Number of Days 139 4 235 28 109 145 928
Data Available Rates (%) 53.7 1.1 64.4 7.8 30.0 74.0 42.4
Table 1. The number of days in which GPS data is available at IEOD
The total 896 days of GPS observations have been processed by using the scientific GNSS data processing software (i.e., Bernese version 5.0) with application of processing parameter shown in Table 2, so as to estimate ZTD at one hour interval. The software provides several unique tools useful to handle a huge number of GPS measurements (Gendt, et al., 2007). For instance, the Bernese processing engine (BPE), adopted in this research, automatically processes GPS data according to predefined scripts. Since the double-differenced technique was utilized for ZTD estimation, those ten IGS (International GNSS Services) stations around the Northeast Asia region were included. In Fig. 1, GPS measurements of thirteen continuously operation reference stations (CORS) from the national geographic information institute of Korea (NGII)
were included for the spatiotemporal analysis of ZTD and IWV around the East China Sea and Korean Peninsula during typhoons’ passages. A selection of these NGII station was made with a consideration of computational burden as well as spacing between them about 40 to 50 km around southern part of the Korean Peninsular.
For GPS-IWV retrieval, the zenith wet delay (ZWD) should be firstly obtained through subtracting the zenith hydrostatic delay (ZHD) from ZTD. Since the Saastamoinen model was adopted for this ZHD computation procedure (Saastamoinen, 1973), the IWV is retrieved from the ZWD by using following equations (Bevis, et al., 1992; Bevis, et al., 1994; Duan, et al., 1996):
±
±
×
′
′
×
±
(1)
with:
±
±
×
′
′
×
±
(2)
where
±
±
×
′
′
×
±
is the specific gas constant for water vapor,
±
±
×
′
′
×
±
is the weighted mean temperature of atmosphere (
×
′
′
×
±
),
×
′
′
×
±
,
×
′
′
×
±
is the ratio of the molar masses of water vapor and dry air (Davis et al., 1985). In this paper we use
×
′
′
×
,
±
×
′
′
×
±
and
±
×
′
′
×
±
, respectively (Bevis, et al., 1992).
Also, the Korean weighted mean temperature equation was used for
×
′
′
×
±
calculation (Song and Grejner-Brezinska, 2009).
2.2 Radiosonde (RS)
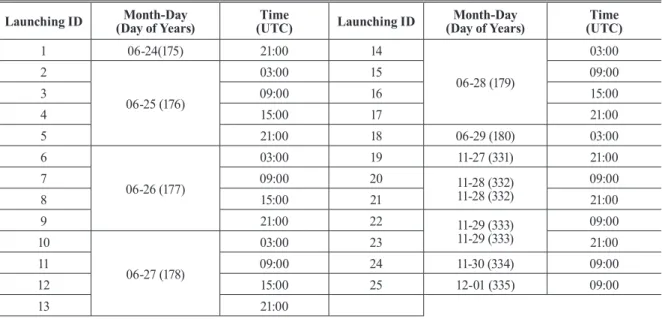
The total of 25 launches of RS was made at IORS in June and November of 2014. A Fig. 2 shows a setup of the RS trials Fig. 1. A network of GPS sites included in precise data
processing
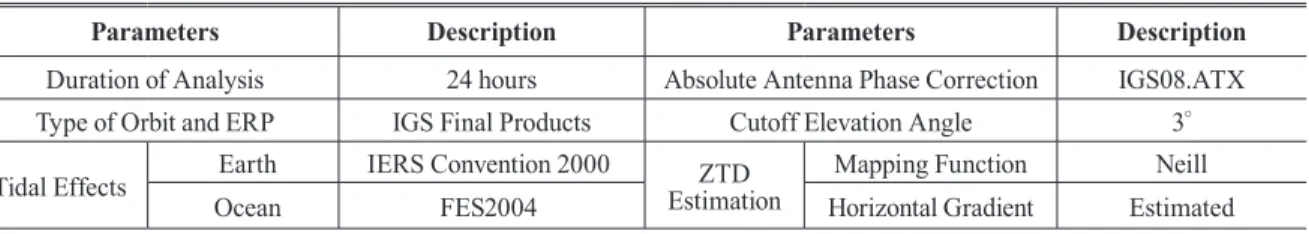
Parameters Description Parameters Description
Duration of Analysis 24 hours Absolute Antenna Phase Correction IGS08.ATX Type of Orbit and ERP IGS Final Products Cutoff Elevation Angle 3°
Tidal Effects Earth IERS Convention 2000 ZTD
Estimation Mapping Function Neill
Ocean FES2004 Horizontal Gradient Estimated
Table 2. GPS data processing parameters for estimation of the zenith total path delay
Journal of the Korean Society of Surveying, Geodesy, Photogrammetry and Cartography, Vol. 33, No. 6, 537-545, 2015
540
for atmospheric sounding. Information of date and time of RS trials are tabulated in Table 3. For the experimental missions, DFM-09 radiosondes were flown into sky to profile those - the pressure, temperature, humidity, wind speed and direction in atmosphere at one second interval (e.g., see http://www.graw.de in more details). Using the RS measurements in temperature, humidity, pressure and dew- point temperature, the IWV can be computed by using the trapezoidal method as below (Li, et al., 2006):
±
±
×
′
′
×
±
(3)
where
±
±
×
′
′
×
±
is the partial pressure of water vapor,
±
±
×
′
′
×
±
is the
gravity acceleration, and
±
±
×
′
′
×
±
and
±
±
×
′
′
×
±
is pressure and humidity at a certain surface pressure level, respectively. Hence, a value of the IWV is computed from one radiosonde profile.
For the IWV computation, those nine pressure levels are integrated from surface pressure from 1,000 to 200
±
±
×
′
′
×
±
.
3. Retrieval and Comparison of IWV from GPS and Radiosonde
3.1 GPS-retrieved IWV
Those ZTD values at one hour interval have been estimated from GPS measurements of IEOD, NGII and IGS stations for 928 days. The Fig. 3 shows daily averaged ZTD values at IEOD from 2009 to 2014. The results of year 2010 and 2012 are not included in these graphs due to previously mentioned reason. Although 42% of the GPS measurements is available for six years, a seasonal variation from the estimated ZTD can be seen from the graphs. For example, the ZTD maximum is at the beginning of August, while the minimum is either the end of December, or the beginning of January. In addition, the ZTD values depict seasonal tendency increasing in spring but decreasing in autumn.
The IWV has been retrieved from the ZTD by using Eq.
(1) with application of meteorological data. The Fig. 4 shows temporal variation of the IWV values at IEOD. While the Launching ID Month-Day
(Day of Years) Time
(UTC) Launching ID Month-Day
(Day of Years) Time
(UTC)
1 06-24(175) 21:00 14
06-28 (179)
03:00 2
06-25 (176)
03:00 15 09:00
3 09:00 16 15:00
4 15:00 17 21:00
5 21:00 18 06-29 (180) 03:00
6
06-26 (177)
03:00 19 11-27 (331) 21:00
7 09:00 20 11-28 (332)
11-28 (332) 09:00
8 15:00 21 21:00
9 21:00 22 11-29 (333)
11-29 (333) 09:00
10
06-27 (178)
03:00 23 21:00
11 09:00 24 11-30 (334) 09:00
12 15:00 25 12-01 (335) 09:00
13 21:00
Table 3. Data and time of the radiosonde launching at IORS in 2014
Fig. 2. View of radiosonde experiment at IORS in 2014