Korean Circulation Journal
Introduction
The Asia-Pacific region accounts for about half of the cases of cardiovascular disease (CVD).
1)Furthermore, the mortality from coronary heart disease has been steadily increasing in less developed and economically transitioning countries.
2)In Korea, diseases of circulatory system including coronary heart disease and stroke accounted for 22% of the entire death in 2012.
3)As widely known, high blood pressure is the leading cause of CVD. It is estimated that every 20 mmHg increase in systolic blood pressure (SBP) or 10 mmHg in diastolic blood pressure (DBP) is associated with two times increased risk of mortality from both ischemic heart disease
Print ISSN 1738-5520 • On-line ISSN 1738-5555
Prevalence and Trends of Isolated Systolic Hypertension among Korean Adults: the Korea National Health and Nutrition Examination Survey, 1998-2012
Na Rae Kim, RN, 1 and Hyeon Chang Kim, MD 2,3
1
Department of Public Health, Yonsei University Graduate School, Seoul,
2
Department of Preventive Medicine, Yonsei University College of Medicine, Seoul,
3
Cardiovascular and Metabolic Diseases Etiology Research Center, Yonsei University College of Medicine, Seoul, Korea
Background and Objectives: Systolic and diastolic blood pressure may have different effects on cardiovascular disease, but limited data is available for hypertension subtypes in the Korean population. Thus, the prevalence, and absolute number of hypertension subtypes among Korean adults was estimated.
Subjects and Methods: The Korea National Health and Nutrition Examination Survey 1998-2012 was used to estimate the prevalence and absolute number of each hypertension subtype among Korean adults aged ≥20 years. Hypertension was classified into four subtypes:
treated hypertension (TH), isolated systolic hypertension (ISH), isolated diastolic hypertension (IDH), and combined systolic and diastolic hypertension (SDH).
Results: In 2012, approximately 9.5 million adults were estimated to have hypertension, which consists of 5675671 TH (60.0%), 954253 ISH (10.1%), 1649486 IDH (17.4%), and 1175506 SDH (12.4%). Between 2010 and 2012, the proportion of IDH steadily decreased with age, but ISH increased especially in older ages (≥40). Between 1998 and 2012, TH markedly increased from 1.4 million to 5.7 million while the number of untreated hypertension remained relatively constant. During the same time, the number of hypertensive elderlies increased from 507000 to 2822000 along with rapid ageing of the Korean population. Despite of significant improvement in treatment rate, there are still around 583000 elderlies with untreated hypertension (423000 ISH; 42000 IDH; 118000 SDH) as of 2012.
Conclusion: Although the prevalence of hypertension has been constant over the last decades, absolute number of people with hypertension has been increasing. Along with the rapid population ageing, the number of elderly hypertension is increasing and the ISH is also becoming more prevalent. (Korean Circ J 2015;45(6):492-499)
KEY WORDS: Hypertension; Prevalence; Trends; Isolated systolic hypertension; Isolated diastolic hypertension.
Received: November 16, 2014 Revision Received: February 25, 2015 Accepted: June 2, 2015
Correspondence: Hyeon Chang Kim, MD, Department of Preventive Medicine, Yonsei University College of Medicine, 50-1 Yonsei-ro, Seodaemun-gu, Seoul 03722, Korea
Tel: 82-2-2228-1873, Fax: 82-2-392-8133 E-mail: [email protected]
• The authors have no financial conflicts of interest.
This is an Open Access article distributed under the terms of the Creative Commons Attribution Non-Commercial License (http://creativecommons.
org/licenses/ by-nc/3.0) which permits unrestricted non-commercial use,
distribution, and reproduction in any medium, provided the original work
is properly cited.
493 Na Rae Kim, et al.
and stroke.
4)Prevalence of hypertension was estimated to about 33.3% for male, and 29.8% for female among Korean adults aged 30 years and above in 2012.
5)Total medical cost for hypertension was estimated to 2640 billion Korean bills which accounts for 22%
of medical cost due to all chronic disorders.
6)This implies that controlling hypertension is important for reducing overall disease burden in the society.
It has been shown that elevated SBP is more important than elevated DBP,
7)8)because SBP is more closely associated with cardiovascular risk than DBP.
9)Multiple clinical studies have shown that elevated SBP is a more reliable predictor for adverse cardiovascular outcomes than elevated DBP.
10)11)Isolated systolic hypertension (ISH) is age-dependent because of progressively increasing SBP and decreasing DBP after the age of 55 years.
12)Treating ISH can reduce the risk of cardiovascular disease among the elderly.
13)In contrast to the abundant epidemiologic data for the Western population,
12)14)there is limited data available on hypertension subtypes in the Asian population.
15-18)Moreover, reported prevalence of hypertension subtype among Koreans is limited to a certain age group,
18)geographical region,
17)and specific subtype.
16)Therefore, the major aim was to evaluate cases of hypertension subtypes among the Korean population. First, the prevalence of overall hypertension and hypertension subtypes in the adult Korean population was estimated. Second, the overall absolute number of people with hypertension was estimated by subtype. With an exploratory aim, secular trends of hypertension subtypes were estimated as well.
Subjects and Methods
Study population
This study was based on the data from the first (1998), second (2001), third (2005), fourth (2007-2009), and fifth (2010-2012) Korea National Health and Nutrition Examination Survey (KNHANES).
5)19)The KNHANES is a national representative survey to assess the health and nutritional status of the Korean population.
Its target population comprises of nationally representative non- institutionalized civilians in Korea. The KNHANES consists of three distinct surveys: health interview survey, health examination survey, and nutrition survey. The KNHANES selected representative households using a stratified and multi-stage clustered probability sampling method. The sample for each year was the probability sample representing all parts of the country, which was determined by assigning weights to each respondent, where each rolling sample had both homogenous and independent characteristics. To make KNHANES samples represent the Korean population, sampling weights were assigned to participants each year. The final analysis
weight, which was applied data analysis, reflects sampling weights.
This is meant to correct for unequal selection probabilities and make adjustments for non-response as well as post-stratification samples so as to correct for known discrepancies between the sample and the target population. All participants in the survey signed an informed consent form. The institutional Review Board of the Korea Centers for Disease Control and Prevention (KCDC) approved the protocol.
19)To estimate the current prevalence and absolute number of people with hypertension, adults aged 20 years or older who completed both health examination and health interview survey for the fifth (2010-2012) KNHANES were selected. To assess the secular trend of hypertension and its subtype, data from the first through fifth (1998-2012) KNHANES was analyzed.
Blood pressure measurement
According to the standard protocol, SBP and DBP were measured by trained nurses using a mercury sphygmomanometer (Baumanometer Desk model; Baum, NY, USA) on the right arm of the subject while sitted after taking at least five minutes of rest. To increase the accuracy of blood pressure measurements, blood pressure was measured twice from 1998 to 2001, and the two values were then averaged to determine each participant’s SBP and DBP. Since 2005, blood pressure was measured three times, whereby the second and third measurements were averaged.
Definition and classification of hypertension
Hypertension was defined as a SBP≥140 mmHg or a DBP≥90 mmHg, or a case of anti-hypertensive drug use. In this study, hypertension subtypes were divided into treated hypertension and untreated hypertension. Individuals currently taking anti- hypertensive medication were categorized together as one group referred to as, “treated hypertension,” regardless of their actual blood pressure values. Untreated hypertension was further classified into three subtypes as follows: (1) ISH: defined as an average SBP≥140 mmHg and an average DBP<90 mmHg; (2) isolated diastolic hypertension (IDH): defined as an average SBP<140 mmHg and an average DBP≥90 mmHg; and (3) combined systolic and diastolic hypertension (SDH); defined as an average SBP≥140 mmHg and an average DBP≥90 mmHg.
Classification of hypertension subtype
Treated hypertension: taking anti-hypertensive medication Untreated hypertension: not taking anti-hypertensive medication ISH: SBP≥140 mmHg and DBP<90 mmHg
IDH: SBP<140 mmHg and DBP≥90 mmHg
SDH: SBP≥140 mmHg and DBP≥90 mmHg
Statistical analysis
All statistical analyses in this study were performed using SAS version 9.2 (SAS Institute Inc., Cary, NC, USA). SAS SURVEY procedures were used to estimate the prevalence of hypertension
while accounting for sampling weights. Frequency analysis was mainly used in this study in order to understand demographic characteristics of the data and distribution of hypertension. To estimate prevalence of hypertension and absolute number of Table 1. General characteristics of study population, 2010-2012
Variables Total age≥65
Men (n=7452) Women (n=10169) Men (n=1843) Women (n=2447)
Age (years) 51.0±16.2 50.9±16.8 72.3±5.1 72.8±5.5
BMI (kg/m
2) 24.0±3.1 23.4±3.6 23.2±2.9 24.3±3.4
Waist circumference (cm) 84.6±8.9 78.8±10.0 84.8±9.0 83.2±9.5
Fasting glucose (mmol/L) 100.9±24.3 95.9±20.4 104.8±24.4 102.9±23.6
Total cholesterol (mg/dL) 188.0±36.2 191.3±36.9 180.9±34.7 198.0±38.4
Triglyceride (mg/dL) 155.7±131.8 115.6±80.7 135.4±101.1 141.9±90.2
SBP (mmHg) 121.5±16.0 117.7±18.4 127.8±17.3 131.2±17.7
DBP (mmHg) 77.7±10.7 73.4±9.9 73.3±10.1 73.8±9.9
Age {years, n (%)}
20-29 767 (19.3) 1116 (16.9) 0 (0.0) 0 (0.0)
30-39 1339 (21.7) 1944 (20.4) 0 (0.0) 0 (0.0)
40-49 1374 (22.6) 1784 (21.4) 0 (0.0) 0 (0.0)
50-59 1410 (18.5) 1994 (18.4) 0 (0.0) 0 (0.0)
60-69 1365 (10.4) 1691 (11.3) 646 (37.6) 807 (30.8)
70-79 1024 (6.2) 1322 (8.9) 1024 (52.2) 1322 (53.7)
≥80 173 (1.2) 318 (2.6) 173 (10.3) 318 (15.6)
Residential area
Urban 3418 (46.4) 4706 (47.5) 753 (40.5) 951 (38.2)
Rural 4034 (53.6) 5463 (52.5) 1090 (59.5) 1496 (61.8)
Education levels
Less than high school 2051 (20.2) 4206 (34.9) 1097 (63.1) 2180 (92.2)
High school 2199 (31.0) 2735 (29.9) 426 (21.9) 198 (6.3)
College or more 3195 (48.8) 3204 (35.2) 314 (15.0) 53 (1.6)
Smoking
None 1336 (19.6) 9039 (86.4) 281 (15.2) 2224 (90.7)
Ex-smoker 3040 (33.7) 550 (6.5) 1095 (58.7) 113 (5.5)
Current smoker, n (%) 3055 (46.7) 544 (7.1) 452 (26.1) 88 (3.8)
Alcohol intake (drinks/week)
None 373 (4.2) 2105 (17.0) 192 (10.6) 1075 (44.0)
Ex-drinker 852 (8.9) 1732 (16.4) 405 (21.9) 485 (21.1)
Once per week or less 3376 (49.0) 5417 (57.2) 611 (31.9) 757 (30.4)
More than once per week 2803 (37.9) 834 (9.5) 618 (35.6) 106 (4.5)
Anti-hypertensive medication use, n (%)
≥20 (days/month) 1520 (18.1) 2189 (19.9) 805 (43.7) 1354 (55.3)
<20 (days/month) 28 (0.3) 33 (0.3) 14 (0.8) 13 (0.5)
None 6830 (81.5) 8794 (79.8) 1024 (55.6) 1080 (44.1)
Data are expressed as mean±standard deviation or frequency (%). BMI: body mass index, SBP: systolic blood pressure, DBP: diastolic blood pressure
495 Na Rae Kim, et al.
patients with hypertension by subtype, data in both men and in women were analyzed separately, because sex and age are well known factors which influence blood pressure levels. When calculating the number of patients with hypertension subtypes, age-standardization was not conducted because the primary aim of this study was to estimate absolute disease weight. However, for the prevalence hypertension, both crude and age-standardized rates were calculated in order to assess the effects of population aging.
Age-standardized results were provided as supplementary data.
Results
The general characteristics of 17621 people from the fifth KNHANES, which were used to estimate recent prevalence of
hypertension, are summarized in Table 1. Mean age of the study population was 51.0 years for men and 50.9 years for women.
Means of SBP, DBP, body mass index, waist circumference, fasting glucose and triglyceride were higher in men than in women.
However, total cholesterol level was higher in women than in men.
Prevalence of hypertension
Table 2 shows the prevalence of hypertension and absolute number of people with hypertension in total and by aspects of sex and age. These were estimated using data from the fifth (2010- 2012) KNHANES. In adults aged 20 years or older, the overall prevalence of hypertension was 25.8%. When divided by age-group, prevalence of hypertension was 4.9% in 20-29 years, and 71.0% in 80 years or older group. Hypertension tended to be more prevalent Table 2. Prevalence of hypertension by sex and age, 2010-2012
Age Number of
people analyzed Number of
hypertension Prevalence of hypertension, %
(95% CI) Estimated number of hypertension (95% CI)
Total
20-29 1883 74 4.9 (3.6-6.2) 326096 (239204-412987)
30-39 3283 242 8.6 (7.4-9.8) 661274 (558246-764301)
40-49 3158 575 20.2 (18.5-22.0) 1630866 (1452128-1809604)
50-59 3404 1176 35.2 (33.1-37.2) 2383324 (2195770-2570878)
60-69 3056 1645 55.0 (52.6-57.3) 2188244 (2029518-2346969)
70-79 2346 1469 63.2 (60.9-65.5) 1764013 (1626858-1901168)
≥80 491 342 71.0 (65.7-76.3) 500099 (428715-571483)
All 17621 5523 25.8 (24.8-26.8) 9453915 (9026838-9880993)
Men
20-29 767 64 8.5 (6.2-10.9) 296979 (212617-381341)
30-39 1339 192 14.2 (12.1-16.4) 557723 (464055-651390)
40-49 1374 356 26.8 (24.1-29.6) 1095953 (953199-1238707)
50-59 1410 542 39.2 (36.1-42.3) 1312910 (1180759-1445061)
60-69 1365 728 53.8 (50.4-57.1) 1011529 (913939-1109118)
70-79 1024 573 55.5 (51.6-59.4) 626128 (555773-696482)
≥80 173 102 57.1 (47.9-66.3) 126705 (96290-157121)
All 7452 2557 27.8 (26.5-29.2) 5027927 (4755021-5300833)
Women
20-29 1116 10 0.9 (0.2-1.6) 29117 (7635-50599)
30-39 1944 50 2.7 (1.9-3.6) 103551 (69921-137181)
40-49 1784 219 13.4 (11.5-15.4) 534913 (451105-618722)
50-59 1994 634 31.2 (28.7-33.7) 1070414 (965290-1175538)
60-69 1691 917 56.0 (52.9-59.2) 1176715 (1072340-1281089)
70-79 1322 896 68.4 (65.4-71.5) 1137885 (1035055-1240715)
≥80 318 240 77.4 (71.3-83.4) 373393 (311310-435477)
All 10169 2966 23.8 (22.6-25.0) 4425989 (4181642-4670335)
Prevalence and estimated number of hypertension were calculated by applying sampling weights. CI: confidence interval
496 Prevalence and Trends of Hypertension Subtypes among Korean Adults
in older age groups in both sexes. Men had higher prevalence than women up to 50 years of age, while women had higher prevalence than men in 60 or older years. However, absolute number of patients with hypertension was largest in age group of 50 years (2.4 million) and accounted for 25.4% of the entire hypertension cases.
When divided by sex, absolute number of patients with hypertension was the biggest in age 50s among men (1.3 million), and age 60s among women (1.2 million).
Subtype distribution among people with hypertension by sex and age; 2010-2012
Fig. 1 presents the relative frequency of each hypertension subtype in total and by age, which is separate for men and for women. As age increases, the proportion of treated hypertension progressively increases. Untreated ISH also shows increasing trends with age, partly in age-group that is above 40 years. Treated hypertension accounted for the highest proportion of total hypertension patients both in men (49.5%) and women (72.0%).
Among the untreated hypertension subtypes, IDH was the most frequent subtype in younger adults (<50 years). Combined SDH was the most frequent subtype in men and women aged 50-59 years.
However, SDH gradually decreased after those ages, and accounted for only 0.3% in men and 1.8% in women aged 80 years or older.
On the other hand, ISH was the most common untreated hypertension subtype in people aged 60 years or older. Weighted frequency with 95% confidence interval (CI) and proportion for each hypertension subtype were provided in Supplementary Table 1 (Supplementary Table 1 in the online-only Data Supplement).
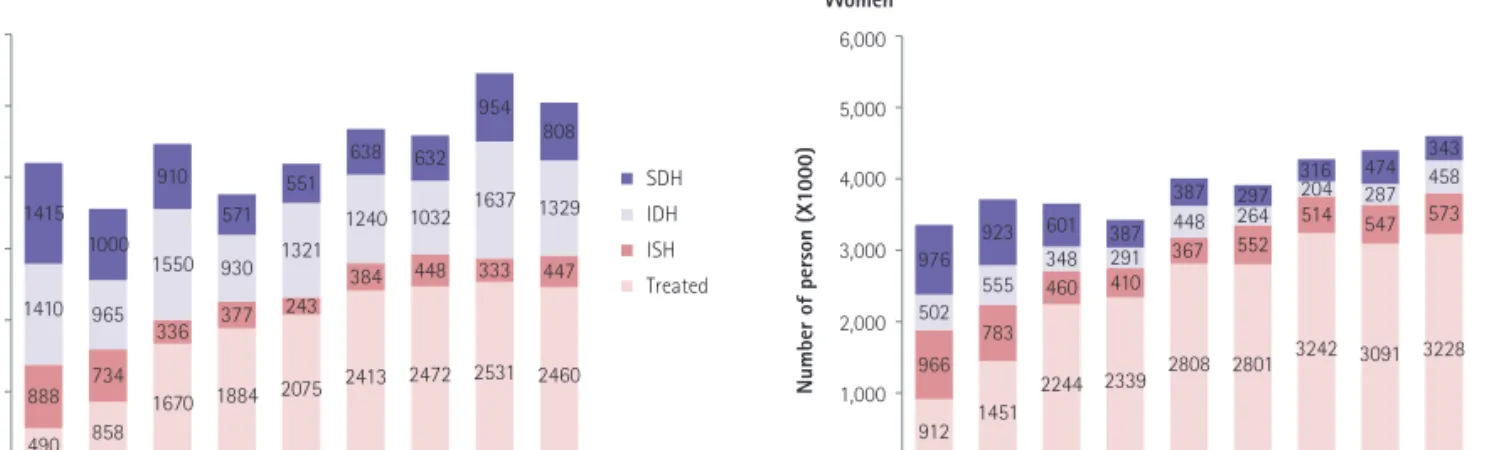
Trends in the number of patients for each hypertension subtype Between 1998 and 2012, the number of patients under treatment has increased remarkably both in men and women. On the other hand, the number of untreated hypertension has been relatively constant. In overall adult population (age≥20 years), there have been more male patients with hypertension than female patients. However, women with hypertension were more
SDH IDH ISH Treated
MenNumber of person (X1000)
6,000
5,000
4,000
3,000
1,000 2,000
0
Women
Number of person (X1000)
6,000
5,000
4,000
3,000
1,000 2,000
0
1998 2001 2005 2007 2008 2009 2010 2011 2012
1998 2001 2005 2007 2008 2009 2010 2011 2012 Year
SDH IDH ISH Treated
Year 1415
1410
888 490
1000
965
734
858 910
1550
336
1670 571 930 377
1884 551
1321
243
2075 638
1240
384
2413 632
1032 448
2472 954
1637
333
2531 808
1329
447
2460
343 458 573
3228 474 287 547
3091 316 204 514
3242 297 264 552
2801 387 448 367
2808 601 387
348 460
2244 1451
783 555 923 976 502 966
912
291 410
2339
SDH IDH ISH Treated
MenNumber of person (X1000)
6,000
5,000
4,000
3,000
1,000 2,000
0
Women
Number of person (X1000)
6,000
5,000
4,000
3,000
1,000 2,000
0
1998 2001 2005 2007 2008 2009 2010 2011 2012
1998 2001 2005 2007 2008 2009 2010 2011 2012 Year
SDH IDH ISH Treated
Year 1415
1410
888 490
1000
965
734
858 910
1550
336
1670 571 930 377
1884 551
1321
243
2075 638
1240
384
2413 632
1032 448
2472 954
1637
333
2531 808
1329
447
2460
343 458 573
3228 474 287 547
3091 316 204 514
3242 297 264 552
2801 387 448 367
2808 601 387
348 460
2244 1451
783 555 923 976 502 966
912
291 410
2339
Fig. 2. Trends in absolute number of people with hypertension by subtype, age ≥20 years. Numbers of people with hypertension were estimated by applying sampling weights. SDH: systolic and diastolic hypertension, IDH: isolated diastolic hypertension, ISH: isolated systolic hypertension.
Men (%)
(%) 100
80
60
40
20
0
Women 100
80
60
40
20
0
Total 20-29 30-39 40-49 50-59 60-69 70-79 80+
Total 20-29 30-39 40-49 50-59 60-69 70-79 80+
Age SDH IDH ISH Treated
Age SDH IDH ISH Treated 15.9
26.5
8.1
49.5
7.2
80.2
1.9 10.6
8.5 7.2 12.3
72.0
23.1
25.3
6.1
45.6 13.2
9.1 12.3
65.5 3.7 1.5
16.3
78.6 2.8 0.7
11.7
84.8 1.8 0.0
13.1
85.1 22.4
53.6
4.9 19.2
23.0
63.3
3.1 10.6
24.2
41.7
5.2
28.9
20.1
15.2 8.4
56.3 10.4
4.1 12.7
72.8 3.9 1.5 13.2
81.5 0.3 1.1 20.5
78.2 23.2
44.7
1.2
30.9
(%) 80
60
40
20
0
Women
100
80
60
40
20
0
Total 20-29 30-39 40-49 50-59 60-69 70-79 80+
Total 20-29 30-39 40-49 50-59 60-69 70-79 80+
Age SDH IDH ISH Treated
Age SDH IDH ISH Treated 26.5
8.1
49.5
80.2
1.9 10.6
8.5 7.2 12.3
72.0
23.1
25.3
6.1
45.6 13.2
9.1 12.3
65.5 3.7 1.5
16.3
78.6 2.8 0.7
11.7
84.8 1.8 0.0
13.1
85.1 22.4
53.6
4.9 19.2
23.0
63.3
3.1 10.6
24.2
41.7
5.2
28.9
15.2 8.4
56.3 4.1 12.7
72.8 13.2
81.5 20.5
78.2 23.2
44.7
1.2
30.9
Fig. 1. Proportion of hypertension subtypes by sex and age, 2010-2012. Proportions of hypertension subtypes were estimated by applying sampling
weights. SDH: systolic and diastolic hypertension, IDH: isolated diastolic hypertension, ISH: isolated systolic hypertension.
497 Na Rae Kim, et al.
likely to take anti-hypertensive medication, such that the number of treated hypertension was bigger in women than in men.
Subtypes of SDH and IDH were more common in men than in women, while ISH was more common in women than in men (Fig.
2). As a further analysis, age-adjusted proportion for each hypertension subtype was calculated. Moreover, proportion of treated hypertension has been increased in age-standardized analysis between 1998 and 2012, while proportions of ISH and SDH have been decreased during the same period (Supplementary Table 2 in the online-only Data Supplement).
The absolute number of elderly people (age≥65 years) with hypertension shows a generally increasing trend. Among the elderly population, the number of women with hypertension was much bigger than the number of men with hypertension. ISH accounted for the highest proportion among untreated hypertensive subtypes both in men and women, while IDH was lowest (Fig. 3).
Discussion
The present study shows the prevalence of hypertension and absolute number of people with hypertension, which analyzes the national representative data. The recent (2010-2012) percentage prevalence of hypertension among Korean adults was estimated to 25.8% (27.8% in men, 23.8% in women) in the total population, and the estimated number of people with hypertension was over 9.4 million (95% CI 9.0 to 9.9 million).The KCDC has reported that prevalence of hypertension was 29.0% among Korean adults aged 30 years or older.
5)However, to evaluate the absolute weight of hypertension, younger adults need to be included for the prevalence of hypertension. Blood pressure during young adulthood predict future risk of cardiovascular events.
20)In the US, the prevalence of hypertension was calculated for adults aged 18 years or older.
21)According to the US National Health
and Nutrition Examination Survey (NHANES), rates of hypertension control have improved in the United States,
22)whereby young adults have consistently low rates of hypertension control compared to middle-aged and older adults.
22)23)This is a significant health issue, because young adults with uncontrolled hypertension are at risk for chronic kidney disease and premature strokes, particularly in the presence of diabetes.
24)25)According to the report of the fifth KNHANES (2010-2012), young adults (20-39 years) accounted for 10.4% of all hypertension patients. However, this age group accounted for less than 1% of all treated hypertension. This represents only 3.4% of the entire 20s year old of people with hypertension. No data has been published for hypertension awareness and treatment rates among Koreans aged less than 30 years. The official KNHANES reports estimated awareness, treatment and control rates only for hypertensive patients aged 30 years or older.
In this study, about 10% of all patients with hypertension was untreated ISH which corresponds to the prevalence of 2.6% in the entire Korean population. This is lower than the prevalence reported from China (7.6%),
15)16)USA (5.6%), and Canada (6.4%).
26)In general, it is known that ISH is age dependent,
12)27)and is more common in elderly women than elderly men.
28)The study shows that the proportion of subjects with ISH became bigger with advancing age in older adults (≥40 years). By contrast, the IDH was more prevalent in adults until age 50s, after which it declined. The data from both the US and Canadian studies were consistent with the data collected in this study. In the US study, the increase in ISH prevalence was steeper for women than for men after the age of 55.
26)The prevalence of ISH in women was lower at a younger age, but higher after 65 years of age, according to the results of the Canadian study.
26)However, data from the Chinese study showed that the prevalence of ISH in women was higher than in men at all age groups.
15)The US and Chinese studies also indicated that the
Men
Number of person (X1000)
2,500
2,000
1,500
1,000
500
0
Women
Number of person (X1000)
2,500
2,000
1,500
1,000
500
0
SDH IDH ISH Treated
Year
SDH IDH ISH Treated
Year 1998 2001 2005 2007 2008 2009 2010 2011 2012
1998 2001 2005 2007 2008 2009 2010 2011 2012 148
249 18 201 229 64 124 367
159 149 47 506
102 216 25
577 64 154 33
720 62 226 27
850 39 232 7
792 34 163 33
1063 62 162 25
1029
258
470 44
383 274
413 56
683 150 317 15
1094 142 289
25
1185 122 229 17
1399 41 325
23
1494 59 251 8
1749 78 293
21
1773 56 261 17
1793
Men
Number of person (X1000)
2,500
2,000
1,500
1,000
500
0
Women
Number of person (X1000)