Association of Relative Handgrip Strength and
Metabolic Syndrome in Korean Older Adults: Korea National Health and Nutrition Examination Survey VII-1
Seungyoun Hong*
Department of Senior Industry, Kangnam University, Yongin, Korea
Background: The prevalence of metabolic syndrome (MetS) is rapidly increasing with advanced age. Since ag- ing affects sarcopenia and muscle strength, which could, in turns, affect MetS, it is critical to examine the associa- tion between MetS and muscle strength in this population. Handgrip strength (HGS) has been introduced as a simple assessment tool for muscular strength. Several studies investigating the association between HGS and the risk of MetS have yield conflicting results. Therefore, this study aimed to investigate the association of MetS and relative handgrip strength (RHGS) in elderly Koreans.
Methods: A total of 1,244 (male, 589; female, 655) elderly subjects (age ≥65 years), who participated in the Seventh Korea National Health and Nutrition Examination Survey VII-1 (2016) were analyzed. Participant’s HGS, body mass index (BMI), MetS, and its five criteria were measured. Subjects were categorized into four groups based on their RHGS, which was defined as absolute HGS divided by BMI.
Results: The highest quartile RHGS group has a significantly lower prevalence of MetS in both men and women (F=35.16, P<0.001 vs. F=31.78, P<0.001, respectively). Moreover, the odds ratio of MetS was 0.52 times lower (0.52; 95% confidence interval [CI], 0.31–0.85) in the third quartile RHGS than that of the lowest RHGS, and 0.28 times lower (0.28; 95% CI, 0.17–0.47) in the highest RHGS group in women than that of the lowest RHGS group.
Conclusion: Maintaining a high level of HGS may reduce the incidence rate of MetS in elderly Koreans.
Key words: Hand strength, Metabolic syndrome, Aged, Muscle strength
Received February 7, 2019 Reviewed February 28, 2019 Accepted March 10, 2019
* Corresponding author Seungyoun Hong
https://orcid.org/0000-0002-1574-9298 Department of Senior Industry, Kangnam University, 40 Gangnam-ro, Giheung-gu, Yongin 16979, Korea
Tel: +82-31-899-7210 Fax: +82-31-899-7211 E-mail: yoni91@hotmail.com
INTRODUCTION
Metabolic syndrome (MetS) is a cluster of unhealthy cardio- metabolic disease risk factors, such as abdominal obesity, high level of systemic hypertension, elevated fasting plasma glucose (FPG) level, high levels of triglyceride (TG), low levels of high-density li- poprotein cholesterol (HDL-C) defined by the American Heart Association.
1The prevalence of MetS is rapidly increasing with ad- vanced age worldwide
2-4: 40% of people over 60 years in the US
5and 34.0% and 40.5% in elderly men and women in Korea.
6Since MetS is also known as being related to all-cause of mortality
7, type 2 diabetes mellitus
8, increased risk of cardiovascular disease (CVD), increased risk of cognitive decline
9, and physical function, develop- ing proper public health strategies for the detection, and prevention of MetS should be an urgent priority.
Further, population aging affects aging sarcopenia characterized by loss of muscle mass and muscle strength.
10It involves changes to underlying structures and processes, including muscle fibers and their
Copyright © 2019 Korean Society for the Study of Obesity
This is an Open Access article distributed under the terms of the Creative Commons Attribution Non-Commercial License (http://creativecommons.org/licenses/by-nc/4.0/) which permits unrestricted non-commercial use, distribution, and reproduction in any medium, provided the original work is properly cited.
2017-03-16 https://crossmark-cdn.crossref.org/widget/v2.0/logos/CROSSMARK_Color_square.svg
innervation. Reduced muscle strength, in turn, can be used as a de- terminant for loss of physical function and disability risk in old age.
Handgrip strength (HGS) has been introduced as a simple and inexpensive assessment tool for muscular strength. Since HGS was strongly correlated with total muscle strength
11, it is often used as an indicator of overall muscle strength for aging adults.
Numerous clinical and epidemiological studies show that low HGS is associated with a variety of poor health outcomes including subsequent onset of functional limitation
10, chronic mobilities and disabilities
12, all-cause mortality
13, and even longer length of stay among surgical patients.
14Several studies investigating the association between HGS and the risk of cardiovascular risk and MetS have yield conflicting re- sults. Meta-analysis of cohort studies had reported that the hazard ratio was 1.6 for CVD when it compared the lowest versus the highest level of HGS.
15However, Gubelmann et al.
16reported no association between absolute HGS and CVD among 2,707 sub- jects over 50 years of age.
Besides, unclear sex difference in this association has been re- ported as well. Taiwanese study
17reported that reduced relative handgrip strength (RHGS) was associated with an increased car- diovascular risk score only in men and a recent UK study reported that HGS was associated with CVD only in men, not it women.
18Little is known concerning the relationship between MetS and HGS in the older adult who is a part of the population that has a higher incidence of MetS, activity of daily life (ADL) impairments and associated CVD than younger adults. During later life, the el- derly are vulnerable to the adverse consequence of decreased HGS, i.e., frailty, disabilities, which required the long-term care. Many ADLs and instrumental activities of daily living such as eating, dressing, carrying groceries are involved in HGS. Those below 65 years of age living with MetS and decreased HGS may not need long-term care in the way that older people over 65 years of age would be due to the remained other physical function.
To our knowledge, studies of the association between HGS and MetS in the older population have not been reported in Korea. The increasing number of aging people with sarcopenia and an increase need of long-term care services demonstrate the need to conduct research identifying the association of HGS and risk factors. There- fore, the purpose of the current study was to investigate the associa-
tion of RHGS and MetS by analyzing the Korea National Health and Nutrition Examination Survey (KNHANES) VII-1, 2016.
METHODS Study subjects
This study analyzed the KNHANES VII-1, 2016. The KNHANES has been examined since 1998 by Korea Centers for Disease Con- trol and Prevention (CDC) to assess the health status of the Kore- an. This survey was the probability-cluster, stratified and multistage survey of a representative sample of the noninstitutionalized popu- lation in order to assess the health status in the Korean population.
Annually, 4,600 households, 10,000–12,000 individuals are select- ed from a panel.
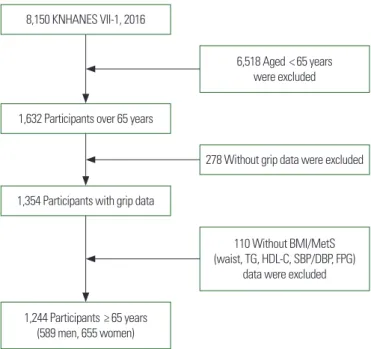
The KNHANES VII-1 was a cross-sectional and nationally rep- resentative survey consisting of the nutrition survey, the health in- terview, and the health examination. Among a total of 8,150 per- sons aged 19 and older who completed KNHANES VII-1, we used data of 1,244 whose age was 65 years and older and whose HGS, body mass index (BMI), and MetS data (Fig. 1).
Figure 1. Flow diagram for selection of study subjects. KNHANES, Korea National Health and Nutrition Examination Survey; BMI, body mass index; MetS, metabolic syndrome; TG, triglyceride; HDL-C, high-density lipoprotein; SBP, systolic blood pressure; DBP, diastolic blood pressure; FPG, fasting plasma glucose.
8,150 KNHANES VII-1, 2016
1,632 Participants over 65 years
1,354 Participants with grip data
1,244 Participants ≥ 65 years (589 men, 655 women)
6,518 Aged < 65 years were excluded
278 Without grip data were excluded
110 Without BMI/MetS (waist, TG, HDL-C, SBP/DBP, FPG)
data were excluded
Ethics statement and data access
Access to the KNHANES data was acquired after receiving ap- proval by the Institutional Review Board (IRB) of the Korea CDC (2013-12EXP-03-5C). This study is a retrospective study that used and analyzed the data from the 2016 KNHANES survey; there- fore, approval from IRB was not required. Because the dataset did not include personal information and participant gave the consent to the KNHANES, further ethical approval for the use of open KNHANES data was exempted from the IRB.
Data collection
The health examinations included medical history taking, a ques- tionnaire on health-related behaviors, physical examination, anthro- pometric and biochemical measurements. Physical examinations were performed by trained medical staff following standardized procedures. In demographic variables, family income was catego- rized into quartiles as Q1 (< 25th percentile), Q2 (25th–49th per- centile), Q3 (50th–74th percentile), and Q4 (≥ 75th percentile).
Further, education was classified as below elementary school, mid- dle school graduate, high school graduate, and college graduate or above.
Participants were asked about health-related behaviors, including cigarette smoking status and regular exercise. Smoking status was indicated as “never,” “former,” and “current” based on their smoking status at the time of the survey. Regular aerobic exercise was indi- cated as “yes” when the subject participated moderate or strenuous exercise regularly more than 2 hours and 30 minutes per week for moderate exercise that causes slightly increased respiration and heart rate; more than 1 hour and 15 minutes for vigorous exercise.
Regular resistance exercise was indicated as “yes” when the subjects participated in resistance exercises such as push-up, arm-curls, and sit-up at least 2 days per week.
Waist circumference (WC) was measured at a middle point be- tween the last rib and the iliac crest. Systolic blood pressure (SBP) and diastolic blood pressure (DBP) measured in the sitting posi- tion and reading were recorded twice at 5-minute intervals and av- eraged for analysis. All the measurement information of blood samples including FPG level, total cholesterol (TC), TG level, HDL-C levels, glycosylated hemoglobin (HbA1c) level were re- ported in previously shown in KNHANES studies.
19Assessment of HGS and MetS parameters
HGS was measured in each hand three times with a digital grip strength dynamometer (TKK 5401; Takei, Tokyo, Japan). Trained staff instructed the standing participants to hold the dynamometer with the distal interphalangeal finger joints of the hand at 90° to the handle and to squeeze the handle as hard as they could. A resting interval of 30 seconds was allowed between each measurement. A measure of three times was reported as an average.
Recently, using BMI to adjust for HGS has been recommended as a muscle quality index.
20Thus, we used RHGS instead of abso- lute HGS, defined as the average value for maximum grip strength of the dominant hand divided by BMI which was calculated as weight divided by height squared (kg/m
2).
The definition of the MetS proposed by the US National Cho- lesterol Education Program Adult Treatment Panel III
21was applied for this study. Participants with three or more of the following five criteria were defined as having the MetS: high blood pressure (SBP/
DBP over 130 and ≥85 mmHg) or the use of antihypertensive medication, elevated fasting blood glucose (≥110 mg/dL) or using the antihyperglycemic medication, TG (≥150 mg/dL), low HDL-C (men, <40 mg/dL; women, <50 mg/dL), and central obesity, as measured by a WC of ≥85 cm for women and ≥90 cm for men.
Statistical analyses
The complex sample analysis was conducted for the KNHANES data for weighing all values following the guideline given at the workshop by the Korea CDC. Due to the significant sex differences in RHGS data, data of men and women were separated in this study. Sex difference in demographic and anthropometric charac- teristics was compared using the independent t-test or chi-square test. RHGS was divided into the quartiles. Multivariate logistic re- gression analysis was analyzed to investigate the association be- tween the quartiles of RHGS and MetS itself or its parameters (SBP, DBP, FPG, HbA1C, TC, TG, HDL-C, and WC).
Statistical analysis was conducted with the IBM SPSS version
23.0 (IBM Corp., Armonk, NY, USA). Continuous and categorical
variables were expressed as mean± standard error (SE) and num-
ber (%), respectively. The P-values less than 0.05 were considered
as statistically significant.
RESULTS
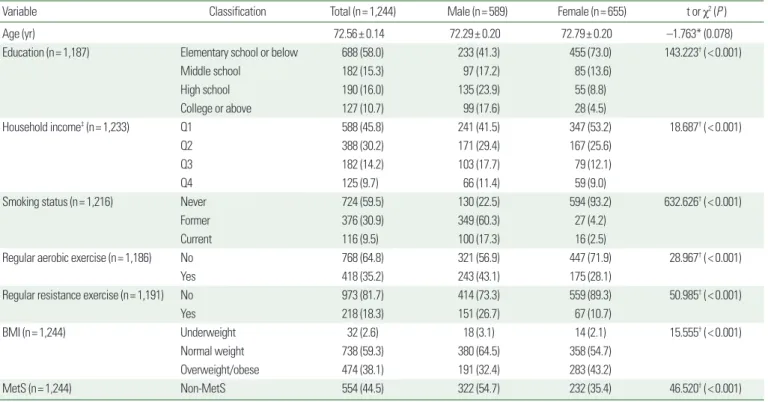
The baseline general and clinical characteristics of subjects by gen- der (n= 1,244) are shown in Table 1. The study population includ- ed 589 men (47.35%) and 655 women (52.65%) aged 65 and old- er from the KNHANES VII-1. The average age of the study popu- lation was 72.56 years (SE, 0.14; range, 65–80 years; men, 72.29 years; women, 72.79 years). There was no significant difference in mean age between men and women. However, education, house- hold income, smoking status, regular exercise, BMI and prevalence of MetS differed significantly between men and women (Table 1).
The cardiovascular risk factors of weighted samples by sex are shown in Table 2. Weight, SBP, WC, levels of FPG, TC, HDL-C, absolute HGS, and RHGS differed significantly between men and women. In men, weight, WC, FPG, absolute HGS, and RHGS were significantly higher than women, but SBP, TC, HDL-C of men were significantly lower than women. The mean of absolute right HGS was 26.94 kg (men, 34.26 kg; women, 20.36 kg;
P<0.001), and the mean of RHGS was 1.13 (men, 1.45; women, Table 1. General characteristics of the study population by sex
Variable Classification Total (n= 1,244) Male (n= 589) Female (n= 655) t or χ2 (P )
Age (yr) 72.56± 0.14 72.29± 0.20 72.79± 0.20 –1.763* (0.078)
Education (n= 1,187) Elementary school or below 688 (58.0) 233 (41.3) 455 (73.0) 143.223† (< 0.001)
Middle school 182 (15.3) 97 (17.2) 85 (13.6)
High school 190 (16.0) 135 (23.9) 55 (8.8)
College or above 127 (10.7) 99 (17.6) 28 (4.5)
Household income‡ (n= 1,233) Q1 588 (45.8) 241 (41.5) 347 (53.2) 18.687† (< 0.001)
Q2 388 (30.2) 171 (29.4) 167 (25.6)
Q3 182 (14.2) 103 (17.7) 79 (12.1)
Q4 125 (9.7) 66 (11.4) 59 (9.0)
Smoking status (n= 1,216) Never 724 (59.5) 130 (22.5) 594 (93.2) 632.626† (< 0.001)
Former 376 (30.9) 349 (60.3) 27 (4.2)
Current 116 (9.5) 100 (17.3) 16 (2.5)
Regular aerobic exercise (n= 1,186) No 768 (64.8) 321 (56.9) 447 (71.9) 28.967† (< 0.001)
Yes 418 (35.2) 243 (43.1) 175 (28.1)
Regular resistance exercise (n= 1,191) No 973 (81.7) 414 (73.3) 559 (89.3) 50.985† (< 0.001)
Yes 218 (18.3) 151 (26.7) 67 (10.7)
BMI (n= 1,244) Underweight 32 (2.6) 18 (3.1) 14 (2.1) 15.555† (< 0.001)
Normal weight 738 (59.3) 380 (64.5) 358 (54.7)
Overweight/obese 474 (38.1) 191 (32.4) 283 (43.2)
MetS (n= 1,244) Non-MetS 554 (44.5) 322 (54.7) 232 (35.4) 46.520† (< 0.001)
Values are presented as mean± standard error or number (%).
*t-test; †Chi-square test; ‡Q1 (< 25th percentile), Q2 (25th– 49th percentile), Q3 (50th–74th percentile), and Q4 (≥ 75th percentile).
BMI, body mass index; MetS, metabolic syndrome.
Table 2. Cardiovascular risk factors of weighted samples by sex
Variable Male (n= 589) Female (n= 655) t (P )*
Weight (kg) 65.26± 0.38 57.09± 0.34 15.962 (< 0.001) SBP (mmHg) 126.41± 0.66 130.34± 0.68 –4.109 (< 0.001)
DBP (mmHg) 72.19± 0.41 72.99± 0.38 –1.418 (0.157)
BMI (kg/m2) 23.79± 0.12 24.71± 0.13 –5.081 (< 0.001)
WC (cm) 87.10± 0.35 85.45± 0.36 3.294 (0.001)
FPG (mg/dL) 111.72± 1.31 107.15± 1.01 2.779 (0.006)
HbA1C (%) 6.07± 0.04 6.03± 0.32 0.615 (0.538)
TC (mg/dL) 179.94± 1.52 190.75± 1.54 –4.992 (< 0.001)
TG (mg/dL) 140.83± 3.74 141.88± 3.42 –0.211 (0.833)
HDL-C (mg/dL) 45.85± 0.48 49.36± 0.47 –5.187 (< 0.001) LDL-C (mg/dL) 107.89± 3.72 112.02± 3.31 –0.831 (0.407) Absolute right HGS (kg) 34.26± 0.29 20.36± 0.19 40.050 (< 0.001) RHGS (kg/BMI) 1.45± 0.01 0.84± 0.01 40.379 (< 0.001) Values are presented as mean± standard error.
*t-test.
SBP, systolic blood pressure; DBP, diastolic blood pressure; BMI, body mass index; WC, waist circumference; FPG, fasting plasma glucose; HbA1C, glycosylated hemoglobin;
TC, total cholesterol; TG, triglyceride; HDL-C, high-density lipoprotein cholesterol; LDL- C, low-density lipoprotein cholesterol; HGS, handgrip strength; RHGS, relative handgrip strength.
0.84) and there was a significant sex difference in both absolute HGS and RHGS. There were no sex differences regarding DBP, HbA1c, TG, and LDL-C (Table 2).
The association between RHGS and components of the MetS are shown in Table 3. WC was negatively associated with RHGS in both men and women (r= –0.338, r= –0.396; P<0.001, respec- tively). Weight and HbA1C are negatively associated with RHGS in both sexes, but HDL-C was positively partial correlated with RHGS in both sex. Aerobic exercise is partial positive correlated with RHGS in both sexes (P<0.001, P<0.038, respectively), con- versely, strength exercise was positively correlated with RHGS in men only (P<0.001) (Table 3).
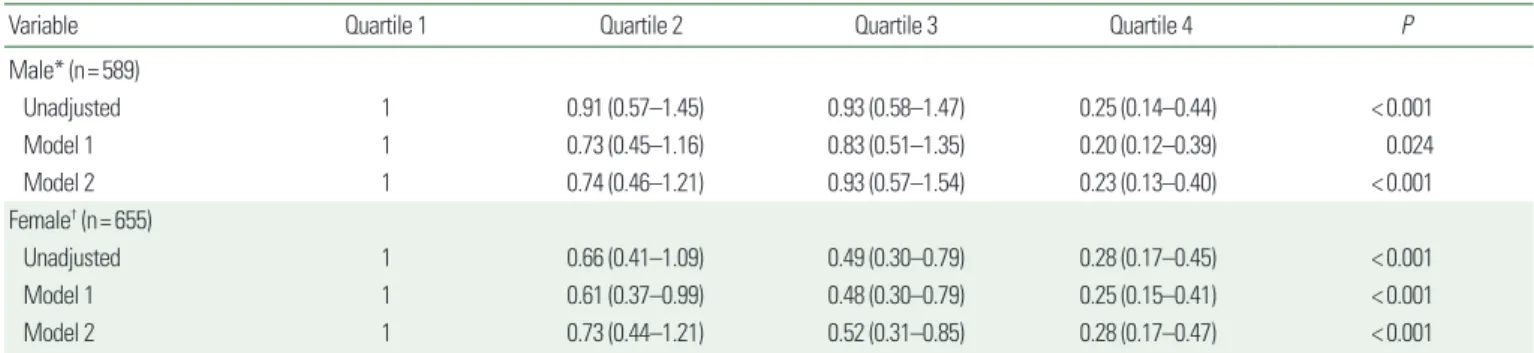
Table 4 shows the results of a logistic regression analysis using MetS as an objective variable and confounding factors including age, education, family income, marital status, and regular exercise participation (aerobic exercise & resistance exercise) as explanatory variables were performed with subjects categorized by sex. Of the subjects, 267 men (45.3%) and 423 women (64.6%) had MetS. The prevalence of MetS significantly decreased in relation to increased RHGS in both men and women (F= 35.16, P<0.001 vs. F=31.78,
P<0.001, respectively). The multivariate-adjusted odds ratio (95%CI) in the lowest quartile compared with the highest for MetS was 1.00, 0.74 (0.46–1.21), 0.93 (0.57–1.54), 0.23 (0.13–0.40) in men and 1.00, 0.73 (0.44–1.21), 0.52(0.31–0.85), 0.28 (0.17–0.47) in women for Q1, Q2, Q3, and Q4, respectively (Tables 4 and 5).
DISCUSSION
The current study examined the association between MetS and
Table 3. Relationship between relative handgrip strength and metabolic parame-ters including components of metabolic syndrome
Variable Partial r* (P )
Male (n= 589) Female (n= 655)
WC (cm) –0.338 (< 0.001) –0.396 (< 0.001)
SBP (mmHg) 0.059 (0.451) 0.015 (0.705)
Weight (kg) –0.193 (< 0.001) –0.298 (< 0.001)
FPG (mg/dL) –0.117 (0.004) –0.068 (0.092)
HbA1C (%) –0.126 (0.002) –0.080 (0.041)
TC (mg/dL) –0.106 (0.011) 0.040 (0.314)
TG (mg/dL) –0.073 (0.079) –0.123 (0.002)
HDL-C (mg/dL) 0.229 (0.011) 0.124 (0.002)
Smoking 0.034 (0.420) 0.151 (< 0.001)
Aerobic exercise 0.154 (< 0.001) 0.083 (< 0.038) Strength exercise 0.201 (< 0.001) 0.056 (0.164)
*Pearson's correlation coefficient adjusted for age.
WC, waist circumference; SBP, systolic blood pressure; FPG, fasting plasma glucose;
HbA1C, glycosylated hemoglobin; TC, total cholesterol; TG, triglyceride; HDL-C, high- density lipoprotein cholesterol.
Table 4. Association between relative handgrip strength and prevalence of MetS Characteristics Relative handgrip strength (kg/BMI)
F (P ) Quartile 1 Quartile 2 Quartile 3 Quartile 4
Male (n= 589)* 35.16 (< 0.001)
Non-MetS 69 (21.4) 75 (23.3) 67 (20.8) 111 (34.5) MetS 78 (29.2) 73 (27.3) 80 (30.0) 36 (13.5)
Female (n= 655)† 31.78 (< 0.001)
Non-MetS 37 (15.9) 50 (21.6) 61 (26.3) 84 (36.2) MetS 127 (30.0) 114 (27.0) 102 (24.0) 80 (18.9) Values are presented as number (%).
*Male: quartile 1 (n= 147), quartile 2 (n= 148), quartile 3 (n= 147), quartile 4 (n= 147);
†Female: quartile 1 (n= 164), quartile 2 (n= 164), quartile 3 (n= 163), quartile 4 (n= 164).
MetS, metabolic syndrome; BMI, body mass index.
Table 5. Odds ratio and 95% CI for the metabolic syndrome of subjects according to quartile of relative handgrip strength
Variable Quartile 1 Quartile 2 Quartile 3 Quartile 4 P
Male* (n= 589)
Unadjusted 1 0.91 (0.57–1.45) 0.93 (0.58–1.47) 0.25 (0.14–0.44) < 0.001
Model 1 1 0.73 (0.45–1.16) 0.83 (0.51–1.35) 0.20 (0.12–0.39) 0.024
Model 2 1 0.74 (0.46–1.21) 0.93 (0.57–1.54) 0.23 (0.13–0.40) < 0.001
Female† (n= 655)
Unadjusted 1 0.66 (0.41–1.09) 0.49 (0.30–0.79) 0.28 (0.17–0.45) < 0.001
Model 1 1 0.61 (0.37–0.99) 0.48 (0.30–0.79) 0.25 (0.15–0.41) < 0.001
Model 2 1 0.73 (0.44–1.21) 0.52 (0.31–0.85) 0.28 (0.17–0.47) < 0.001
Values are presented as odds ratio (95% CI). Model 1: adjusted for age, Model 2: adjusted for age, smoking status, education, family income, drinking, aerobic exercise, resistance exercise.
*Male: quartile 1 (n= 147), quartile 2 (n= 148), quartile 3 (n= 147), quartile 4 (n= 147); †Female: quartile 1 (n= 164), quartile 2 (n= 164), quartile 3 (n= 163), quartile 4 (n= 164).
CI, confidence interval.