Changes in Glycogen and Glycosaminoglycan Levels in Hepatocytes of Iduronate-2-Sulfatase Knockout Mice before
and after Recombinant Iduronate-2-Sulfatase Supplementation
Jee Hyun Lee,
1* Yon Ho Choe,
2* Su Jin Kim,
2Kyung Hoon Paik,
2and Dong-Kyu Jin
21Department of Pediatrics, Kangnam Sacred Heart Hospital, Hallym University School of Medicine, Seoul;
2Department of Pediatrics, Samsung Medical Center, Sungkyunkwan University School of Medicine, Seoul, Korea.
Received: January 4, 2010 Revised: June 30, 2010 Accepted: July 23, 2010
Corresponding author: Dr. Dong-Kyu Jin, Department of Pediatrics, Samsung Medical Center, Sungkyunkwan University School of Medicine, 50 Irwon-dong, Gangnam-gu, Seoul 135-710, Korea.
Tel: 82-2-3410-3525, Fax: 82-2-3410-0043 E-mail: [email protected]
*These authors contributed equally to this work.
∙ The authors have no financial conflicts of interest.
© Copyright:
Yonsei University College of Medicine 2011 This is an Open Access article distributed under the terms of the Creative Commons Attribution Non- Commercial License (http://creativecommons.org/
licenses/by-nc/3.0) which permits unrestricted non- commercial use, distribution, and reproduction in any medium, provided the original work is properly cited.
Purpose: Mucopolysaccharidosis II (MPS II) is a lysosomal storage disorder caused by a deficiency of iduronate-2 sulfatase (IdS), which is involved in the deg- radation of glycosaminoglycan (GAG). In this study, the frequency of fasting hy- poglycemia in patients with MPS II was investigated and changes in accumulation of glycogen and GAG in the hepatocytes of IdS-knockout (KO) mice were evalu- ated before and after recombinant IdS enzyme replacement therapy (ERT). Mate- rials and Methods: Plasma glucose levels were evaluated after an 8-hour fast in 50 patients with MPS II. The IdS-KO mice were divided into three groups (group 2; saline, group 3; 0.15 mg/kg of IdS, and group 4; 0.5 mg/kg of IdS); wild-type mice were included as controls (group 1). ERT was initiated intravenously at four weeks of age, and continued every week until 20 weeks of age. Results: The mean glucose level after an 8-hour fast was 94.1 ± 23.7 mg/dL in the patients with MPS II. Two (4%) out of 50 patients had fasting hypoglycemia. For the mice, GAG in the lysosomes nearly disappeared and glycogen particles in the cytoplasm were re- stored to the normal range in group 4. Conclusion: Glucose metabolism in patients with MPS II appeared to function well despite hepatocytic GAG accumulation and hypothetical glycogen depletion. A higher dose of IdS infusion in MPS II mice led to disappearance of lysosomal GAG and restoration of glycogen to the cytoplasm of hepatocytes.
Key Words: Mucopolysaccharidosis II, iduronate-2-sulfatase knockout mice, glyco- gen, glycosaminoglycan, idursulfase supplementation, liver histology
INTRODUCTION
Mucopolysaccharidosis II (MPS II, Hunter syndrome) is a lysosomal storage dis- order; it is caused by a deficiency in the lysosomal enzyme iduronate-2-sulfatase (IdS), which is involved in the degradation of glycosaminoglycan (GAG).1 MPS II is an X-linked recessive disorder and occurs predominantly in males. The accumu- lation of GAG in tissues and organs is responsible for the associated clinical ab- normalities.1 The liver is the primary site of accumulation of GAG; as a result,
10 IdS-KO mice without ERT. In group 3 there were four IdS-KO mice treated with 0.15 mg/kg of IdS, and in group 4, three IdS-KO mice treated by a 0.5 mg/kg IdS infusion.
Enzyme replacement therapy
The recombinant IdS enzymes used in this study were rem- nants of idursulfase (Elaprase®, Shire, Cambridge MA, USA) used for patient treatment. The remnants were used after informed consent was obtained from the parents of the patients. Recombinant IdS was injected into the lateral tail vein of mice in groups 3 and 4. ERT was initiated at 4 weeks of age, and continued every week until 20 weeks of age.
Pathology examinations for GAG and glycogen
At approximately 20 weeks of age, the mice were sacrificed and a comprehensive necropsy was performed. The livers were dissected and fixed in formalin, and made in paraffin block for light microscopic examinataion. The 4-6 μm thick- ness sections were put on glass slides and stained with peri- odic acid-Schiff (PAS) and digested periodic acid-Schiff (d- PAS), which stains tissue glycogen, and colloidal iron, which stains for excessive GAG. A routine pathology ex- amination was performed in a blind manner by the patholo- gist. Under the light microscopic (LM) examination, semi- quantitative verification of the GAG content of Kupffer cells was performed, scoring from absent (0) to global (2) and for the glycogen content of liver tissue, ranging from scanty (0.5) to global (3). The specimens were examined three times by the same pathologist.
Measurements of glycogen weights
The glycogen content of liver tissue was measured indirect- ly using amyloglucosidase digestion of the homogenates of liver tissue and weighing the amount of glucose present.
Electron microscopic examination
For the electron microscopic (EM) examination, the tissue was fixed in 2.5% glutaraldehyde solution, postfixed in 1.5%
osmium tetroxide solution, dehydrated, and fixed firmly into polybed resin. Microthin section and staining with lead ci- trate and uranyl acetated were done. A comparison of the changes in the liver tissue before and after ERT was per- formed by EM examination.
Statistical analysis
A comparison of GAG and glycogen among the groups was analyzed by the Kruskal-Wallis test. To verify differenc- hepatomegaly is an invariable finding in patients with this
disorder.1 Enzyme replacement therapy (ERT) with recom- binant human IdS has been reported to be effective for the treatment of MPS II.2-5 An IdS-knockout (KO) mouse mod- el was constructed to study the effects of ERT on mice with MPS II.
Recently, a patient with MPS II and hypoglycemia was treated; the patient had palpitations, was irritable, and had increased sweating and episodes of syncope. The reduced amount of glycogen in the hepatocytes was thought to cause accumulation of GAG, which might have been responsible for the observed hypoglycemia. This could be explained by the findings of our pilot study, where the liver pathology of IdS-KO mice showed a decreased amount of glycogen in the hepatocytes. To confirm these findings, the frequency of fasting hypoglycemia in patients with MPS II was investi- gated. In addition, changes in accumulation of glycogen and GAG in the hepatocytes of IdS-KO mice before and af- ter recombinant IdS infusion was evaluated.
MATERIALS AND METHODS
Hypoglycemia after an 8-hour fast in patients with MPS II Plasma glucose levels in 50 patients with MPS II were evalu- ated. Hypoglycemia was defined as a plasma glucose con- centration of less than 55 mg/dL.6 The measurements were performed at 8 a.m. after an 8-hour fast. Glucose levels were also measured 2 hours after a meal.
IDS knockout mice
A KO mouse model was developed by Jin, DK, MD (De- partment of Pediatrics, Samsung Medical Center, Sung- kyunkwan University School of Medicine, Seoul, Korea) and was reported previously.7 Briefly, a murine model of Hunter syndrome was prepared by replacing part of the IdS gene, exon 2 and exon 3, with the neomycin resistance gene. Carrier females were bred with male mice with a B6/129 background strain, producing heterogeneous fe- males and hemizygous male knock-out mice, as well as wild-type (WT) male and female littermates. The genotype of all mice used in these experiments was confirmed by polymerase chain reaction of DNA obtained from a tail snip.
Grouping
The animals were categorized into four groups. Eight nor- mal mice were included in group 1. Group 2 consisted of
with ERT (Table 1).
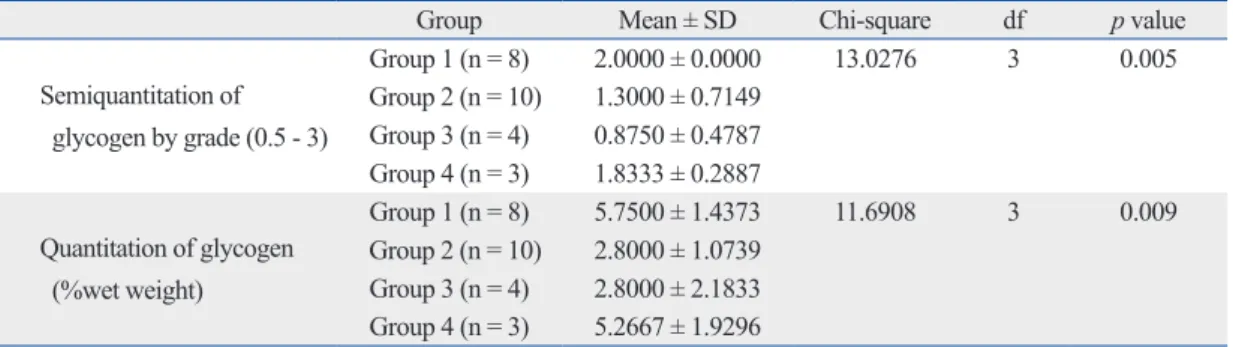
The glycogen content in the cytoplasm of hepatocytes, in the liver tissue of the mice, also differed among the four groups based on the findings of the semiquantitation period- ic acid Schiff positive findings; the findings showed sensi- tivity to diastase digestion (p = 0.005). Group 1 had a higher concentration of glycogen than groups 2 and 3. Comparison between the two treated groups showed that the group with a higher dose of enzyme infusion had higher glycogen con- tent than the group with a lower dose of enzyme infusion by the LSD (Table 2).
Glycogen weights
The fresh liver tissue from the mice was analyzed to deter- mine glycogen content, and compared with the results of the semiquantitation pathology. There were significant dif- ferences in glycogen content among the four groups (p = 0.009)(Table 2). The mean glycogen content of group 1 was 5.75 ± 1.43 wet weight (%), which was more than those of group 2 [2.80 ± 1.07 wet weight (%)] and group 3 [2.80 ± 2.18 wet weight (%)]. The glycogen content for group 4 was 5.27 ± 1.92 wet weight (%). The glycogen wet weights were positively correlated with the results of the histological semiquantitation (p = 0.001, Spearman correla- tion coefficient = 0.74349)
Electron microscopic examination
The ultrastructural findings observed on electron microsco- py were consistent with the light microscopy findings for es among groups, the results were reanalyzed using least sig-
nificant difference (LSD) using ranks. Glycogen wet weight and histological semiquantitation were analyzed using the Spearman rank correlation coefficient.
RESULTS
Hypoglycemia after an 8-hour fast in MPS II patients The mean glucose level after an 8-hour fast was 94.1 ± 23.7 mg/dL. Two (4%) out of 50 patients had fasting hypoglyce- mia. The mean plasma glucose level 2 hours after a meal was 110.9 ± 17.8 mg/dL. The levels were within normal range in all patients.
Pathological findings in the murine model
Upon routine histological examination, there was no signif- icant difference in architecture or inflammatory changes be- fore and after ERT. However, there were changes in GAG and glycogen content. GAG accumulation in liver tissues was compared among the groups, based on semiquantita- tion of colloidal iron staining. There were significant differ- ences in the GAG assay among the groups (p = 0.015).
Group 2 had a higher concentration of GAG compared to the other three groups, based on positive iron colloidal stain- ing. Reduction of GAG content in the treated mice of groups 3 and 4 reflected the effects of ERT. However, there was no difference between groups 3 and 4 based on the dose of en- zyme infusion or between group 1 and the groups treated
Table 1. GAG Comparisons between Groups Using the Kruskal-Wallis Test
Group Mean ± SD Chi-square df p value
Semiquantitation of GAG by grade (0 - 2)
Group 1 (n = 8) 0.6250 ± 0.5175 10.4965 3 0.015
Group 2 (n = 10) 1.4000 ± 0.6325 Group 3 (n = 4) 0.5000 ± 0.5774 Group 4 (n = 3) 0.6667 ± 0.5774 GAG, glycosaminoglycan; df, degree of freedom.
Table 2. Glycogen Comparisons between Groups Using the Kruskal-Wallis Test
Group Mean ± SD Chi-square df p value
Semiquantitation of glycogen by grade (0.5 - 3)
Group 1 (n = 8) 2.0000 ± 0.0000 13.0276 3 0.005
Group 2 (n = 10) 1.3000 ± 0.7149 Group 3 (n = 4) 0.8750 ± 0.4787 Group 4 (n = 3) 1.8333 ± 0.2887 Quantitation of glycogen
(%wet weight)
Group 1 (n = 8) 5.7500 ± 1.4373 11.6908 3 0.009
Group 2 (n = 10) 2.8000 ± 1.0739 Group 3 (n = 4) 2.8000 ± 2.1833 Group 4 (n = 3) 5.2667 ± 1.9296 df, degree of freedom.
patients with MPS II would have hepatic glycogen deple- tion contributing to fasting hypoglycemia. Instead, these findings suggest that glucose metabolism, including hepatic glycogen synthesis and gluconeogenesis, were functioning well despite GAG accumulation and hypothetical glycogen depletion in the MPS II hepatocytes.
The findings from the murine model showed that GAG decreased in both the low and high dose ERT groups; how- ever, glycogen was restored to normal range only in the high dose ERT group, which implies that high dose ERT is required to achieve the desired response. This result is con- sistent with the findings reported by Garcia, et al.,5 where urine GAG levels deceased in a dose-dependent manner.
The reason why GAG semiquantitation assay results in this study did not show a significant difference between groups 3 and 4 might be due to the small number of samples in the two groups.
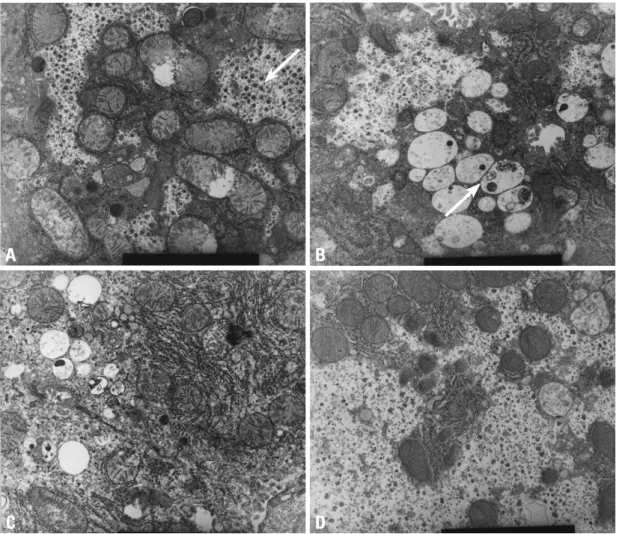
iron colloidal, PAS and d-PAS stains with regards to GAG and glycogen content. Group 2 showed accumulation of GAG in the lysosomes and scanty glycogen content in the cytoplasm. In group 3, the GAG in the lysosomes decreased, but restoration of glycogen in the cytoplasm was not re- markable. However, in group 4, GAG in the lysosomes had nearly disappeared and the glycogen particles in the cyto- plasm were restored (Fig. 1).
DISCUSSION
Most of the patients with MPS II did not have hypoglyce- mia after an 8-hour fast. Even though two patients had fast- ing hypoglycemia, and one of them showed hypoglycemic symptoms, the fasting glucose levels in most patients were normal. This finding was contrary to the expectation that
A
C
B
D
Fig. 1. High power electron microscopic findings (9.0 × 9,000). (A) Wild type: the arrow shows large amounts of glycogen particles in the cytoplasm. (B) MPS II model: the arrow shows accumulation of GAG in lysosomes and scanty glycogen content in the cytoplasm. (C) Low dose ERT group: GAG in the lysosomes decreases but restoration of glycogen in the cytoplasm is not remarkable. (D) High dose ERT group: GAG in the lysosomes nearly disappears and glycogen particles in the cytoplasm are restored. MPS II, mucopolysaccharidosis II;
GAG, glycosaminoglycan; ERT, enzyme replacement therapy.
ERT. Therefore, these findings suggest that ERT can be an effective treatment and should be started as early as possi- ble during childhood.
In conclusion, high dose ERT in MPS II mice led to marked disappearance of lysosomal GAG and restoration of normal levels of glycogen in the cytoplasm of the hepa- tocytes. Normal accumulation of glycogen in hepatocytes is disturbed by the metabolites produced in this storage dis- ease; however, this process is reversible.
REFERENCES
1. Neufeld EF, Muenzer J. The mucopolysaccharidoses. In: Scriver CR, Beaudet AL, Sly WS, Valle D, Childs B, Kinzler KW, et al.
editors. The Metabolic and Molecular Bases of Inherited Disease.
8th ed. New York: McGraw-Hill; 2001. p.3421-52.
2. Muenzer J, Lamsa JC, Garcia A, Dacosta J, Garcia J, Treco DA.
Enzyme replacement therapy in mucopolysaccharidosis type II (Hunter syndrome): a preliminary report. Acta Paediatr Suppl 2002;91:98-9.
3. Muenzer J, Wraith JE, Beck M, Giugliani R, Harmatz P, Eng CM, et al. A phase II/III clinical study of enzyme replacement therapy with idursulfase in mucopolysaccharidosis II (Hunter syndrome).
Genet Med 2006;8:465-73.
4. Muenzer J, Gucsavas-Calikoglu M, McCandless SE, Schuetz TJ, Kimura A. A phase I/II clinical trial of enzyme replacement thera- py in mucopolysaccharidosis II (Hunter syndrome). Mol Genet Metab 2007;90:329-37.
5. Garcia AR, DaCosta JM, Pan J, Muenzer J, Lamsa JC. Preclinical dose ranging studies for enzyme replacement therapy with idur- sulfase in a knock-out mouse model of MPS II. Mol Genet Metab 2007;91:183-90.
6. Huidekoper HH, Duran M, Turkenburg M, Ackermans MT, Sau- erwein HP, Wijburg FA. Fasting adaptation in idiopathic ketotic hypoglycemia: a mismatch between glucose production and de- mand. Eur J Pediatr 2008;167:859-65.
7. Jung SC, Park ES, Choi EN, Kim CH, Kim SJ, Jin DK. Charac- terization of a novel mucopolysaccharidosis type II mouse model and recombinant AAV2/8 vector-mediated gene therapy. Mol Cells 2010;30:13-8.
8. Resnick JM, Whitley CB, Leonard AS, Krivit W, Snover DC.
Light and electron microscopic features of the liver in mucopoly- saccharidosis. Hum Pathol 1994;25:276-86.
9. Parfrey NA, Hutchins GM. Hepatic fibrosis in the mucopolysac- charidoses. Am J Med 1986;81:825-9.
10. Yoshimoto T, Nakamuta M, Kotoh K, Kohjima M, Morizono S, Miyagi Y, et al. An adult case with Hunter’s syndrome presenting prominent hepatic failure: light and electron microscopic features of the liver. Intern Med 2006;45:1133-5.
Resnick, et al.8 reported that the histological findings of liver biopsy samples from 27 MPS cases showed no archi- tectural changes, inflammatory infiltrates, or extensive fi- brosis. The results of this study also showed no specific his- tological changes in liver tissue, except for glycogen content depletion and GAG accumulation in the MPS II murine model.
The results of this study suggest that ERT in MPS II mice may influence hepatocyte glycogen content as well as lyso- somal GAG. However, there is no known relationship be- tween the regulation of synthesis, storage, and degradation of glycogen and the lysosomal accumulation and degrada- tion of GAG in the liver. Therefore, the mechanism by which the amount of glycogen in the cytoplasm appears to be in- versely proportional to the lysosomal GAG, based on the amount of enzyme supplementation, remains unclear. Two possible mechanisms have been proposed: 1) MPS II is as- sociated with GAG accumulation in the lysosomes, result- ing in lysosomal expansion. As GAG accumulates, space for normal glycogen in the cytoplasm is reduced. By con- trast, after ERT, lysosomal GAG disappears and glycogen in the cytoplasm is built up to the level of normal hepato- cytes. 2) Certain metabolites produced in MPS II may block the glycogen synthesis pathway, leading to glycogen deple- tion. After ERT, the metabolites may disappear, restoring normal glucose metabolism, which mediates stimulation of insulin release and glycogen synthesis.
Further studies linking hepatic metabolites produced in MPS II with glycogen metabolism may lead to better un- derstanding of the mechanisms involved in hepatocyte gly- cogen depletion. The murine model did not provide evidence of hepatic fibrosis or cirrhosis. This finding is consistent with the results of Resnick, et al.,8 who reported fibrotic changes in liver biopsy samples from 27 infant MPS cases. Hepatic fibrosis in patients with MPS has been reported in the liter- ature, mainly in adult cases.9,10 Parfrey and Hutchins sug- gested that hepatic fibrosis is due to abnormal accumulation of hepatotoxic metabolites.9 The MPS II murine model in this study showed that liver damage was not significant; ly- sosomal accumulation of GAG and histological changes during were observed in the early stages, but no fibrosis.
Furthermore, histological changes returned to normal after