R E S E A R C H Open Access
Quantification of three-dimensional facial asymmetry for diagnosis and postoperative evaluation of orthognathic surgery
Hua-Lian Cao
1†, Moon-Ho Kang
1,2†, Jin-Yong Lee
3, Won-Jong Park
4, Han-Wool Choung
5and Pill-Hoon Choung
1*Abstract
Background: To evaluate the facial asymmetry, three-dimensional computed tomography (3D-CT) has been used widely. This study proposed a method to quantify facial asymmetry based on 3D-CT.
Methods: The normal standard group consisted of twenty-five male subjects who had a balanced face and normal occlusion. Five anatomical landmarks were selected as reference points and ten anatomical landmarks were selected as measurement points to evaluate facial asymmetry. The formula of facial asymmetry index was designed by using the distances between the landmarks. The index value on a specific landmark indicated zero when the landmarks were located on the three-dimensional symmetric position. As the asymmetry of landmarks increased, the value of facial asymmetry index increased. For ten anatomical landmarks, the mean value of facial asymmetry index on each landmark was obtained in the normal standard group. Facial asymmetry index was applied to the patients who had undergone orthognathic surgery. Preoperative facial asymmetry and postoperative improvement were evaluated.
Results: The reference facial asymmetry index on each landmark in the normal standard group was from 1.77 to 3.38. A polygonal chart was drawn to visualize the degree of asymmetry. In three patients who had undergone orthognathic surgery, it was checked that the method of facial asymmetry index showed the preoperative facial asymmetry and the postoperative improvement well.
Conclusions: The current new facial asymmetry index could efficiently quantify the degree of facial asymmetry from 3D-CT. This method could be used as an evaluation standard for facial asymmetry analysis.
Keywords: Facial asymmetry, Three-dimensional computed tomography, Orthognathic surgery
Background
Posteroanterior (PA) cephalometric analysis has been used as a common method to evaluate facial asymmetry.
However, there are many inherent limitations to evaluate three-dimensional (3D) skull structures by using two- dimensional (2D) X-ray images. Superimposition of mid- facial structures makes it difficult to identify the position
of anatomical landmarks [1, 2]. Head position and pro- jection techniques can affect the distortion of images [3].
Therefore, Grummons et al. reported that frontal ceph- alometric analysis could not be used for either quantita- tive or comparative analysis of facial asymmetry [4].
In 2D analysis of facial asymmetry, the establishment of an accurate reference line is the most important step because the degree of facial asymmetry is determined by the reference lines. Many researchers proposed various reference lines [2, 5, 6]. However, all the proposed refer- ence lines could not be the gold standard. As the refer- ence lines are established according to the clinician ’s
© The Author(s). 2020 Open Access This article is licensed under a Creative Commons Attribution 4.0 International License, which permits use, sharing, adaptation, distribution and reproduction in any medium or format, as long as you give appropriate credit to the original author(s) and the source, provide a link to the Creative Commons licence, and indicate if changes were made. The images or other third party material in this article are included in the article's Creative Commons licence, unless indicated otherwise in a credit line to the material. If material is not included in the article's Creative Commons licence and your intended use is not permitted by statutory regulation or exceeds the permitted use, you will need to obtain permission directly from the copyright holder. To view a copy of this licence, visithttp://creativecommons.org/licenses/by/4.0/.
* Correspondence:
[email protected]†
Hua-Lian Cao and Moon-Ho Kang contributed equally to this work.
1
Department of Oral and Maxillofacial Surgery, Dental Research Institute, School of Dentistry, Seoul National University, 101 Daehak-ro, Jongro-gu, Seoul 03080, South Korea
Full list of author information is available at the end of the article
preferences, distortion of the degree of facial asymmetry by the reference lines cannot be excluded.
As we have got more precise images from the three- dimensional computed tomography (3D-CT), many pro- fessionals have been applied 3D-CT to assess facial asymmetry [7–13].
To assess facial asymmetry based on 3D-CT, various anatomical landmarks, lengths, and angles that were used in 2D analysis have been applied in 3D analysis [11, 14].
Although 2D cephalometric data is accustomed to the or- thodontists and oral and maxillofacial surgeons, the mea- surements which have been used in the cephalometric analysis do not have the same values on the 3D recon- struction model. Some landmarks, such as orbitale and sella, are shown as a line or a point in the space, so these landmarks should be re-defined in 3D skull structures.
Therefore, there should be a new method to evaluate 3D facial asymmetry based on 3D environments [15].
Katsumata et al. proposed the facial asymmetry index based on 3D-CT, and this method had the advantage to represent the degree of 3D facial asymmetry as a numer- ical value [13]. Some other researchers applied and re- vised this method to evaluate the facial asymmetry on the 3D basis [13, 16–18]. To use this method in the treatment planning and postoperative evaluation of orthognathic surgery, reproducible identification of ref- erence landmarks is important because errors in the identification of reference landmarks are considered as the major sources of errors in cephalometric analysis [19]. These studies did not suggest the method that the positional data of reference landmarks, which were iden- tified on the preoperative CT images, were maintained on the follow-up CT images. Additionally, facial asym- metry index in these studies did not represent the direc- tion of facial asymmetry. Therefore, modifications are required for this method to be used for diagnosis and postoperative evaluation of orthognathic surgery.
In many studies, to evaluate facial asymmetry on the 3D basis, three-dimensional reference planes (horizontal, midsagittal, and coronal reference planes) were estab- lished and x,y,z coordinates of the landmarks to the ref- erence planes were used [12, 13, 16, 20–22]. However, the method of establishing reference planes according to the clinician’s preferences could make the same problem which happened in 2D analysis. The use of a coordinate system based on selected reference planes might have greater possibilities of distortion in representing the de- gree of facial asymmetry, so the clinicians should be careful to determine the reference planes.
This study proposed the method to quantify the de- gree of three-dimensional facial asymmetry only by using the distances between the anatomical landmarks. In the normal standard group, the reference facial asymmetry index of ten anatomical landmarks was obtained. This
method was applied to the patients who had undergone orthognathic surgery. It was checked that the facial asymmetry index showed the preoperative facial asym- metry and postoperative improvement well.
Materials and methods Subjects
A group of 25 male patients (mean age, 21.5 years) who had undergone 3D facial CT was selected as the normal standard group. The selection criteria of the normal standard group were described below. All patients had normal occlusion and showed no facial asymmetry on clinical examination by two oral and maxillofacial surgeons (M-H.K and J-Y L). First molars and central in- cisors of the subjects were present and in function. The position of upper dental midline was coincided with the facial midline. The midsagittal plane which passed through nasion, sella, and midpoint of both frontozygo- matic suture points (MidZ) was established. The subjects which had the length of the perpendicular line from menton to the midsagittal plane under 4 mm were in- cluded as the normal standard group [21, 23]. The diag- nosis of the patients was temporomandibular disorder and 3D facial CT images were taken to examine the con- dylar shape and resorption, but the patients who had normal condylar shape and no evidence of resorption were included in this study.
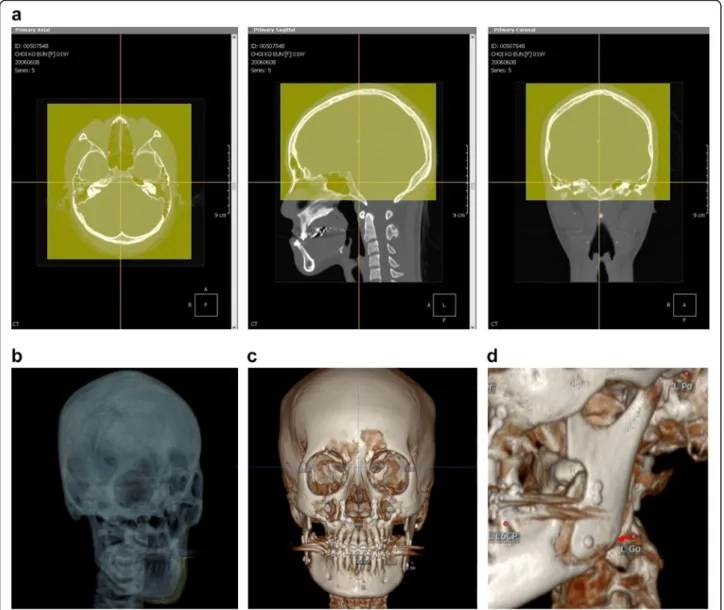
Selection of reference and measurement landmarks The CT machine in this study was Somatom Sensation 10 (Giemens, München, Germany) and the slice thickness in the reformatted images was 1 mm. Five anatomical land- marks—nasion (N), sella (S), frontozygomatic suture point (Z point), midpoint of both Z points (MidZ), and porion (Po)—were selected as reference points (Table 1). Meas- urement points were 10 anatomical landmarks which con- sisted of 5 midsagittal landmarks—anterior nasal spine (ANS), upper incisor (U1), lower incisior (L1), B point, and menton (Me)—and 5 bilateral landmarks—orbitale (Or), condylion (Co), gonion (Go), upper 1st molar (U6), and lower 1st molar (L6). The x,y,z coordinates were ob- tained from the 3D simulation software, InVivo5 (Ana- tomage, Inc., San Jose, USA) (Fig. 1).
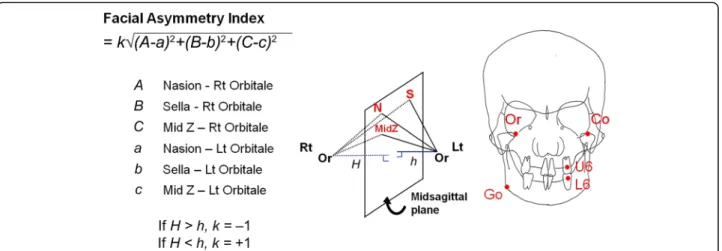
Calculation of facial asymmetry index on the bilateral landmarks
The distances between the reference points and measure-
ment points were calculated. On the bilateral landmarks,
the difference in the distance from each reference land-
mark (sella, nasion, and MidZ) to bilateral measurement
landmarks was calculated and the sum of the square value
of each difference was obtained. The root value of the
sum was defined as facial asymmetry index (Fig. 2). If both
measurement landmarks were on 3 dimensionally
symmetric position to the 3 reference landmarks, facial asymmetry index represented 0. As the difference of three-dimensional position of both bilateral landmarks in- creased, in other words, as the asymmetry increased, the facial asymmetry index increased. The lengths of a per- pendicular line from bilateral landmarks to the plane which passed through the 3 reference landmarks (N, S, and MidZ) were compared and the direction of deviation was defined as the side which had longer perpendicular
line. The formula was designed so that the right deviation had a negative value while the left deviation had a positive value.
Calculation of the facial asymmetry index on the midsagittal landmarks
Frontozygomatic suture point (Z point) and porion (Po) which were located bilaterally on the cranial bone were selected as reference landmarks to get the facial Table 1 Anatomical landmarks
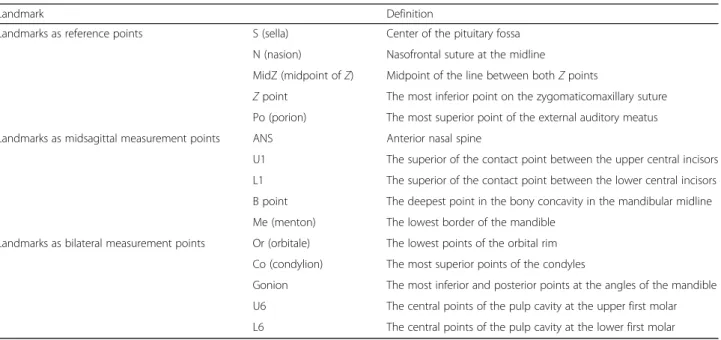
Landmark Definition
Landmarks as reference points S (sella) Center of the pituitary fossa
N (nasion) Nasofrontal suture at the midline
MidZ (midpoint of Z) Midpoint of the line between both Z points
Z point The most inferior point on the zygomaticomaxillary suture Po (porion) The most superior point of the external auditory meatus Landmarks as midsagittal measurement points ANS Anterior nasal spine
U1 The superior of the contact point between the upper central incisors L1 The superior of the contact point between the lower central incisors B point The deepest point in the bony concavity in the mandibular midline Me (menton) The lowest border of the mandible
Landmarks as bilateral measurement points Or (orbitale) The lowest points of the orbital rim Co (condylion) The most superior points of the condyles
Gonion The most inferior and posterior points at the angles of the mandible U6 The central points of the pulp cavity at the upper first molar L6 The central points of the pulp cavity at the lower first molar
Fig. 1 The x,y,z coordinate data of 5 reference landmarks—nasion, sella, midpoint of both Z points, frontozygomatic suture point, and porion—and 10
measurement landmarks were obtained by using 3D simulation software
asymmetry index on the midsagittal landmarks. The dif- ference of the distances between 2 reference points and 5 measurement points was measured. The sum of the square value of each difference was obtained. The root value of the sum was defined as facial asymmetry index on the midsagittal landmarks. The formula was designed so that the right deviation had a negative value while the left deviation had a positive value (Fig. 3).
Clinical application of facial asymmetry index
For the application of facial asymmetry index to evaluate the postoperative changes of the patients, serial 3D-CT
images of the same patient should be taken. For an accur- ate evaluation, the position of reference point which was selected on the preoperative CT images should be main- tained on the postoperative CT images. 3D simulation software, OnDemand 3D (Cybermed, Inc., Seoul, Korea), was used for this purpose. In the VCeph 3D module of this software, serial 3D-CT data were superimposed auto- matically on the best fit of cranial base structures by using volume registration [20, 24]. Three-dimensional position of landmarks that were selected on preoperative CT im- ages was saved and loaded on postoperative CT images.
Therefore, measurement landmarks can be identified on
Fig. 2 Calculation of facial asymmetry index on orbitale (Or). The formula was designed to show the degree of facial asymmetry by using the difference between the distances from the reference point to bilateral measurement landmarks. If both orbitales were on 3 dimensionally symmetric positions to the 3 reference landmarks (nasion, sella, MidZ), the value of facial asymmetry index was 0. As the asymmetry of both orbitales increased, the facial asymmetry index on orbitale increased. The formula was designed so that the right deviation had a negative value while the left deviation had a positive value. The facial asymmetry indices were calculated on the 5 bilateral landmarks —orbitale (Or), condylion (Co), gonion (Go), upper 1st molar (U6), lower 1st molar (L6)
Fig. 3 Calculation of facial asymmetry index on ANS. The differences of distances between 2 reference points —frontozygomatic suture point (Z point)
and porion (Po) —and ANS were measured. The sum of the square value of each difference was obtained, and we defined the root value of the sum
was defined as facial asymmetry index on the midsagottal landmarks. If ANS was on the true midsagittal plane, the facial asymmetry index indicated 0
postoperative CT images without positional change of 5 reference landmarks. Therefore, observer-dependent error, which happened between the serial CT images, can be excluded (Fig. 4). In case there were positional changes of landmarks by surgery, the positions of measurement landmarks were moved to the new positions on the soft- ware and the coordinate data of the new position were saved (Fig. 4).
In this study, all the personal information was erased from the CT data except gender and age. All the CT data were changed to the anonymized files. After this procedure, these files were used for this study. This study was reviewed and approved by the institutional
review board at School of Dentistry, Seoul National Uni- versity, Seoul, Korea (No.S-D20120009).
Reliability of facial asymmetry index
To prevent the inter-observer error, all measurements were performed by one author (M-H.K). To evaluate the reproducibility of facial asymmetry index, 10 patients were selected randomly from the control group. One hundred facial asymmetry indices from 10 patients were measured twice during an interval of 2 weeks. A paried t test between double measurements was performed with SPSS for Windows (version 17.0, SPSS Inc., Chicago, USA). The method errors were calculated according to
Fig. 4 In three-dimensional simulation software, serial 3D-CT data were superimposed automatically on the best fit of cranial base structures by
using volume registration (a, b). Three-dimensional positions of landmarks which were selected on preoperative CT images were saved and
loaded on postoperative CT images (c). If the positions of measurement landmarks were changed after surgery, it can be moved to the new
position on the software and the new coordinate data can be saved without the positional change of reference landmarks (d)
the formula SE = √(∑d
2/2n) (d is the difference between double measurements and n is the number of paired double measurements) [25].
Results
The intra-observer precision error of facial asymmetry index was 0.56. There was no significant difference be- tween the original and repeated measurements in facial asymmetry index (p = 0.7567).
Normal standard group
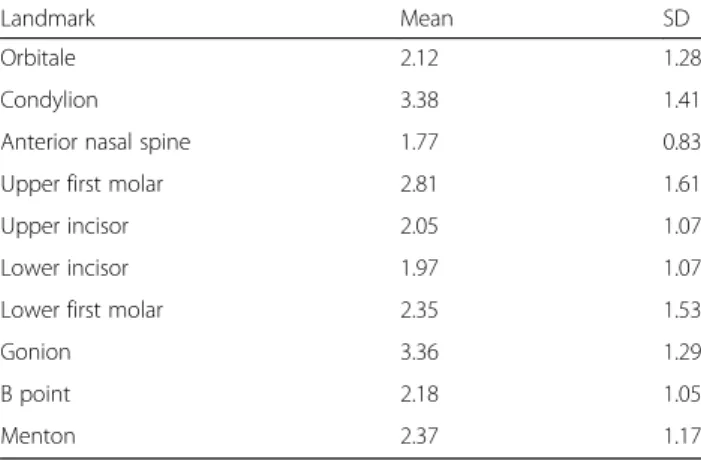
The facial asymmetry indices were calculated on 10 ana- tomical landmarks. The absolute value of asymmetry in- dices ranged from 1.77 to 3.38 (Table 2). The asymmetry index of condylion was the largest, while the asymmetry index of anterior nasal spine (ANS) was the smallest.
The polygonal chart of the reference facial asymmetry index was drawn for visualization. The inner green line indicated the mean asymmetry indices and the outer light green line indicated the mean plus the standard de- viation value (p = 0.05). The green and light green areas were defined as facial symmetry and the outer gray area was defined as facial asymmetry. The right side deviation had negative value, while the left side deviation had posi- tive value (Fig. 5).
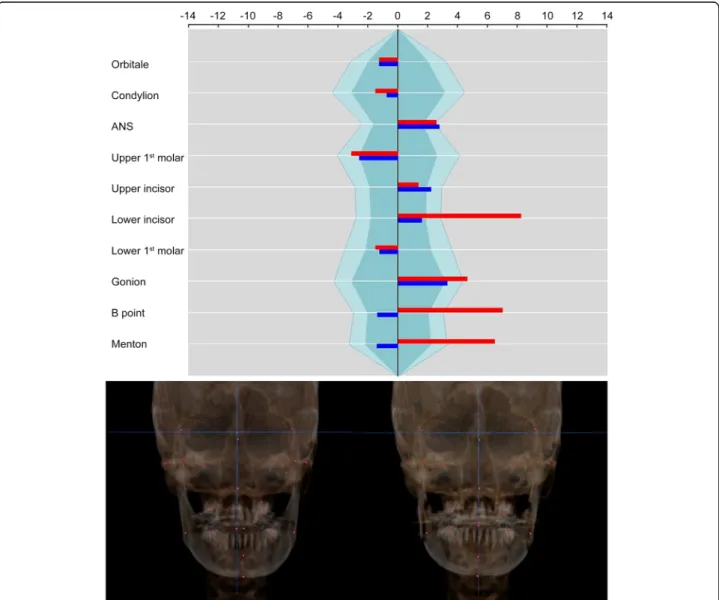
Clinical application of facial asymmetry index Case 1
The patient was a 20-year-old female with mandibular prognathism and facial asymmetry. Mandible was devi- ated to the left side by 3 mm and maxillary canting was
not found on clinical examination. She underwent orthognathic surgery which consisted of Le FortIosteot- omy and intraoral vertico-sagittal split ramus osteotomy (IVSRO). The surgical plan included 3 mm of advance- ment and 2 mm of superior impaction of the maxilla and asymmetric setback surgery of the mandible (right side, 11 mm; left side, 5 mm) and grinding of chin point.
Facial asymmetry index on orbitale was not changed be- cause the surgery did not include the orbital area and the 3D positions of reference landmarks were main- tained on the postoperative images. On the maxillary landmarks, the asymmetry indices almost did not change on ANS, U6, and U1. It was because the maxillary sur- gery did not include midline correction or canting cor- rection. On the other side, the facial asymmetry indices Table 2 Reference facial asymmetry index in the normal standard group ( n = 25, absolute value)
Landmark Mean SD
Orbitale 2.12 1.28
Condylion 3.38 1.41
Anterior nasal spine 1.77 0.83
Upper first molar 2.81 1.61
Upper incisor 2.05 1.07
Lower incisor 1.97 1.07
Lower first molar 2.35 1.53
Gonion 3.36 1.29
B point 2.18 1.05
Menton 2.37 1.17
Fig. 5 Polygonal chart of the reference facial asymmetry index. The inner green area indicates the mean asymmetry indices and the outer light
green area indicates the mean plus the standard deviation value ( p = 0.05). Right side deviation has a negative value, while left side deviation has
a positive value
on mandibular landmarks were greatly changed on L1 (from 8.56 to 1.65), B point (from 7.28 to − 1.45), and Me (from 6.74 to − 1.48) (Fig. 6). It showed that man- dibular asymmetry was improved by asymmetric setback surgery.
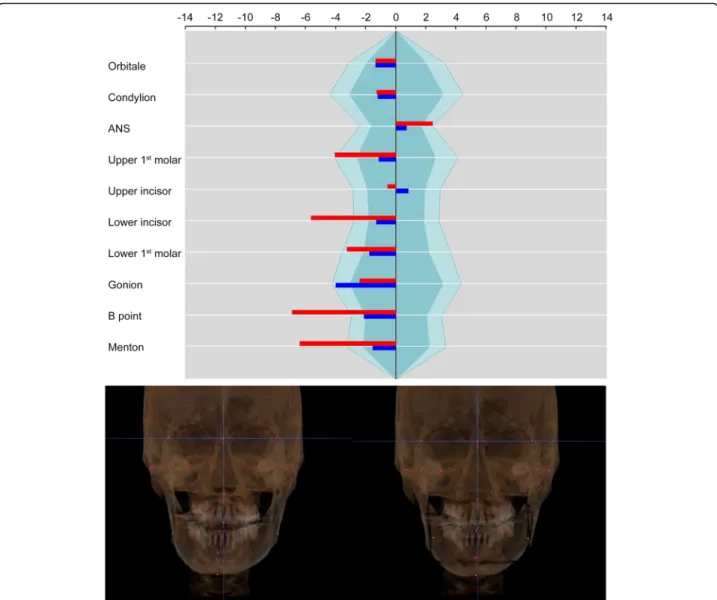
Case 2
The patient was a 26-year-old male with mandibular prog- nathism and facial asymmetry. Three millimeters of maxillary canting was present, which the right side was longer than the left side. Maxillary midline was deviated to the right side by 2 mm and the mandible was deviated to the right side by 5 mm. The surgical movement of maxillary surgery consisted that 3 mm of canting correction, 4 mm of posterior impac- tion, and midline correction to the left side by 1.5 mm. For
mandible, asymmetric setback (right side, 12 mm; left side, 18 mm) and advancement genioplasty were done. On the maxillary landmarks, the asymmetry index on U6 was im- proved from − 3.75 to − 1.05 by canting correction, and the asymmetry index on U1 was changed from − 0.53 to 0.76 by midline correction. The asymmetry indices on mandibular landmarks were improved on L1(from − 5.22 to − 1.22), B point (from − 6.38 to − 1.98), and Me (from − 5.90 to − 1.44) (Fig. 7).
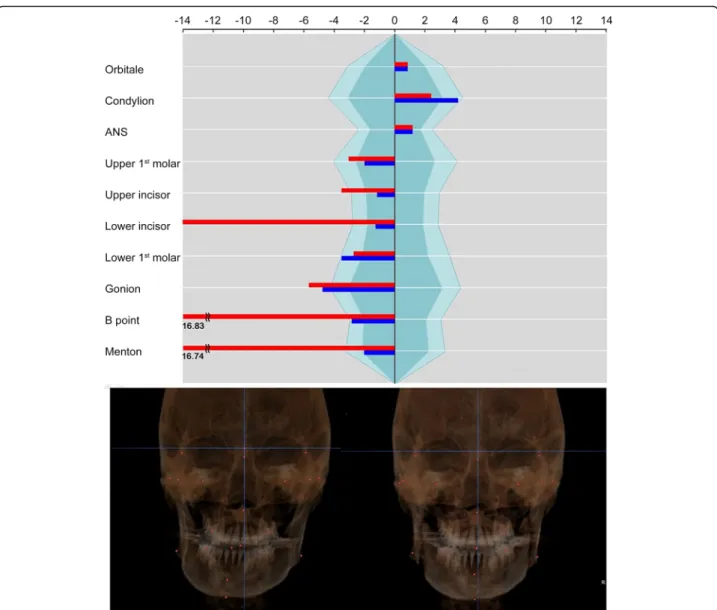
Case 3
The patient was a 25-year-old male with severe facial asymmetry and mandibular prognathism. On clinical examination, the maxillary midline was deviated to the right side by 2 mm. The mandible was deviated to the
Fig. 6 Polygonal chart and 3D reconstruction images of case 1. The asymmetry index on orbitale was not changed because the 3D coordinate
data of reference landmarks were maintained on the postoperative images. Asymmetry indices on maxillary landmarks almost did not change
because the maxillary surgery did not include the canting correction or midline correction. Asymmetry indices on mandibular landmarks were
greatly improved (red: before surgery, blue: after surgery)
right side by 7 mm. Three-millimeter canting of the max- illa was present, which the left side of the maxilla was lon- ger than the right side. The surgical movement of maxillary surgery consisted 3 mm of canting correction, 2 mm of posterior impaction, and 2 mm of midline correc- tion to the left side. For the mandible, asymmetric correc- tion via IVSRO (right side, advance 1 mm; left side, setback 11.5 mm) was done. On the maxillary landmarks, the asymmetry indices were improved on U6 (from − 3.04 to − 2.00) and U1 (from − 3.52 to − 1.17). The asymmetry indices on mandibular landmarks were greatly improved on L1 (from − 14.00 to − 1.25), B point (from − 16.83 to − 2.83), and Me (from − 16.74 to − 2.03) (Fig. 8).
Discussion
Basic treatment goal in patients with facial asymmetry is the correction of the deviated midline of the maxilla, mandible,
and chin point. On the other hand, Yanez-Vico et al. re- ported that the angle of the mandibular ramus, on both frontal and lateral planes, determined apparent facial asym- metry [17]. Hwang et al. also commented that some patients complained of mandibular asymmetry even after successful correction of chin deviation, so the operators should pay at- tention to the improvement of the condylar axis, such as frontal and lateral ramal inclination [11]. Because there are a lot of limitations to evaluate 3D skull morphology by using frontal and lateral cephalometric X-rays, for successful cor- rection of facial asymmetry, 3D evaluation of facial asym- metry by using 3D-CT is necessary. Various methods have been reported to evaluate facial asymmetry based on 3D-CT.
Damstra et al. suggested a combined 3D and mirror-image analysis for the diagnosis of facial asymmetry [26]. The others reported the evaluation method using facial asymmetry index [13, 16, 17].
Fig. 7 Case 2. The asymmetry index on U6 and U1 was improved by canting correction and midline correction of the maxilla. Mandibular
asymmetry was improved by asymmetric setback surgery (red: before surgery, blue: after surgery)
To use these methods, identifying reference land- marks and establishing appropriate reference planes are crucial steps for the evaluation of facial asym- metry. In 3D environments, when the reference planes are established, clinicians should consider not only the horizontal and vertical position of reference planes, but also the rotational position such as yaw, pitch, and roll [27].
Yanez-Vico et al. used mid-dorsal position of the for- amen magnum, bilateral points of the external auditory meatus, and foramen spinosums which were located in the middle and posterior cranial base because they thought this area might be the most stable area during development [17].
Katsumata et al. used the plane which passed through sella, nasion, and dent as a midsagittal reference plane
[13]. And two more planes perpendicular to this midsag- ittal plane were selected as horizontal and coronal refer- ence planes.
In this study, nasion, sella, and MidZ were selected as the midsagittal reference points. MidZ was used as a reference point instead of basion or dent. If the landmarks like basion and dent which were located on the posterior part of the cranium were selected as the reference points, posterior cranial bone asym- metry could affect the evaluation of anterior man- dibular asymmetry, such as chin point deviation. In PA cephalometric analysis, Trpkova et al. reported that the perpendicular line through midpoints be- tween pairs of orbital landmarks showed excellent val- idity as the vertical reference line [2]. In CBCT analysis, Park et al. used bilateral Z points and
Fig. 8 Case 3. The asymmetry index on U1 was improved by midline correction of the maxilla. Severe mandibular asymmetry was improved, but
asymmetry on gonion remained (red: before surgery, blue: after surgery)
orbitale in 3D reconstruction images and reported that the transverse reference line using these land- marks might be used even in patients with a severe asymmetry of the maxilla when this was used with reference to the clinical photos [28]. If the clinicians chose the posterior cranial landmarks as reference landmarks, it is difficult for clinicians to use them on clinical examination because they cannot see and measure the landmarks. If the clinicians used orbital landmarks as reference landmarks, the clinicians are able to compare the degree of asymmetry on CT im- ages with that on clinical examination and photos. If the patient has obvious asymmetry in the orbital area, it is better to allow orbital asymmetry in setting the reference plane rather than using posterior cranial landmarks.
Therefore, the authors used MidZ as a midsagittal ref- erence point instead of posterior cranial bone landmarks like basion or dent.
To define the inclusion criteria for the control group, previous researches about PA cephalometric analysis were used. Some researchers showed that the critical distance of menton that distinguished symmetry from asymmetry was approximately 4 mm [21, 23]. So, in this study, the patients who had the length of the perpen- dicular line from menton to the Na-S-MidZ plane under 4 mm were included as the control group.
Kwon et al. proposed the similarity index to evaluate three-dimensional asymmetry [29]. They evaluated the symmetry of the mandible using a mirror image. When overlapping the left and right of the mandible, the over- lapping part is expressed by similarity index. The closer the similarity index is to zero, the more symmetrical it is. This is also a good way to evaluate facial symmetry.
However, this method evaluates symmetry by dividing the mandible into two parts, ramus and body. Therefore, there is a limit in evaluating which anatomical land- marks have asymmetry.
To evaluate the preoperative facial asymmetry and postoperative improvement, reproducible identification of the landmarks is important [30]. In the studies of Kat- sumata and Yanez-Vico, there is no solution how to maintain the positional data of reference landmarks on the serial CT images. If the reference landmarks should be re-identified on the follow-up CT images, the index value of landmarks, such as orbitale, which were not changed by the treatment could be changed. Therefore, errors in identifying the landmarks and the change fol- lowing the treatment could be mixed and represented as an index. Therefore, it may adversely affect the accuracy of the evaluation.
In this study, superimposition of serial CT images was done on the best fit of cranial base structures. In the VCeph 3D module of OnDemand 3D software, the
positional data of selected landmarks on the preopera- tive CT images were saved and loaded on the postopera- tive CT images. Therefore, the position of reference landmarks was maintained on the postoperative 3D model. The measurement landmarks, which were chan- ged following surgery, were moved to the new position on the postoperative 3D model, and the new positions were also checked on the multiplanar reconstruction (MPR) images. This method was able to minimize the error of identifying the landmarks in the follow-up CT images and improve the accuracy of postoperative evaluation.
Conclusions
In this study, the current new facial asymmetry index was proposed and it could efficiently quantify the degree of facial asymmetry from 3D-CT. This method could be used as an evaluation standard for facial asymmetry analysis.
Abbreviations
FAI: Facial asymmetry index; 3D-CT: Three-dimensional computed tomography
Acknowledgements
We would also like to thank Prof. Byoung-Moo Seo and Dr. Dong-Ju Kwon, for their support to gather and use the CT data. We would like to thank Dr.
Jeong-Ho Choi, an orthodontist and the developer of the OnDemand 3D software, for his help and comments.
Authors ’ contributions
H-L C and M-H K contributed equally. HC, M-H K, and P-H C designed the study and wrote the manuscript. J-Y L prepared the control CT data. W-J P and H-W C did the repeated measurements. P-H C revised and corrected the manuscript. The authors read and approved the final manuscript.
Funding No funding
Availability of data and materials
The datasets used during the current study are available from the corresponding author on reasonable request.
Ethics approval and consent to participate
This study was performed in accordance with the Declaration of Helsinki for medical protocols. This study was reviewed and approved by the institutional review board at School of Dentistry, Seoul National University, Seoul, Korea (No.S-D20120009).
Consent for publication Not applicable
Competing interests None declared
Author details
1
Department of Oral and Maxillofacial Surgery, Dental Research Institute, School of Dentistry, Seoul National University, 101 Daehak-ro, Jongro-gu, Seoul 03080, South Korea.
2Onsam Dental Clinic, Seoul, South Korea.
3Seoul Sarang Dental Clinic, Seoul, South Korea.
4Department of Oral and Maxillofacial Surgery, Wonkwang University Hospital, Iksan, South Korea.
5