pISSN:1225-4207 eISSN: 2233-7296
Original Article
RECEIVED September 13, 2013, REVISED October 1, 2013, ACCEPTED November 26, 2013 Correspondence to Insan Jang
Department of Orthodontics, College of Dentistry, Gangneung-Wonju National University 7 Jukheon-gil, Gangneung 210-702, Korea
Tel: 82-33-640-2762, Fax: 82-33-640-3057, E-mail: [email protected]
CC
This is an open access article distributed under the terms of the Creative Commons Attribution Non-Commercial License (http://creativecommons.org/licenses/
by-nc/3.0) which permits unrestricted non-commercial use, distribution, and reproduction in any medium, provided the original work is properly cited.
Three-dimensional Assessment of Facial Soft Tissue after Orthognathic Surgery in Patients with Skeletal
Class III and Asymmetry
Jong-Hyeon Lee, Dong-Soon Choi, Bong-Kuen Cha, Young-Wook Park 1 , Insan Jang
Departments of Orthodontics and
1Oral and Maxillofacial Surgery, College of Dentistry, Gangneung-Wonju National University
Abstract
Purpose: The purpose of this study was to perform three-dimensional (3D) assessment of facial soft tissue in patients with skeletal Class III and mandibular asymmetry after orthognathic surgery.
Methods: Samples consisted of 3D facial images obtained from five patients with A point-nasion-B point angle less than 2 degrees, and more than 5 mm of menton deviation. All patients had been treated at Gangneung-Wonju National University Dental Hospital from 2009 to 2012. They had undergone orthognathic surgery of Lefort I, and sagittal split osteotomy for correction of skeletal deformity, and orthodontic treatment. Facial scanning was performed before treatment (T1) and post-surgical orthodontic treatment (T2). Linear and angle variables of soft tissue landmarks, antero-posterior facial depth, and facial volume were measured.
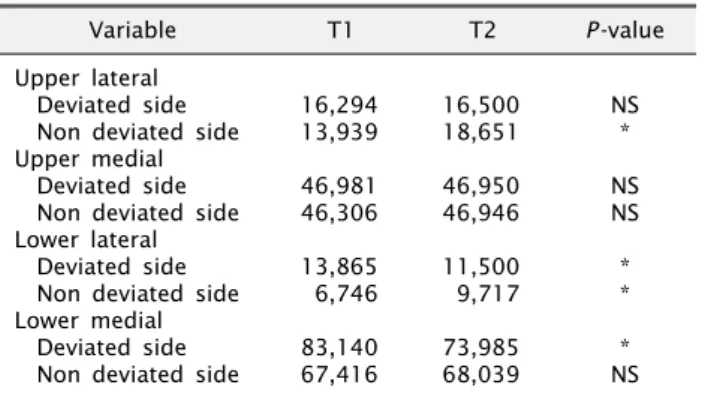
Results: No significant differences in width of the alar base, mouth width, and nasal canting were observed between T1 and T2. However, lip deviation, menton deviation, alar canting, lip canting, and menton deviation angle were significantly reduced at T2. Antero-posterior facial depth on the axial plane parallel to the left cheilion was significantly reduced on the deviated side and significantly increased on the non-deviated side at T2. Volume of the lower lateral and lower medial parts of the face was reduced on the deviated side, and volume of upper lateral and lower lateral parts on the non-deviated side was significantly increased at T2.
Conclusion: After orthognathic surgery, facial asymmetry of soft tissue was improved following skeletal changes, especially the mandibular region. Although the length of the alar base and mouth width did not change, lip and soft tissue menton were displaced to the medial side after treatment. Facial depth also became symmetric after treatment. Facial volume showed a decrease on the lower part of the deviated side and that on lateral parts of the non-deviated side showed an increase after treatment.
Key words: Three-dimensional imaging, Laser scanning, Facial asymmetry, Orthognathic surgery
Introduction
The profile of facial soft tissue could be changed by orthodontic treatment or orthognathic surgery. Especially
in patients with skeletal deformity and asymmetry, facial
soft tissue after orthognathic surgery is definitely different
from that of before treatment. Conventionally, facial soft
tissue has been evaluated by cephalograms or photographs
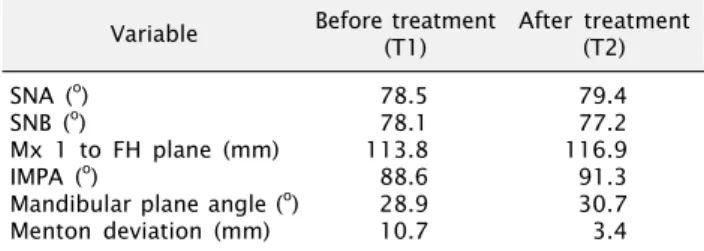
Table 1. Cephalometric measurements of the patients (n=5) Variable Before treatment
(T1) After treatment (T2) SNA (
o)
SNB (
o)
Mx 1 to FH plane (mm) IMPA (
o)
Mandibular plane angle (
o) Menton deviation (mm)
78.5 78.1 113.8 88.6 28.9 10.7
79.4 77.2 116.9 91.3 30.7 3.4 SNA, sella-nasion-A point angle; SNB, sella-nasion-B point angle;
Mx 1, axis of maxillary central incisor; FH plane, Frankfort horizontal plane; IMPA, lower incisor-mandibular plane angle.
taken from frontal or sagittal views, from that, only the facial profile projected on a two-dimensional plane can be detected[1]. These methods have limitations for assess- ment of soft tissue that changes with complexity and three-dimensionally[2].
Several techniques[3-8], such as three-dimensional (3D) photogrammetry, laser surface scanning, and cone-beam computed tomography (CBCT), have been developed for 3D analysis of soft-tissue. However, patients’ heads are usually held with a strap on the forehead or a chin support, or patients are lying down when taking CBCT, which caus- es deformation of soft tissue of the forehead, chin, or lips.
On the other hand, the 3D surface scanning system is non- invasive to patients, and is an alternative for generation of 3D computerized images providing 3D information on soft tissue without deformity on the forehead, chin, or lips by a strap or chin support.
3D analysis of facial soft tissue has been attempted in patients who had undergone maxillofacial surgery[6,9-11].
Soncul and Bamber[6] evaluated facial soft tissue of patients with skeletal Class III and dentoskeletal deformity after orthognathic surgery; however, facial symmetry was not assessed. Hajeer et al .[9], Sforza et al .[10,11] analyzed sym- metry of facial soft tissue after surgery with mirror image or evaluated the linear and angular variables on the coronal plane.
Few previous studies evaluating the symmetry of facial soft tissue after orthognathic surgery in 3D planes and the effect of skeletal movement on the maxillary and man- dibular facial soft tissue have been reported. The purpose of this study was to perform 3D assessment of facial soft tissue in patients with skeletal Class III and mandibular asymmetry after orthodontic and orthognathic surgery.
Materials and Methods
1. Patients
Samples consisted of 3D facial images obtained from five patients (two females, three males) with skeletal Class III and moderate to severe asymmetry in the mandible.
All patients had been treated at Gangneung-Wonju National University Dental Hospital from 2009 to 2012. Inclusion criteria were as follows: (1) adult patients; (2) A point-nasio-
na-B point angle was less than 2
o; (3) menton was deviated more than 5 mm on the postero-anterior cephalograms;
and (4) patients had undergone pre-surgical orthodontic treatment, Lefort I osteotomy and sagittal split osteotomy with mandibular reduction for correction of the skeletal deformity, and post-surgical orthodontic treatment. Mean age of patients before treatment was 18.6 years, and two of them had deviation of the mandible to the right and the others to the left. Data from cephalometric analysis before treatment (T1) and after post-surgical orthodontic treatment (T2) are shown in Table 1. This study was re- viewed and approved by the Institutional Review Board at the Gangneung-Wonju National University Dental Hospital (IRB 2010-1-7), and was supported by Scientific Research (SR1001) of Gangneung-Wonju National University Dental Hospital.
2. Three-dimensional facial scanning
Facial scanning was performed at T1 and T2 using a Rexcan III 3D scanner (Solutionix Corp., Seoul, Korea).
The scanning system consisted of two high resolution charge coupled device cameras. Focal length of the camera lens was 12.5 mm and the cameras were placed 1,340 mm from the patients. The patients were instructed to lean back in their chairs while relaxed, lips in slight contact, and eyes lightly closed. Their faces were scanned from frontal and lateral views in order to avoid undercut.
Scanning data were merged and 3D facial images were reconstructed using ezScan software (Solutionix Corp.). The 3D images were imported as stereolithography (STL) files to the reverse modeling software program, RapidForm XOR/REDESIGN 3 (INUS Technology Inc., Seoul, Korea) for superimposition and measurement.
The 3D facial images at T1 and T2 were initially super-
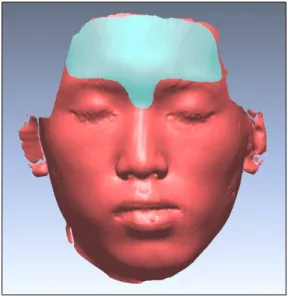
Fig. 1. Reference area for superimposition of three-dimensional facial images.
Fig. 2. Coordinate system of a three-dimensional facial image.
A, axial reference plane; B, saggital reference plane; C, coronal reference plane; N', soft tissue nasion.
Fig. 3. Soft tissue landmarks used in this study. N’, soft tissue nasion; prn, pronasale; sn, subnasale; ls, labilae superius; li, labilae inferius; me, soft tissue menton; Rt. ex, right exocanthion;
Lt. ex, left exocanthion; Rt. tr, right tragion; Lt. tr, left tragion;
Rt. al, right alare; Lt. al, left alare; Rt. ch, right cheilion; Lt. ch, left cheilion.
imposed on five landmarks of the bilateral outer and inner canthus of the eyes and the soft tissue nasion. Fine registra- tion was performed on the forehead and nasal root area, including soft tissue nasion using the best-fit method, where they were considered stable after orthodontic treat- ment and orthognathic surgery (Fig. 1). As shown in Fig.
2, the coordinate system was established on 3D facial im- ages of T1 with the soft tissue nasion (N’) as the origin (0, 0, 0). The axial plane was established by rotation and translation of Camper’s plane[12]. First, Camper’s plane passing through the nasal alar and bilateral tragus was ro- tated 7.5
oupward on the axis formed by the bilateral
tragus. Subsequently, the plane was translated to pass through N’. The sagittal plane was defined as the plane perpendicular to the axial plane and passing though N’
and the midpoint of the bilateral tragus. The coronal plane passed through N’, and perpendicular to the axial and sag- ittal planes (Fig. 2).
3. Measurements on three-dimensional facial images
As shown in Fig. 3, the soft tissue landmarks were identi- fied on 3D images. Identification of landmarks and meas- urements was performed by one examiner (L.J.H.). The following variables were measured for quantification of asymmetry of facial soft tissue: (1) the five linear and four angular variables on the coronal plane; (2) the ante- ro-posterior facial depth on the axial plane; and (3) volume of facial soft tissue.
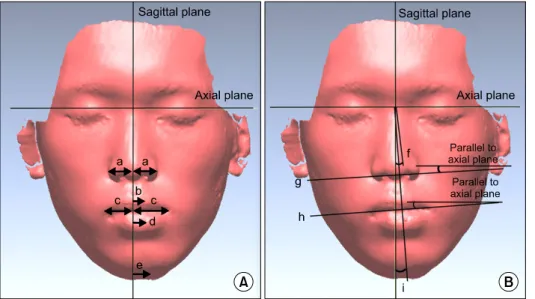
Alar base width, upper lip deviation, mouth width, lower
lip deviation, menton deviation, nasal canting, alar canting,
lip canting, and menton deviation angle were measured
on the coronal plane (Fig. 4, Table 2). The 3D geometry
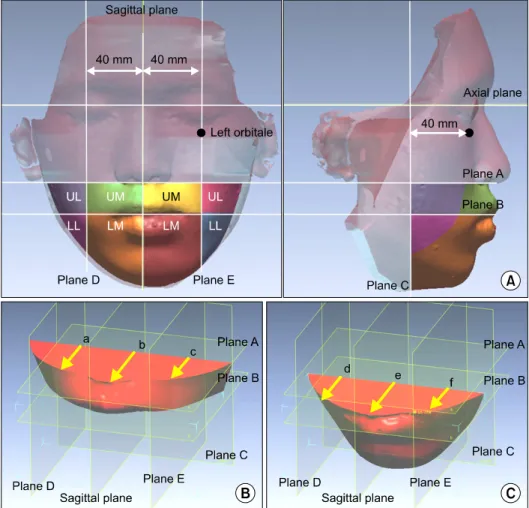
of the lower facial third was constructed and divided into
upper lateral (UL), upper medial (UM), lower lateral (LL),
and lower medial (LM) parts (Fig. 5). Antero-posterior fa-
cial depth was measured on two planes parallel to the
axial plane passing through the subnasale (plane A), and
Fig. 4. Linear (A) and angular (B) variables on the coronal plane. a, alar base width; b, upper lip deviation;
c, mouth width; d, lower lip deviation;
e, menton deviation; f, nasal canting;
g, alar canting; h, lip canting; i, menton deviation angle.
Table 2. Linear and angular measuring variables on the coronal plane
Variable Definition
Linear measurements (mm) Alar base width
Mouth width Upper lip deviation
aLower lip deviation
aMenton deviation
aAngular measurements (
o) Nasal canting
aAlar canting
bLip canting
bMenton deviation angle
aDistance from alare to the sagittal reference plane Distance from cheilion to the sagittal reference plane The variable in the x axis of labiale superius The variable in the x axis of labiale inferius The variable in the x axis of soft tissue menton
Angle between the line connecting nasion and pronasale and the sagittal reference plane Angle between the line connecting bilateral alares and the axial reference plane
Angle between the line connecting bilateral cheilions and the axial horizontal plane Angle between the line connecting subnasale and menton and the sagittal reference plane
a
Positive value indicates deviation to the deviated side, and negative to the non-deviated side.
bPositive value indicates canting with the deviated side up, and negative means non-deviated side up.
the plane passing through the left cheilion (plane B).
Volume of the 3D geometries of UL, UM, LL, and LM was measured, and the asymmetry index, which was defined as the following formula, was calculated. The closer to zero of the asymmetry index, the more symmetric the facial volume is: Asymmetry index=(volume of deviated side–vol- ume of non-deviated side)/(volume of deviated side+vol- ume of non-deviated side)×100.
All measurements are expressed as mean, and the Wilcoxon signed rank test was used for comparison of the measurement at T1 and T2, and for comparison of the deviated and non-deviated sides. Statistical analyses were performed using SPSS software (PASW Statistics 18.0;
IBM Co., Armonk, NY, USA) and probability values less than 0.05 were considered statistically significant.
Results
Although the width of the alar base showed a significant increase on the deviated side at T2, no significant difference in the width of the alar base on the non-deviated side and mouth width on the deviated and non-deviated sides was observed between T1 and T2. Mean of upper and lower lip deviation was 1.7 mm and 4.4 mm at T1 and showed a significant decrease at T2 as 0.7 mm, 1.6 mm.
Menton deviation also showed a definite reduction at T2,
from 10.2 to 2.9 mm (Table 3). Nasal canting was close
to zero at T1 and T2. The other angular measurements
of alar canting, lip canting, and menton deviation angle
showed a significant decrease at T2. However, lip canting
and menton deviation angle was 1.1
oand 2.0
oat T2, which
means that facial asymmetry had still left to the deviated
side (Table 4).
Fig. 5. Three-dimensional (3D) geometries of the lower facial third.
(A) 3D geometries of upper lateral (UL), upper medial (UM), lower lateral (LL), lower medial (LM). (B, C) Facial depth measured on plane A and plane B; plane C, the plane perpendicular to sagittal and axial reference planes and 40 mm posterior to the left orbitale; plane D and plane E, bilateral planes parallel and 40 mm apart from the sagittal reference plane; a~f, facial depth on the deviated side, center, and non-deviated side.
Table 3. Linear measurements of soft tissue landmarks (mm)
Variable T1 T2 P -value
Alar base width Deviated side Non deviated side Mouth width Deviated side Non deviated side Upper lip deviation
aLower lip deviation
aMenton deviation
a19.2 18.9 27.4 21.3 1.7 4.4 10.2
20.2 19.7 25.1 23.3 0.7 1.6 2.9
* NS NS NS
*
*
*
*P<0.05.
T1, before treatment; T2, after treatment; NS, not significant.
a
Positive value indicates deviation to the deviated side.
Table 4. Angular measurements of soft tissue landmarks (
o)
Variable T1 T2 P -value
Nasal canting
aAlar canting
aLip canting
aMenton deviation angle
b0.0 1.9 2.8 8.2
0.1 0.1 1.1 2.0
NS
*
*
*
*P<0.05.
T1, before treatment; T2, after treatment; NS, not significant.
a