Threedimensional soft tissue analysis for the evaluation of facial asymmetry in normal occlusion individuals
Objective: To identify the right and left difference of the facial soft tissue landmarks threedimensionally from the subjects of normal occlusion individuals.
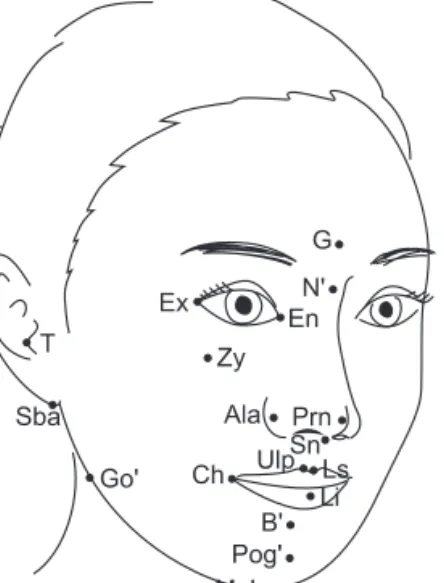
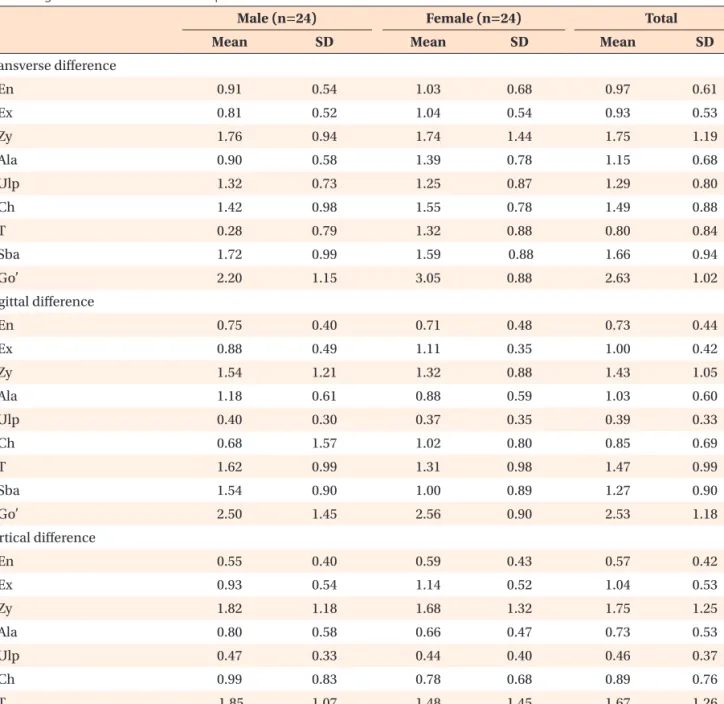
Methods: Conebeam computed tomography (CT) scans were obtained in 48 normal occlusion adults (24 men, 24 women), and reconstructed into 3dimensional (3D) models by using a 3D image software. 3D position of 27 soft tissue landmarks, 9 midline and 9 pairs of bilateral landmarks, were identified in 3D coordination system, and their right and left differences were calculated and analyzed. Results: The right and left difference values derived from the study ranged from 0.6 to 4.6 mm indicating a high variability according to the landmarks. In general, the values showed a tendency to increase according to the lower and lateral positioning of the landmarks in the face. Overall differences were determined not only by transverse differences but also by sagittal and vertical differences, indicating that 3D evaluation would be essential in the facial soft tissue analysis. Conclusions: Means and standard deviations of the right and left difference of facial soft tissue landmarks derived from this study can be used as the diagnostic standard values for the evaluation of facial asymmetry.
[Korean J Orthod 2012;42(2):56-63]
Key words: Threedimensional, Soft tissue, Facial asymmetry, Conebeam CT Hyeon-Shik Hwang
aDonghui Yuan
bKweon-Heui Jeong
cGi-Soo Uhm
cJin-Hyoung Cho
dSook-Ja Yoon
ea
Department of Orthodontics, 2nd Stage of Brain Korea 21, School of Dentistry, Dental Science Research Institute, Chonnam National University, Gwangju, Korea
b
Department of Orthodontics, School of Dentistry, Chonnam National University, Gwangju, Korea; Department of Stomatology, Bethune International Peace Hospital, Shijiazhuang, PR China
c
School of Dentistry, Chonnam National University, Gwangju, Korea
d
Department of Orthodontics, School of Dentistry, Chonnam National University, Gwangju, Korea
e
Department of Oral and Maxillofacial Radiology, School of Dentistry, Chonnam National University, Gwangju, Korea
Received January 18, 2012; Revised February 26, 2012; Accepted February 27, 2012.
Corresponding author: HyeonShik Hwang.
Professor and Chairman, Department of Orthodontics, School of Dentistry, Chonnam National University, Yong bongdong 300, Bukgu, Gwangju 500757, Korea.
Tel +82625305841 email [email protected]
This study was financially supported by Chonnam National University, 2007.
pISSN 2234-7518 • eISSN 2005-372X http://dx.doi.org/10.4041/kjod.2012.42.2.56
© 2012 The Korean Association of Orthodontists.
The authors report no commercial, proprietary, or financial interest in the products or companies described in this article.
This is an Open Access article distributed under the terms of the Creative Commons Attribution NonCommercial License (http://creativecommons.org/licenses/bync/3.0) which permits unrestricted noncommercial use, distribution, and reproduction in any medium, provided the original work is properly cited.