저작자표시-비영리-변경금지 2.0 대한민국 이용자는 아래의 조건을 따르는 경우에 한하여 자유롭게 l 이 저작물을 복제, 배포, 전송, 전시, 공연 및 방송할 수 있습니다. 다음과 같은 조건을 따라야 합니다: l 귀하는, 이 저작물의 재이용이나 배포의 경우, 이 저작물에 적용된 이용허락조건 을 명확하게 나타내어야 합니다. l 저작권자로부터 별도의 허가를 받으면 이러한 조건들은 적용되지 않습니다. 저작권법에 따른 이용자의 권리는 위의 내용에 의하여 영향을 받지 않습니다. 이것은 이용허락규약(Legal Code)을 이해하기 쉽게 요약한 것입니다. Disclaimer 저작자표시. 귀하는 원저작자를 표시하여야 합니다. 비영리. 귀하는 이 저작물을 영리 목적으로 이용할 수 없습니다. 변경금지. 귀하는 이 저작물을 개작, 변형 또는 가공할 수 없습니다.
Changes in mandible and masseter muscle
following method of orthognathic surgery
in skeletal Class III patients with facial asymmetry
Ah Kyung Cho
Changes in mandible and masseter muscle
following method of orthognathic surgery
in skeletal Class III patients with facial asymmetry
A Dissertation Thesis
Submitted to the Department of Dentistry
and the Graduate School of Yonsei University
in partial fulfillment of the
requirements for the degree of
Doctor of Philosophy of Dentistry
Ah Kyung Cho
June 2015
감사의 글
본 논문이 완성되기까지 늘 아낌없는 가르침와 함께 자상하신 지도와 격려로 이끌어 주신 유형석 지도 교수님께 진심으로 감사를 드립니다. 많은 관심과 조언으로 논문 심사를 맡아주신 백형선 교수님과 황충주 교수님, 이상휘 교수님, 김기정 선생님께 깊이 감사드리며, 저에게 교정학으로의 길을 열어주시고 많은 가르침을 주신 손병화 교수님, 박영철 교수님, 김경호 교수님, 이기준 교수님, 차정열 교수님과 아름다운 치과병원 서정수 원장님과 백일수 원장님, 김영원 선생님께 진심으로 감사드립니다. 항상 많은 관심과 배려를 해주신 건국대학교병원 김재승 과장님께 감사드리고 또한 논문 완성에 많은 도움을 주신 선후배님들, 동기들, 교정과 직원들에게도 감사의 마음을 전합니다. 지금의 제가 있기까지 헌신적인 사랑으로 항상 믿고 격려해 주시는 사랑하고 존경하는 아빠, 엄마께 진심으로 감사드리고, 부족한 며느리를 언제나 아끼고 이해해주시는 시부모님과 사랑하는 가족 모두에게 깊이 감사드립니다. 마지막으로 논문이 완성될 수 있도록 항상 따뜻하게 감싸주고 도와준 사랑 하는 남편, 그리고 너무도 소중한 우리 이쁜 상묵이와 영묵이에게 무한한 사랑과 감사의 마음을 전하며 이 기쁨을 함께 나누고자 합니다. 2015년 6월 저자 씀List of Tables ··· ii
List of Figures ··· iii
Abstract ··· iv
I. Introduction ··· 1
II. Subjects and Methods ··· 4
1. Subjects ··· 4
2. Methods ··· 7
A. CT scanning & 3D images reconstruction ··· 7
B. Measurements with reconstructed 3D images ··· 8
(1) Measurement of mandibular total volume ··· 9
(2) Measurement of mandibular gonial angle area volume in SSRO ··· 10
(3) Measurement of mandibular gonial angle area volume in IVRO ··· 11
(4) Measurement of intergonial width ··· 12
(5) Measurement of masseter muscle angle ··· 14
(6) Measurement of maximum cross-sectional area of masseter muscle ···· 15
(7) Calculation of maximum cross-sectional area of masseter muscle ··· 16
C. Statistical analysis ··· 17
III. Results ··· 18
1. Comparison of mandibular volume in SSRO and IVRO ··· 18
2. Comparison of maximum cross-sectional area and angle of masseter muscle in SSRO and IVRO ··· 19
3. Correlation between menton deviation and the other variables ··· 21
IV. Discussion ··· 27
List of Tables
Table 1. Classification of subjects ··· 6
Table 2. Classification of sub-groups in each groups ··· 6
Table 3. Comparison of mandible changes (Mean ± SD) ··· 19
Table 4. Comparison of masseter muscle changes (Mean ± SD) ··· 20
Table 5. Comparison of mandibular gonial angle area volume changes (cc) (Mean ± SD) ··· 22
Table 6. Correlation coefficients between menton deviation and mandibular gonial angle area volume ··· 22
Table 7. Comparison of masseter muscle angle changes (°) (Mean ± SD) ··· 24
Table 8. Comparison of maximum cross-sectional area changes of the masseter muscle (mm2) (Mean ± SD) ··· 26
List of Figures
Fig. 1. Facial midline on P-A cephalograms ··· 5
Fig. 2. Reconstruction of a three-dimensional image using OnDemandTM software (CyberMed Inc., Seoul, Korea) ··· 8
Fig. 3. Measurement of mandibular total volume ··· 9
Fig. 4. Measurement of mandibular gonial angle area volume in SSRO ··· 10
Fig. 5. Measurement of mandibular gonial angle area volume in IVRO ··· 11
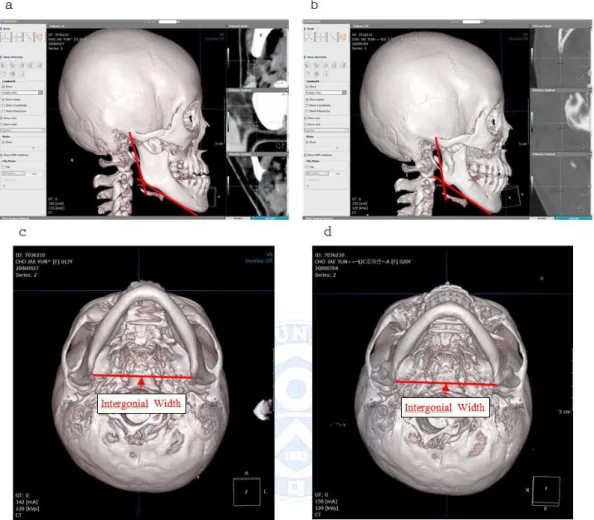
Fig. 6. Measurement of intergonial width in SSRO ··· 12
Fig. 7. Measurement of intergonial width in IVRO ··· 13
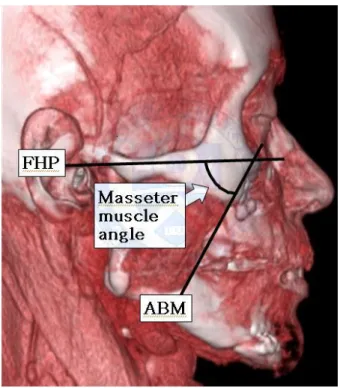
Fig. 8. Measurement of masseter muscle angle ··· 14
Fig. 9. CT images of masseter muscle area ··· 15
Abstract
Changes in mandible and masseter muscle
following method of orthognathic surgery
in skeletal Class III patients with facial asymmetry
Ah Kyung Cho
Department of Dentistry, Graduate School, Yonsei University (Directed by Prof. Hyung Seog Yu, D.D.S., M.S., Ph.D.)
The aim of this study was to evaluate changes of gonial angle area in skeletal Class III patients with facial asymmetry following two kinds of orthognathic surgery, sagittal split ramus osteotomy (SSRO) and intraoral vertical ramus osteotomy (IVRO). Using computed tomography (CT), one study was conducted on 20 skeletal Class III patients with facial asymmetry who had undergone SSRO orthognathic surgery at K University Hospital. Measurements from the reconstructed three-dimensional (3D) CT images were compared from T0 (before surgery) and T1 (1 year after surgery). Another longitudinal study was conducted on 17 skeletal Class III patients with facial asymmetry who had undergone IVRO orthognathic surgery at Y University Hospital. Measurements from the reconstructed 3D CT images were compared from T0 (before surgery), T1 (1 year after surgery), and T2 (4 years after surgery). The mandibular total volume, intergonial width, mandibular gonial angle area volume, the maximum cross-sectional area (MCSA) and angle of the
masseter muscle were measured from the reconstructed 3D CT images. Using 3D CT images, we evaluated this data on the deviated side and non-deviated sides. We also compared this data between SSRO group and IVRO group. The correlation between the degree of facial asymmetry and postoperative changes of mandibular gonial angle area volume and the maximum cross-sectional area of the masseter muscle were assessed and analyzed with the following results.
1. When comparing the mandibular change, during T0-T1, a significant decrease was noted in mandibular total volume, intergonial width and mandibular gonial angle area volume of non-deviated side (P<0.01, P<0.05, P<0.01), and no significant difference was noted in mandibular gonial angle area volume of deviated side (P>0.05) in SSRO group. In IVRO group during T0-T1, a significant decrease was noted in mandibular total volume and mandibular gonial angle area volume on both the deviated and non-deviated sides (P<0.01), and no significant difference was noted in intergonial width (P>0.05). Only mandibular total volume change was noted to be greater in IVRO group (10.6%) than SSRO group (3.3%) (P<0.01). No significant differences were noted between SSRO group and IVRO group in mandibular gonial angle area volume and intergonial width (P>0.05).
2. When comparing the masseter muscle change, during T0-T1, a significant increase was noted in maximum cross-sectional area of the masseter muscle on deviated side in SSRO group (P<0.01), and no significant difference was noted on non-deviated side (P>0.05). In IVRO group during T0-T1, no significant difference was noted in maximum cross sectional area of the masseter muscle (P>0.05). No significant difference was noted between SSRO group and IVRO group in maximum
3. At T1-T2, mandibular gonial angle area volume on both the deviated and non-deviated sides was noted to be smaller as the amount of menton deviation was greater in IVRO group (P<0.01, P<0.05). There was no correlation between the amount of menton deviation and postoperative changes in maximum cross-sectional area and angle of the masseter muscle (P>0.05).
As a result of this study, there was no significant difference of the change in mandibular gonial angle area volume and maximum cross-sectional area of the masseter muscle except that the mandibular total volume change of IVRO group was larger than that of SSRO group in comparison of the change between SSRO group and IVRO group during T0-T1. It is considered that further studies including expansion of study subjects and longitudinal study of SSRO group whether comparative study results of the two surgical methods depending on the degree of facial asymmetry can affect the choice of surgical method will be necessary in the future.
Key words : skeletal Class lll, facial asymmetry, SSRO, IVRO, 3D CT mandibular volume, intergonial width, masseter muscle
Changes in mandible and masseter muscle
following method of orthognathic surgery
in skeletal Class III patients with facial asymmetry
Ah Kyung Cho
Department of Dentistry, Graduate School, Yonsei University (Directed by Prof. Hyung Seog Yu, D.D.S., M.S., Ph.D.)
I. Introduction
Skeletal Class III patients make up a large proportion of orthognathic surgery cases in our country (Kang et al., 1992). Sagittal split ramus osteotomy (SSRO) and intraoral vertical ramus osteotomy (IVRO) are the most frequently used techniques for the treatment of mandibular prognathism and facial asymmetry. IVRO procedure offers numerous advantages over SSRO for the treatment of the prognathic patient, including technical simplicity, reduced surgical time, and the ability to reposition the condyle head (Ghali et al., 2000). The greatest advantage of IVRO over SSRO is the lower incidence of injury to
that 88% and 66.7% TMD symptom relief were shown in IVRO group and SSRO group respectively at 6 months after surgery (Ueki et al., 2002). The major advantages of SSRO are the better bony interface between osteotomized segments and the easier use of rigid fixation that minimizes the need for intermaxillary fixation (IMF) (Wolford et al., 2000). Kim et al reported IVRO and SSRO have different osteotomy design and different exposure of medullary bone, but there was no statistically significant difference in postoperative drainage of blood and exudate from bilateral mandibular osteotomy areas after IVRO and SSRO (Kim et al., 2014).
Occlusal stability, which is one of the most important factors in the prevention of postoperative relapse in orthognathic surgery, results from good dental occlusion and normal postoperative condylar position. There have been many reports describing stability following SSRO for skeletal Class III (Mobarak et al., 2000, Costa et al., 2001; Kim et al., 2002; Politi et al., 2004) including three-dimensional (3D) images (Cevidanes et al., 2007; Draenert et al., 2010; Kim et al., 2012), but there have been few reports describing stability following IVRO (Greebe et al., 1982). Several authors have reported postoperative occlusal stability after IVRO. Hall et al observed anterior dental relapse in 7% and postsurgical anterior openbite in 14.3% of 40 prognathic and 2 asymmetric patients (Hall et al., 1975). Wisth found clinical significant dental relapses in 15% of 44 prognathic patients treated 10 years previously with oblique vertical osteotomy (Wisth et al., 1981). Jung et al evaluated the postoperative stability associated with differing degrees of mandibular setback and their relations after IVRO by measuring the preoperative and postoperative lateral cephalographs to find out the degree of movement, and the vertical and horizontal positions of menton and pogonion. They reported the amount of setback has minimal effects on anterior relapse, so overcorrection was not necessary with IVRO (Jung et al., 2013).
Although the advantages and disadvantages of SSRO and IVRO for mandibular setback have been discussed frequently (Ghali et al., 2000; Wolford et al., 2000), studies comparing postoperative skeletal stability between the two surgical methods are relatively
rare. Phillips et al observed that SSRO group showed a significantly greater relapse in the Sella-Nasion-B-point (SNB) angle with more anterior movement of menton and pogonion than IVRO group (Phillips et al., 1986). Yoshioka et al reported that the B-point and pogonion in IVRO group moved significantly more posteriorly and inferiorly in the early postoperative period when compared with SSRO group, but no significant difference in skeletal stability was observed between the two surgical methods 1 year after surgery (Yoshioka et al., 2008).
3D CT is useful for comparing and evaluating changes in the jaw and the associated changes in the soft tissues before and after orthognathic surgery. 3D CT images are now widely used in not only precise diagnostics and treatment planning in orthodontics but also studies on post-treatment stability (Shingo et al., 2013; Carvalho et al., 2010; Cevidanes et al., 2007). In particular, patients undergoing orthognathic surgery require 3D analysis for the precision and ability to assess changes over time although most of studies have traditionally been based on 2D images such as cephalograms and facial photos (Kitahara et al., 2009; Yoshioka et al., 2008; Chen et al., 2011).
In this study, the mandibular volume change and maximum cross-sectional area of the masseter muscle change depending on SSRO and IVRO orthognathic surgery was to be investigated by measurement of mandibular total volume, mandibular gonial angle area volume, intergonial width, masseter muscle angle and maximum cross-sectional area of the masseter muscle using the reconstructed 3D CT images in order to compare the change from gonial angle area remodeling in each two surgical methods, since soft tissue change tends to look larger macroscopically more after IVRO surgery than after SSRO surgery.
II. Subjects and Methods
1. Subjects
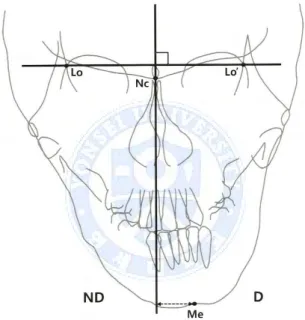
This study was carried out in two groups of patients diagnosed with mandibular prognathism and facial asymmetry. One group (SSRO group) underwent SSRO orthognathic surgery at K University Hospital form 2012 to 2013. The other group (IVRO group) underwent IVRO orthognathic surgery at Y University Hospital from 2004 to 2007. These subjects were diagnosed as skeletal Class lll malocclusion using lateral cephalometric analysis. The diagnostic criteria of two groups were unilateral or bilateral Angle Class lll molar key, overjet of 0 mm or less, and ANB (A-point-Nasion-B-point) angle difference of 0° or less (average, -2.0°). And they had mandibular menton deviation of more than 3.5 mm from the facial midline (average, 5.5 mm), using posteroanterior cephalometric analysis. The facial midline was defined as a line perpendicular to the line connecting Lo and Lo’ through Nc (Figure 1) (Haraguchi et al., 2002). Patients with systemic disease were excluded from the study.
SSRO group was composed of 20 patients who underwent preoperative and postoperative orthodontic treatment and two-jaw surgery (Le Fort I osteotomy + bilateral sagittal split ramus osteotomy, 12 of 20 patients had genioplasty) by one surgical team and who agreed on additional CT examinations at 1 year after surgery (11 male and 9 female; average age, 24.0 years). IVRO group was composed of 17 patients who underwent preoperative and postoperative orthodontic treatment and two-jaw surgery (Le Fort I osteotomy + bilateral intraoral vertical ramus osteotomy, 9 of 17 patients had genioplasty) by one surgical team and who agreed on additional CT examinations at 4 years after surgery (6 male and 11 female; average age, 21.7 years) (Table 1). In IVRO treatment, effort was made to preserve the gonial angle by positioning the bone cutting line superiorly, and in
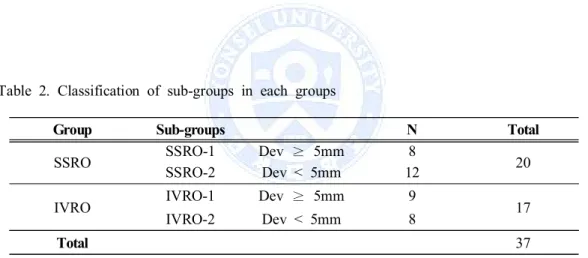
SSRO treatment, masseter muscle separation was done to a minimum, but in IVRO treatment, masseter muscle and medial pterygoid muscle were separated widely. The studygroup was divided into two sub-groups based on the amount of menton deviation (Table 2).
Figure 1. Facial midline on P-A cephalograms.
* Lo and Lo' indicate bilateral intersection of the oblique orbital line with the lateral contour of the right and left side orbits; Nc, neck of crista galli; Me, menton; D, deviated side; ND, non-deviated side
SSRO group IVRO group
N 20 17
Gender 11 Male and 9 Female 6 Male and 11 Female
Average age 24.0 years 21.7 years
Surgery Le Fort I osteotomy + SSRO 12 of 20 patients had genioplasty Le Fort I osteotomy + IVRO 9 of 17 patients had genioplasty
Group Sub-groups N Total
SSRO SSRO-1 Dev ≥ 5mm 8 20
SSRO-2 Dev < 5mm 12
IVRO IVRO-1 Dev ≥ 5mm 9 17
IVRO-2 Dev < 5mm 8
Total 37
Table 1. Classification of subjects
N indicates Number of subjects; SSRO, sagittal split ramus osteotomy; IVRO, intraoral vertical ramus osteotomy.
Table 2. Classification of sub-groups in each groups
2. Methods
A. CT scanning & 3D images reconstruction
Each patient of SSRO group underwent 3D CT examinations at before surgery (T0) and 1 year after surgery (T1). A spiral CT scanner (GE Medical System, Milwaukee, Wis, USA) was used for CT scans under conditions of 120 kV and 175 mA. Each patient of IVRO group underwent 3D CT examinations at before surgery (T0), 1 year after surgery (T1), and 4 years after surgery (T2). A spiral CT scanner (GE Medical System, Milwaukee, Wis, USA) was used for CT scans under conditions of 100 kV and 150 mA. The Frankfort Horizontal plane (FH plane) of the patient was adjusted perpendicular to the ground, and the middle line was aligned with the major axis of the machine.
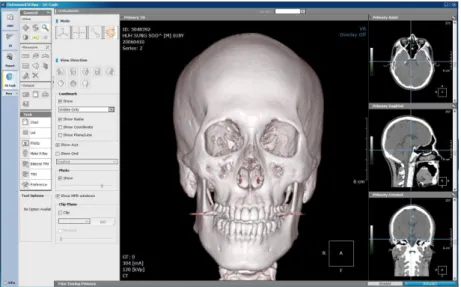
The thickness of the axial image was 1 mm, and the table speed was 6 mm per second. The axial images taking were sent out as digital imaging and communication in medicine (DICOM) images, and were reconstructed into 3D images using OnDemandTM
software (CyberMed Inc, Seoul, Korea) (Figure 2). The Frankfort Horizontal plane (FH plane), which was constructed on both sides of porion and left of orbitale was used as a horizontal reference plane, and the midsagittal plane was drawn perpendicular to the FH plane passing through nasion (Park et al., 2006). The shifted side of menton for the midsagittal plane was defined as the deviated side, and the other side was defined as non-deviated side.
Figure 2. Reconstruction of a three-dimensional image using OnDemandTM software
(CyberMed Inc., Seoul, Korea).
B. Measurements with reconstructed 3D CT images
Under 3D mode of OnDemandTM software, we assessed mandibular total volume,
mandibular gonial angle area volume and maximum cross-sectional area of the masseter muscle with the reconstructed 3D CT images. Under 3D Ceph mode of OnDemandTM
software, we assessed intergonial width and the masseter muscle angle with the reconstructed 3D CT images.
(1) Measurement of mandibular total volume
Under 3D mode of OnDemandTM software, we assessed mandibular total volume after
separating the mandible using Segmentation funtion.
(2) Measurement of mandibular gonial angle area volume in SSRO
Under 3D mode of OnDemandTM software, in order to include the surgical site, mandible
was sectioned based on the line 10mm above the occlusal plane which was reported to be highly correlated with the volume of the masseter muscle, and the line vertical to mandibular occlusal plane passing the proximal surface of the first and second premolars as a fiducial line, and then mandibular gonial angle area volume was measured on both the deviated side and non-deviated side respectively (Xu et al., 1994; Hong et al., 2006).
(3) Measurement of mandibular gonial angle area volume in IVRO
Under 3D mode of OnDemandTM software, in order to include the surgical site, mandible
was sectioned based on the line 10mm above the occlusal plane which was reported to be highly correlated with the volume of the masseter muscle, and the line connecting from the anterior surface of ramus to the distal surface of the most posterior lower molar tooth as a fiducial line, and then mandibular gonial angle area volume was measured on both the deviated side and non-deviated side respectively (Xu et al., 1994; Hong et al., 2006).
(4) Measurement of intergonial width
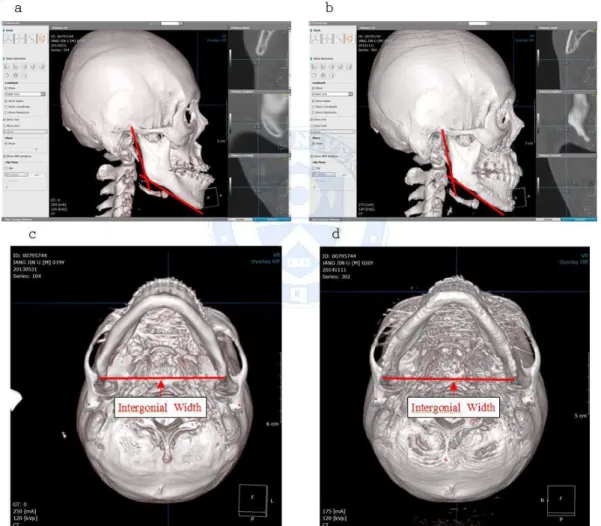
Under 3D mode of OnDemandTM software, by drawing an extension line of the posterior
border of ramus and the one of the inferior border of mandible, R Go and L Go were designated in two-dimensional space where two lines emerged, and R Go and L Go on 3D image were designating by moving Go in three-dimensional space (sagittal, axial, coronal), the distance between two dots was measured (Figure 6, Figure 7).
Figure 6. Measurement of intergonial width in SSRO
(a) preoperative CT sagittal image (b) postoperative CT sagittal image
Figure 7. Measurement of intergonial width in IVRO
(a) preoperative CT sagittal image (b) postoperative CT sagittal image
(5) Measurement of masseter muscle angle
Under 3D Ceph mode of OnDemandTM software, the masseter muscle angle was
measured as the angle between the FH plane and the anterior border of masseter muscle, which was clearly defined on the lateral view of reconstructed 3D CT images. To observe the clear outline of masseter muscle, the images were processed with the software by adjusting the density range, color assignment, opacity value using Fine tuning (Figure 8).
Figure 8. Measurement of masseter muscle angle
Masseter muscle angle was defined as the angle between Frankfort Horizontal plane (FHP) and anterior border of masseter muscle (ABM).
(6) Measurement of maximum cross-sectional area of masseter muscle
Under 3D mode of OnDemandTM software, the maximum cross-sectional area (MCSA)
of the masseter muscle was measured on both the deviated and the non-deviated side, using the reconstructed 3D CT axial images. To observe the clear outline of masseter muscle, the images were processed with the software by adjusting the window level, contrast, and density ranges. The MCSA of the masseter muscle was measured a level 10 mm above the occlusal plane of the maxillary second molar on the reconstructed 3D CT images. The scanning level for the measurements was chosen so that metal artifacts from brackets and wires were avoided and corresponded to the roots of the maxillary teeth. Furthermore, previous reports showed that the measured values were relatively stable and highly correlated with the volume of the masseter muscle at the level of the scan (Ariji et al., 2000; Xu et al., 1994; Hong et al., 2006) (Figure 9).
Figure 9. CT images of masseter muscle area (a) Original axial image
(7) Calculation of maximum cross-sectional area of masseter muscle
To obtain the MCSA of masseter muscle perpendicular to the muscle direction, the maximum area of masseter muscle (a) was calculated by multiplying the cross-sectional area measured on the axial image (a0) by Cos Θ (the angle between the axial image and
the section perpendicular to the muscle image) (Figure 10).
Figure 10. Measurement of cross-sectional area of the masseter muscle. (a) The cross-sectional area measured on an axial slice of the CT images. (b) The adjusted cross-sectional area perpendicular to the muscle direction. (c) Methods for calculating the area (a) from (a0).
C. Statistical Analysis
All measurements were performed by one author. Measurements were repeated after 2 weeks by the same author, and the second measurement was used for the statistical analysis. The intra-examiner error between the two measurements was determined by means of R. version 3.1.1, and the intra-class correlation coefficient was calculated.
Wilcoxon signed rank test was used to compare the changes of measurements over the period during T0-T1 in each two groups and during T1-T2 in IVRO group. Mann-Whitney U test was used to compare differences between SSRO group and IVRO group, SSRO-1 group and SSRO-2 group, IVRO-1 group and IVRO-2 group.
Spearman correlation analysis was used to determine the correlation between the amount of menton deviation and the changes of mandibular gonial angle area volume, masseter muscle measurements over the period from T0-T1.
All statistical evaluations were performed with SPSS version 20.0 (Statistical Package for the Social Science Inc., Chicago, IL, U.S.A.).
III. Results
The intra-examiner error was found to be statistically insignificant (P<0.05), and the intra-class correlation coefficient was within acceptable value (mean of 0.96, with a range of 0.94 – 0.97).
1. Comparison of mandibular volume in SSRO and IVRO
In SSRO group, mandibular measurements except mandibular gonial angle area volume on deviated side decreased significantly during T0-T1 (P<0.05). In IVRO group, mandibular measurements except intergonial width decreased significantly during T0-T1 (P<0.001). At T1-T2, no significant differences were found on all measurements in IVRO group (P>0.05). When comparing mandibular measurements between SSRO group and IVRO group at T0-T1, only mandibular total volume showed the differences, which was more smaller significantly in SSRO group than in IVRO group (P<0.001). At T0-T1, mandibular gonial angle area volume on deviated side more increased in IVRO group than SSRO group, but there was no significant differences between SSRO group and IVRO group (Table 3).
Variables
SSRO IVRO
T0-T1 T0-T1 T1-T2
Mean SD Sig Mean SD Sig Mean SD Sig Mandible
Mand Total Volume (cc) -2.83 3.20 ** -10.12 6.09 ** -0.25 2.61
Sig # **
Intergonial Width (mm) -2.23 3.81 * -0.73 2.27 0.34 1.85 Sig #
Mand Gonial angle area
Vol - D (cc) -0.60 1.49 -1.51 1.49 ** 0.38 0.89
Sig #
Mand Gonial angle area
Vol - ND (cc) -1.40 1.59 ** -1.70 1.75 ** -0.04 0.86 Sig #
Table 3. Comparison of mandible changes (Mean ± SD)
Sig # : comparison between SSRO (T0-T1) group and IVRO (T0-T1) group
Mand indicates Mandible; Vol, Volume; D, Deviated side; ND, Non-deviated side; SD, Standard deviation; Sig, Significance; SSRO, sagittal split ramus osteotomy; IVRO, intraoral vertical ramus osteotomy.
* P < 0.05; ** P < 0.01.
2. Comparison of maximum cross-sectional area and angle of
masseter muscle in SSRO and IVRO
Variables
SSRO IVRO
T0-T1 T0-T1 T1-T2
Mean SD Sig Mean SD Sig Mean SD Sig
Masseter muscle Angle-D (°) -1.42 5.51 -3.41 7.80 1.12 5.84 Sig # Angle-ND (°) -2.82 5.28 * -5.36 6.95 ** -1.85 9.44 Sig # MCSA-D (mm2) 39.26 59.78 ** 3.39 75.44 35.64 69.34 Sig # MCSA-ND (mm2) 16.38 52.75 2.71 64.05 23.34 53.14 Sig #
and there was no significant difference in maximum cross-sectional area of the masseter muscle on non-deviated side during T0-T1 (P>0.05) (Table 4). In IVRO group, there was significant decrease in the masseter muscle angle on non-deviated side (P<0.01) and there was no significant difference in the masseter muscle angle on deviated side during T0-T1 (P>0.05). In IVRO group, there was no significant difference in maximum cross-sectional area of the masseter muscle on both the deviated and non-deviated side (P>0.05). There was a little increase in the masseter muscle angle on deviated side during T1-T2 but there was no significant difference (Table 4).
Table 4. Comparison of masseter muscle changes (Mean ± SD)
Sig # : comparison between SSRO (T0-T1) group and IVRO (T0-T1) group
Angle indicates Masseter muscle Angle; MCSA, maximum cross-sectional area; D, Deviated side; ND, Non-deviated side; SD, Standard deviation; Sig, Significance; SSRO, sagittal split ramus osteotomy; IVRO, intraoral vertical ramus osteotomy.
3. Correlation between menton deviation and the other variables
A. Correlation between menton deviation and mandibular gonial angle
area volume
In SSRO-1 (Dev≥5mm) group and SSRO-2 (Dev<5mm) group, IVRO-1 (Dev≥5mm) group and IVRO-2 (Dev<5mm) group, there was no significant difference in mandibular gonial angle area volume both the deviated side and non-deviated side during T0-T1 (P>0.05). When comparing SSRO-1 group and SSRO-2 group, IVRO-1 group and IVRO-2 group, there was no significant difference in mandibular gonial angle area volume (P>0.05). The mandibular gonial angle area volume in IVRO-1 (Dev≥5mm) group showed smaller decrease than in IVRO-2 (Dev<5mm) group during T1-T2 but there was no significant difference (Table 5). Spearman correlation analysis was used to find out the relationship between the amount of menton deviation and T0-T1, and T1-T2 changes of mandibular gonial angle area volume on the deviated side and non-deviated side. In SSRO group, there was no statistical relationship between the amount of menton deviation and the change of mandibular gonial angle area volume. In IVRO group, as the amount of menton deviation became larger, the changes of T1-T2 decreased with significant difference on both the deviated side and non-deviated side (P<0.01, P<0.05) (Table 6).
SSRO-1 (Dev≥5mm) SSRO-2 (Dev<5mm) Sig IVRO-1 (Dev≥5mm) IVRO-2 (Dev<5mm) Sig Dev. side T0-T1 -0.40 ± 1.42 -0.73 ± 1.58 NS -1.41 ± 1.35 -1.61 ± 1.73 NS T1-T2 -0.01 ± 0.99 0.76 ± 0.62 NS Non-Dev. side T0-T1 -1.46 ± 1.82 -1.36 ± 1.50 NS -1.71 ± 1.38 -1.69 ± 2.20 NS T1-T2 -0.34 ± 0.52 0.27 ± 1.04 NS Sig # T0-T1 NS NS NS NS T1-T2 NS NS Menton Deviation Mandibular gonial angle area volume (cc)
SSRO T0-T1 Deviated side Non-Deviated side IVRO T0-T1 Deviated side
Non-Deviated side
T1-T2 Deviated side **
Non-Deviated side *
Table 5. Comparison of mandibular gonial angle area volume changes (cc) (Mean ± SD)
Sig # : comparison between the deviated side and non-deviated side
Dev indicates Deviated; NS, Not significant; SD, Standard deviation; Sig, Significance * P < 0.05; ** P < 0.01.
Table 6. Correlation coefficients between menton deviation and mandibular gonial angle area volume
B. Correlation between menton deviation and masseter muscle angle
In SSRO group, there was no significant difference in the masseter muscle angle on both the deviated side and non-deviated side (P>0.05). The masseter muscle angle on the deviated side showed more greater decrease in IVRO-1 (Dev≥5mm) group compared to IVRO-2 (Dev<5mm) group (P<0.05). There was no significant difference in the masseter muscle angle between SSRO group and IVRO group on both the deviated side and non-deviated side (P>0.05). The masseter muscle angle in IVRO-2 group showed greater decrease than in SSRO-2 group but there was no significant difference. When comparing SSRO-1 group and SSRO-2 group, IVRO-1 group and IVRO-2 group, there was no significant difference in mandibular gonial angle area volume during T0-T1, and T1-T2 on both the deviated side and non-deviated side (P>0.05) (Table 7). Spearman correlation analysis was used to find out the relationship between the amount of menton deviation and T0-T1, and T1-T2 changes of masseter muscle angle on the deviated side and non-deviated side. In both SSRO group and IVRO group, there was no statistical relationship between the amount of menton deviation and the changes of masseter muscle angle on both the deviated side and non-deviated side (P>0.05).
SSRO-1 (Dev≥5mm) SSRO-2 (Dev<5mm) Sig IVRO-1 (Dev≥5mm) IVRO-2 (Dev<5mm) Sig Dev. side T0-T1 -1.12 ± 3.91 -1.62 ± 6.54 NS 0.62 ± 6.25 -7.95 ± 7.08 ** Sig 1 NS NS Sig 2 NS NS Sig 3 NS NS NS NS T1-T2 0.79 ± 3.99 1.45 ± 7.54 Sig 3 NS NS Non-Dev. side T0-T1 -1.91 ± 4.62 -3.42 ± 5.79 NS -2.87 ± 6.13 -8.18 ± 7.11 NS Sig 1 NS NS Sig 2 NS NS Sig 3 NS NS NS NS T1-T2 -0.77 ± 9.76 4.46 ± 7.71 Sig 3 NS NS
Table 7. Comparison of masseter muscle angle changes (°) (Mean ± SD)
Sig 1: comparison between SSRO-1 and IVRO-1 group Sig 2: comparison between SSRO-2 and IVRO-2 group
Sig 3: comparison between deviated side and non-deviated side
Dev indicates Deviated; NS, Not significant; SD, Standard deviation; Sig, Significance * P < 0.05; ** P < 0.01.
C. Correlation between menton deviation and maximum cross-sectional
area of the masseter muscle
There was no significant difference in maximum cross-sectional area of the masseter muscle between the deviated side and non-deviated side, SSRO group and IVRO group (P>0.05). The maximum cross-sectional area of the masseter muscle on deviated side showed greater decrease than on non-deviated side in SSRO-2 group, but there was no significant difference (Table 8). Spearman correlation analysis was used to find out the relationship between the amount of menton deviation and T0-T1, and T1-T2 changes of maximum cross-sectional area of the masseter muscle on the deviated side and non-deviated side. In both SSRO group and IVRO group, there was no statistical relationship between the amount of menton deviation and the changes of maximum cross-sectional area of the masseter muscle on both the deviated side and non-deviated side (P>0.05).
SSRO-1 (Dev≥5mm) SSRO-2 (Dev<5mm) Sig IVRO-1 (Dev≥5mm) IVRO-2 (Dev<5mm) Sig Dev. side T0-T1 41.26 ± 66.21 37.93 ± 58.11 NS 14.96 ± 73.65 -9.78 ± 80.26 NS Sig 1 NS NS Sig 2 NS NS Sig 3 NS NS NS NS T1-T2 21.24 ± 64.52 50.03 ± 75.36 Sig 3 NS NS Non-Dev. side T0-T1 10.33 ± 47.63 20.42 ± 57.60 NS 8.20 ± 65.27 -9.99 ± 64.51 NS Sig 1 NS NS Sig 2 NS NS Sig 3 NS NS NS NS T1-T2 8.20 ± 33.30 38.48 ± 66.48 Sig 3 NS NS
Table 8. Comparison of maximum cross-sectional area changes of the masseter muscle (mm2) (Mean ± SD)
Sig 1: comparison between SSRO-1 and IVRO-1 group Sig 2: comparison between SSRO-2 and IVRO-2 group
Sig 3: comparison between deviated side and non-deviated side
Dev indicates Deviated; NS, Not significant; SD, Standard deviation; Sig, Significance * P < 0.05; ** P < 0.01.
IV. Discussion
Facial asymmetry is a relatively common feature in patients with maxillomandibular deformities about to undergo orthognathic surgery. Facial asymmetry is a condition in which the center of the maxilla or mandible is deviated from the midline, or when there is a discrepancy in facial height or width (Peck et al., 1970). Most images used to analyse and diagnose abnormalities of the craniofacial complex are x-rays, particularly lateral and panoramic views. It is, therefore, somewhat problematic to distinguish between the various anatomical points of right and left sides. Furthermore, two-dimensional x-rays have inherent limitations, such as elongation or distortion of the image, which may lead to a wrong diagnosis. Grummons et al used frontal analyses to study asymmetry and found that the cephalometric measurements were subject to distortion as a result of the projection technique, and could not be used for either quantitative or comparative purposes (Grummons et al., 1987). Given that a quantitative measurement is critical to a diagnosis of asymmetry, the use of two-dimensional x-rays should clearly not be regarded as valid. Analysing the craniofacial complex has improved recently with the development of three-dimensional (3D) image technology (Park et al., 2009), since the 3D images obtained from computed tomography enable us to observe any one of the craniofacial bones from different angles. The accuracy of 3D CT reconstruction is sufficiently high for the linear measurements (Christiansen et al., 1986; Cavalcanti et al., 1999). The use of 3D CT analysis in the diagnosis and treatment of patients with facial asymmetry requiring surgical correction is now widely employed, and considered indispensible.
3D CT images are widely used in a number of studies. Three months after the two surgical methods, SSRO and IVRO, the lateral and frontal width of the pharyngeal airway
(Kawamata et al., 2000). In bilateral SSRO for the correction of asymmetry of the mandible, Park et al used 3D CT imaging to evaluate the changes in bone volume after remodeling, bone union of the unfixed bone fragments after distal cutting (osteotomy of the posterior part of the distal segment). Distal cutting minimized yawing movement of the distal segment which could displace the proximal segment (Park et al., 2014). The positional changes of the maxilla and the mandible in three dimensions following orthognathic surgery have been reported using surface meshes of hard tissue. Following cone-beam CT scanning of each surgical simulations, the actual surgical movement was compared to the analysis based on surface model movement (Jabar et al., 2015). The three-dimensional changes in hard tissue position following orthognathic surgery have been reported using 3D cephalometry, changes in volume, principal component analysis, and changes based on the surface model of hard tissue.
Sforza et al reported seven women all with skeletal Class III and facial asymmetry, were assessed both 2 months before and 10.7 months after surgery (Le Fort I osteotomy and SSRO) and surgery reduced mandibular volume (approximately, a significant, average 10% reduction), but it also reduced maxillary volume (an average 13% reduction), and nasal volume (Sforza et al., 2006). In this study, it was shown that the decrease amount of mandibular total volume after orthognathic surgery could differ depending on the surgical method, and the decrease amount was 10.6% and 3.3% in IVRO group and SSRO group respectively. IVRO group showed a larger mandibular volume change than that of SSRO group with significant difference (P<0.01). The mandibular gonial angle area volume was the only measurement whose relatedness to the amount of menton deviation was shown after IVRO surgery. The larger the amount of menton deviation was, the smaller the change of mandibular gonial angle area volume became on both the deviated side and non-deviated side during T1-T2 (Table 6). It could be said that this is a result showing that the remodeling of Gonion area occurs gradually for up to 4 years after IVRO surgery and that it is more stable from a long term perspective as the degree of facial asymmetry was severer after IVRO surgery.
Orthognathic surgery affects the postoperative position of the condyle within the glenoid fossa and often results in condylar displacement. Studies using tomographic radiographic and stereometric methods have shown that condylar displacement is frequent after mandibular setback surgery (Rosenquist et al., 1988; Athanasiou et al., 1991). Transverse proximal segment displacement has been studied using different types of orthognathic surgery by means of various methods, and this has led to different results (Alder et al., 1999; Becktor et al., 2002; Becktor et al., 2008; Harris et al., 1999; Schultes et al., 1998; Stroster et al., 1994). Schendel et al found that control of the proximal segment was the most significant aspect in stability and prevention of relapse (Schendel et al., 1980). In the present study, Gonion (Go), defined as the most inferolateral point of the ramal outline at the mandibular angle, was used as a landmark in P-A cephalometrics. Major et al presented the landmark identification errors in P-A cephalometrics and reported that there was a considerable range in the magnitude of error with different horizontal and vertical values (Major et al., 1994). They recommended that landmarks with identification errors greater than 1.5 mm should probably be avoided and landmarks with identification errors greater than 2.5 mm are inappropriate. Landmarks with a large horizontal identification error should be avoided in transverse measurements. Similarly, landmarks with large vertical identification errors should be avoided in measuring vertical structural relationships. According to their study, landmark Gonion (Go) may be very useful in transverse measurements because Gonion had the smallest intra-examiner errors in the horizontal dimension (Major et al., 1994). In the three-dimensional evaluation of craniofacial asymmetry using computed tomography, Menton (Me), Orbitale (Or), Porion (Po), Gonion (Go), Condylion (Co), Sella (S), Anterior nasal spine (ANS), Coronoid process (Cop), Nasion (N) were used for anatomical landmarks. Using the proposed asymmetric index method with 3D reconstructions, the Gonion emerged as the most asymmetrical landmark
intergonial width late postoperatively. It means some relapse in their transverse dimension changes. However, the magnitude of the changes was small, and it is still uncertain as to whether these changes are of any clinical significance (Choi et al., 2005). These results show that the transverse relapse or cortical surface remodeling, is occurring at gonial angle and the proximal segments following SSRO surgery. Angle et al reported all 25 SSRO patients showed an increase in intergonial width and the angulations of the proximal segments increased, mandibular length (Ar-B) increased, B point moved anteriorly, T1(early postoperatively) - T0 (preoperatively). During T2 (after orthodontic treatment completion) - T1 (early postoperatively), intergonial width decreased, angulation of the right and left proximal segments decreased and condylion moved superiorly (Angle et al., 2007). Bayat et al suggested that the intraoral vertico-sagittal ramus osteotomy (IVSRO) leads to an increase in intergonial width, both ramus angles, inter-ramus width, and outward angulation of the condylar fragment after 1 month after surgery (Bayat et al., 2011). IVSRO was first introduced by Choung to correct mandibular prognathism (Choung et al., 1992). Ko et al reported that 27 patients showed a decrease of 2.2 mm in intergonial width from T1 (after surgery) to T2 (at completion of orthodontic treatment). The mild decrease of the intergonial width in the postoperative period indicated extensive remodeling changes of the mandibular gonial angle in both sides (Ko et al., 2009). Reduction of the intergonial distance and remodeling of the gonial angle is more esthetically pleasing in Asian culture than an increase in facial width (Hajeer et al., 2004). There was a decrease in intergonial width which reported the increase from preoperative to early postoperative in previous studies, because intergonial width was compared between T0 (before surgery) and T1 (1 year after surgery) in our study. There was a decrease of 2.2 mm and 0.7 mm in intergonial width from T0 to T1 in SSRO group and IVRO group respectively. IVRO group had an increased intergonial width between T1 and T2 (4 years after surgery) in our study. However, the magnitude of the changes was small and there was no significant difference. It indicated extensive remodeling changes of the mandibular gonial angle were maintained during postoperative period.
Soft tissue analysis should be considered in the diagnosis of facial asymmetry patients because soft tissue reflects the skeletal components. The function of the jaw musculature is considered to be a determinant of craniofacial growth (van Spronsen et al., 1997) and development and a significant relationship has been found between the masticatory muscles and facial morphology in normal subjects (van Spronsen et al., 1997; van Spronsen et al., 1991; Weijs et al., 1984; Weijs et al., 1989). The masseter muscle is considered to generate biting or chewing force and is one of the structures that is most altered by orthognathic surgery. Functional activity and bite force have been shown to differ significantly from normal subjects in patients with mandibular prognathism (Bakke et al., 1991; Kayukawa et al., 1992; Ueda et al., 1998; Bakke et al., 1992; Sasaki et al., 1989; Hannam et al., 1989; van Spronsen et al., 1989; Ingervall et al., 1997). These factors are also reported to be altered after orthognathic surgery (Hirose et al., 1990; Zarrinkelk et al., 1995; Harper et al., 1997; Iwase et al., 1998). Orthognathic surgery can alter not only morphological aspects of the masticatory apparatus, but also functional aspects. It’s postoperative status may influence the patient’s physical appearance as well as masticatory function (Katsumata et al., 2004). Muscle morphology could also be a significant parameter to consider in planning surgery and predicting the outcome. In previous study the cross-sectional area and thickness of masticatory muscle is highly correlated with masticatory force and the patient’s physical appearance as a measure of functoinal capacity (Throckmorton et al., 2000; Sassouni et al., 1969; Ringqvist et al., 1973; Ingervall et al., 1976; Proffit et al., 1983; Ingervall et al., 1987). CT has made it possible to measure the cross-sectional area of the upper arm muscles and the jaw muscles in living subjects (Weijs et al., 1984; Xu et al., 1994). The cross-sectional area has been used frequently as a parameter of muscle size because it is highly correlated with muscle volume (van Spronsen et al., 1989; Bakke et al., 1992).
(Computed tomography) and MRI (Magnetic resonance imaging) (van Spronsen et al., 1991; Weijs et al., 1984; Xu et al., 1994). The cross-sectional images are usually obtained by scanning parallel to the horizontal or occlusal plane. Wejis et al have asserted the importance of obtaining images perpendicular to the muscle fibers and proposed scanning at 30° to the Frankfurt Horizontal plane (FH plane) for the masseter and medial pterygoid muscles (Weijs et al., 1984). However, this technique cannot be applied to patients with mandibular prognathism, since the direction of the masseter muscle in patients with mandibular prognathism is considerably different from normal (Weijs et al., 1989; Sasaki et al., 1989; Hannam et al., 1989; van Spronsen et al., 1996). In this study, the maximum cross-sectional area of the masseter muscle was measured at a level approximately 10 mm above the occlusal plane from the maxilliary second molar and the scanning level for the measurements was chosen so that metal artifacts from brackets and wires were avoided and corresponded to the roots of the maxillary teeth (Ariji et al., 2000). Previous study reported that the measured values were relatively stable and highly correlated with the volume of the masseter muscle at the level of the scan (Xu et al., 1994; Hong et al., 2006).
CT evaluation of the masseter muscle has shown that the morphology of the masseter muscle in patients with mandibular prognathism is significantly different from that in normal subjects (Ariji et al., 2000). A significant reduction in the cross-sectional area of the masseter muscle has been seen, and a tendency to revert back to the normal dimension was seen between 6 months and 1 year postoperation (Katsumata et al., 2004). In the previous study, no significant difference in the area of the masseter muscle was found between the symmetry and asymmetry groups (Ueki et al., 2006). No statistically significant difference in the area of the masseter muscle was found between the deviated side and the non-deviated side (Ueki et al., 2006). And there was no significant difference in the masseter area preoperatively and 1-year postoperatively, similar to the previous study. However, there were significant differences between right and left in ramus length, ramus width, masseter length, and masseter width preoperatively and ramus length,
masseter length, masseter width and condylar area postoperatively, although the reason was still unclear (Ueki et al., 2009).
In our study, there was an increase in maximum cross-sectional area of the masseter muscle during T0-T1 on both SSRO group and IVRO group. But there was significant difference only on the deviated side in IVRO group. In IVRO group, maximum cross-sectional area of the masseter muscle showed a smaller increase compared to SSRO group during T0-T1, but there was no significant difference of maximum cross-sectional area of the masseter muscle between SSRO group and IVRO group. In IVRO group, maximum cross-sectional area of the masseter muscle during T1-T2 showd significant increase in the ten more times than during T0-T1. Maximum cross-sectional area of the masseter muscle during T1-T2 in IVRO group showed an increase similarly to that during T0-T1 in SSRO group. It indicates maximum cross-sectional area of the masseter muscle has increased over 4 years in IVRO group. In the study measuring the cross-sectional area of masseter muscle with CT for mandibular prognathism patients after SSRO, Katsumata et al performed preoperative and postoperative CT examinations on 17 prognathic patients treated by SSRO with rigid osteosynthesis and 13 patients treated by IVRO without osteosynthesis. They found that a significant reduction was seen 3 months postoperatively and a tendency to revert back between 6 months and 1 year postoperatively. The results of this study suggest the masseter muscle may undergo reversible atrophy after mandibular setback osteotomy (Katsumata et al., 2004). However, masseter muscle length was unchanged and they concluded that temporary atrophy was observed immediately after SSRO, but recovered within 1 year after surgery. No significant difference was noted between the two surgical methods (Katsumata et al., 2004). The study by Ohkura et al suggested that occlusal force 3 years after SSRO reached the highest recorded value at the end of follow-up (3 years after surgery) (Ohkura et al., 2001). Perhaps the masseter
In our study, SSRO group showed an increase in maximum cross-sectional area of the masseter muscle on both the deviated and non-deviated sides during T0-T1. IVRO-1 group (Dev≥5mm) showed an increase in maximum cross-sectional area of the masseter muscle during T0-T1, IVRO-2 group (Dev<5mm) showed a decrease. However, we found that a significant reduction was seen 1 year postoperatively and a tendency to significant increase back between 1 year and 4 years postoperatively in IVRO-2 group (Dev<5mm). The results of our study suggested the masseter muscle may undergo reversible atrophy 1 year after mandibular setback osteotomy in IVRO-2 group (Dev<5mm). Since it turns out that the change of maximum cross-sectional area of the masseter muscle undergoes long-term influence more after IVRO than after SSRO depending on the degree of facial asymmetry, it is considered that further studies including expansion of study subjects and longitudinal study of SSRO group whether comparative study results of the two surgical methods depending on the degree of facial asymmetry can affect the choice of surgical method will be necessary in the future.
V. Conclusion
The aim of this study was to evaluate changes of gonial angle area in skeletal Class III patients with facial asymmetry following two kinds of orthognathic surgery, sagittal split ramus osteotomy (SSRO) and intraoral vertical ramus osteotomy (IVRO) using computed tomography (CT). The mandibular total volume, intergonial width, mandibular gonial angle area volume, the maximum cross-sectional area (MCSA) and angle of the masseter muscle were measured from the reconstructed three-dimensional (3D) CT images. Using 3D CT images, we evaluated this data on the deviated side and non-deviated sides. We also compared this data between SSRO group and IVRO group. The correlation between the degree of facial asymmetry and postoperative changes of mandibular gonial angle area volume and the maximum cross-sectional area of the masseter muscle were assessed and analyzed with the following results.
1. When comparing the mandibular change, during T0 (before surgery) - T1 (1 year after surgery), a significant decrease was noted in mandibular total volume, intergonial width and mandibular gonial angle area volume of non-deviated side (P<0.01, P<0.05, P<0.01), no significant difference was noted in mandibular gonial angle area volume of deviated side (P>0.05) in SSRO group. In IVRO group during T0-T1, a significant decrease was noted in mandibular total volume and mandibular gonial angle area volume on both the deviated and non-deviated sides (P<0.01), no significant difference was noted in intergonial width (P>0.05). Only mandibular total volume change was noted to be greater on IVRO group (10.6%) than SSRO group (3.3%) (P<0.01), no significant differences were noted between SSRO group and IVRO group in mandibular gonial angle area volume and intergonial width (P>0.05).
in SSRO group (P<0.01), no significant difference was noted on non-deviated side (P>0.05). In IVRO group during T0-T1, no significant difference was noted in maximum cross sectional area of the masseter muscle (P>0.05). No significant difference was noted between SSRO group and IVRO group in maximum cross-sectional area of the masseter muscle (P>0.05). During T0-T1, a significant decrease was noted in masseter muscle angle on non-deviated side in both SSRO group and IVRO group (P<0.05, P<0.01).
3. At T1 (1 year after surgery) - T2 (4 years after surgery), mandibular gonial angle area volume on both the deviated and non-deviated sides was noted to be smaller as the amount of menton deviation was greater in IVRO group (P<0.01, P<0.05). There was no correlation between the amount of menton deviation and postoperative changes in the maximum cross-sectional area and angle of the masseter muscle (P>0.05).
As a result of this study, there was no significant difference of the change in mandibular gonial angle area volume and maximum cross-sectional area of the masseter muscle except that the mandibular total volume change of IVRO group was larger than that of SSRO group in comparison of the change between SSRO group and IVRO group during T0-T1. It is considered that further studies including expansion of study subjects and longitudinal study of SSRO group whether comparative study results of the two surgical methods depending on the degree of facial asymmetry can affect the choice of surgical method will be necessary in the future.
References
Alder ME, Deahl ST, Matteson SR, et al. Short-term changes of condylar position after sagittal split osteotomy for mandibular advancement. Oral Surg Oral Med Oral Pathol
Oral Radiol Endod. 1999;87:159.
Angle AD, Rebellato J, Sheats RD. Transverse displacement of the proximal segment after bilateral sagittal split osteotomy advancement and its effect on relapse. J Oral Maxillofac
Surg. 2007;65(1):50-59.
Ariji Y, Kawamata A, Yoshida K, Sakuma S, Nawa H, Fujishita M, et al. Three-dimensional morphology of the masseter muscle in patients with mandibular prognathism. Dentomaxillofac Radiol. 2000;29:113-118.
Athanasiou AE, Mavreas D. Tomographic assessment of alterations of the temporomandibular joint after surgical correction of mandibular prognathism. Int J Adult
Orthodon Orthognath Surg. 1991;6:105.
Bakke M, Tuxen A, Vilmann P, Jensen BR, Vilmann A, Toft M. Ultrasound image of human masseter muscle related to bite force electromyography, facial morphology, and occlusal factors. Scand J Dent Res. 1992;100:164-171.
BakkeM, Michler L. Temporalis and masseter muscle activity in patients with anterior open bite and craniomandibular disorders. Scand J Dent Res. 1991;99:219-228.
Becktor JP, Rebellato J, Becktor KB, et al. Transverse displacement of the proximal segment after bilateral sagittal osteotomy. J Oral Maxillofac Surg. 2002;60:395.
Becktor JP, Rebellato J, Sollenius O, et al. Transverse displacement of the proximal segment after bilateral sagittal osteotomy: A comparison of lag screw fixation versus miniplates with monocortical screw technique. J Oral Maxillofac Surg. 2008;66:104.
Cavalcanti MG, Haller JW, Vannier MW. Three-dimensional computed tomography landmark measurement in craniofacial surgical planning: experimental validation in vitro. J
Oral Maxillofac Surg. 1999;57:690–694.
Carvalho Fde A, Cevidanes LH, da Motta AT, Almeida MA, Phillips C. Three-dimensional assessment of mandibular advancement 1 year after surgery. Am J Orthod Dentofacial
Orthop. 2010;137:53-55.
Cevidanes LH, Bailey LJ, Tucker SF, Styner MA, Mol A, Phillips CL, Proffit WR, Turvey T. Three-dimensional cone-beam computed tomography for assessment of mandibular changes after orthognathic surgery. Am J Orthod Dentofacial Orthop. 2007;131(1):44-50.
Chen CM, Lai SS, Wang CH, Wu JH, Lee KT, Lee HE. The stability of intraoral vertical ramus osteotomy and factors related to skeletal relapse. Aesthetic Plast Surg. 2011;35(2):192-197.
Choi HS, Rebellato J, Yoon HJ, Lund BA. Effect of mandibular setback via bilateral sagittal split ramus osteotomy on transverse displacement of the proximal segment. J Oral
Choung PH. A new osteotomy for the correction of mandibular prognathism: Techniques and rationale of the intraoral verticosagittal ramus osteotomy. J Craniomaxillofac Surg. 1992;20:153.
Christiansen EL, Thompson JR, Kopp S. Intra- and interobserver variability and accuracy in the determination of linear and angular measurements in computed tomography. An in vitro and in situ study of human mandibles. Acta Odontol Scand. 1986;44:221–229.
Claudio R, Claudio U, Alessandro A, Massimiliano T, Angelo M. Variations of the gonial angle in vertical surgical reduction of the maxillary-mandibular complex.
J Craniofac Surg. 2005;16(4):716-719.
Costa F, Robiony M, Politi M. Stability of sagittal split ramus osteotomy used to correct Class III malocclusion: Review of the literature. Int J Adult Orthodont Orthognath Surg. 2001;16:121.
Costa F, Robiony M, Sembronio S, et al. Stability of skeletal Class III malocclusion after combined maxillary and mandibular procedures. Int J Adult Orthodont Orthognath Surg. 2001;16:179.
Draenert FG, Erbe C, Zenglein V, Kämmerer PW, Wriedt S, Al Nawas B. 3D analysis of condylar position after sagittal split osteotomy of the mandible in mono- and bimaxillary orthognathic surgery - a methodology study in 18 patients. J Orofac Orthop. 2010;71(6): 421-429.
Gomes MA, Wisth PJ, Tornes K, Be OE. Skeletofacial changes by mandibular advancement using sagittal split osteotomies. Int J Adult Orthodon Orthognath Surg. 1993;8(2):87-94.
Greebe RB, Tuinzing DB. Overcorrection and relapse after the intraoral vertical ramus osteotomy. A one-year postoperative review of thirty-five patients. Oral Surg Oral Med
Oral Pathol. 1982;54:382.
Grummons DC, Kappeyne van de Coppello MA. A frontal asymmetry analysis. J Clin
Orthod. 1987;21:448–465.
Guglielmi M, Schneider KM, Iannetti G, Feng C, Martinez AY. Orthognathic surgery for correction of patients with mandibular excess: don't forget to assess the gonial angle. J
Oral Maxillofac Surg. 2013;71(6):1063-1072.
Hajeer MY, Ayoub AF, Millett DT. Three-dimensional assessment of facial soft-tissue asymmetry before and after orthognathic surgery. Br J Oral Maxillofac Surg. 2004;42:396.
Hall DH, BELL WH. Intraoral vertical ramus osteotomy; Surgical Correction of Dento facial Deformities, II. Philadelphia: Saunders. 1980:890-895,
Hall HD, Chase DC, Payor LG. Evaluation and refinement of the intraoral vertical subcondylar osteotomy. J Oral Surg. 1975;33:333.
Hannam AG, Wood WW. Relationships between the size and spatial morphology of human masseter and medial pterygoid muscles, the craniofacial skeleton, and jaw biomechanics. Am J Phys Anthropol. 1989;80:429-445.
Haraguchi S, Takada K, Yasuda Y. Facial asymmetry in subjects with skeletal Class III deformity. Angle Orthod. 2002;72:28-35.
Harper RP, de Bruin H, Burcea I. Muscle activity during mandibular movements in normal and mandibular retrognathic subjects. J Oral Maxillofac Surg. 1997;55:225-233.
Harris MD, Van Sickels JE, Alder M. Factors influencing condylar position after the bilateral sagittal split osteotomy fixed with bicortical screws. J Oral Maxillofac Surg. 1999;57:650.
Hirose K. The study of the relationships between the masticatory muscles activity and the craniofacial morphology in mandibular prognathism. Shigaku. 1990;78:49-62.
Hong JH, Yu HS. The analysis of masseter muscle in facial asymmetry using 3-dimensional computed tomography. A dissertation thesis of department of Dentistry and the graduate school of Yonsei university. 2006. Korean.
Ingervall B. Facial morphology and activity of temporal and lip muscles during swallowing and chewing. Angle Orthod. 1976;46:372-380.
Ingervall B, Bitsanis E. A pilot study of the effect of masticatory muscle training on facial growth in long-face children. Eur J Orthod. 1987;9:15-23.
Ingervall B, Minder C. Correlation between maximum bite force and facial morphology in children. Angle Orthod. 1997;67:415-422.