ⓒ2009 The Korean Nutrition Society and the Korean Society of Community Nutrition
Dietary patterns associated with hypertension among Korean males
Young Ok Kim §
Department of Food and Nutrition, Dongduk Women’s University, 23-1 Wolgok-dong, Sungbuk-gu, Seoul 136-714, Korea¹
Received April 16, 2009; Revised June 8, 2009; Accepted June 17, 2009
Abstract
The objectives of this study were to identify the dietary patterns associated with hypertension among Korean males. Data from the 2001 Korean National Health and Nutrition Survey of 1,869 men aged 20-65 years were used for the analysis. As an initial analysis, a factor analysis was applied to identify major dietary patterns among the subjects. Then logistic regression analysis was conducted to identify the pattern related with hypertension.
As a result of the initial analysis, three major dietary patterns were identified. Dietary pattern 1 (traditional) was heavily loaded with vegetables, fish and cereal. Dietary pattern 2 (Western) was loaded with fast foods, bread, meats and dairy products. Dietary pattern 3 (Drinker) was loaded with mostly pork, beer and soju (Korean liquor). From the second stage of the analysis, there was a tendency of positive association between traditional patterns and hypertension risks. However, the tendency did not meet statistical significance level (p<0.05). In summary, unlikely findings from European and American studies, vegetables rich traditional dietary patterns did not show any protective effect on hypertension in Korean males. The Korean dietary practice, which is consuming salted vegetables instead of fresh vegetables, might have played a role in these findings. However, the full explanation of the findings remained to be answered with further investigation since none of the dietary patterns identified showed any statistical significance.
Key Words: Dietary pattern, hypertension, Korean, factor analysis, odds ratio
Introduction 14)
Although Korea has achieved a high standard of living and health promotion during the last 40 years, hypertension is still a major public health problem. According to the Korean Health Survey (Ministry of Health and Social Welfare, 1999), 27.8%
of adult Koreans have hypertension. It was 27.9% in the 2005 survey (Ministry of Health and Social Welfare, 2005). Strokes triggered by hypertension were one of the six leading causes of death in Korea. Twenty seven point three out of 100,000 deaths were caused by hypertension and the number contributed nearly 70% of deaths from all cardiovascular diseases (Kim et al., 2005).
There is general consensus that blood pressure is related with health behaviors of smoking, drinking, exercise and diet. Studies showed that blood pressure is positively related with smoking (Fogari et al., 1996; Geory et al., 1991; Imamura et al., 1996), alcohol consumption (Gruchow et al., 1985; Marmot et al., 1994;
Puddey et al., 1985) and negatively related with physical exercise (Arroll & Beaglehole, 1992; Blair et al., 1984; Paffenbarger et al., 1983).
Desirable food habits for preventing hypertension included increasing consumption of whole grains, vegetables, and fruits (Appel et al., 1997; Midgley et al., 1996; Stamler et al., 1996) are well documented from European and American studies.
However, because dietary patterns of Koreans differ from people
of other countries, the effect could be different. Moreover, many studies have examined the association between the intake of individual nutrients or foods and the risk of hypertension, but only recently has attention focused on the relationship of overall dietary patterns to health risk (Lin et al., 2003). In comparison to individual foods or nutrients, dietary patterns are more realistic in describing the relation of diet to health and disease (Maskarinec et al., 2000), because people do not eat isolated nutrients, but rather meals composed of a variety of foods. Complex combinations of nutrients from the food may interact (Randall et al., 1992).
From 1998, the World Health Organization (WHO) had suggested that dietary guidance for populations should be based on foods instead of nutrients (World Health Organization, 1998).
In the present investigation, identification of the dietary patterns of Korean males which are related with hypertension was carried out using the national survey data.
Materials and Methods
Data source
The food frequency dietary data of 1,869 male subjects aged 20-65 years from the 2001 Korean National Health and Nutrition Examination Survey (KHANES) were used in the analysis. The
§
Corresponding Author: Young Ok Kim, Tel. 82-2-940-4463, Fax. 82-2-940-4193, Email. [email protected]
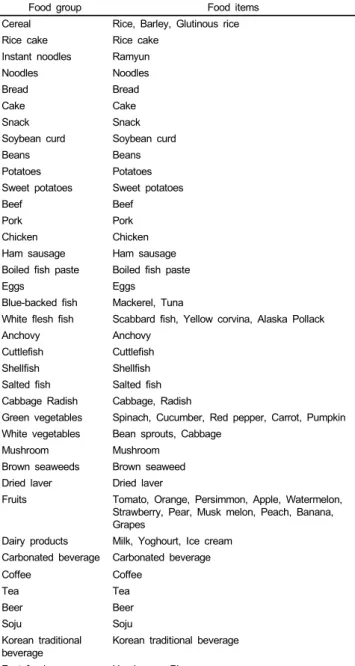
Table 1. Food groups and food items used in dietary pattern analysis
Food group Food items
Cereal Rice, Barley, Glutinous rice
Rice cake Rice cake
Instant noodles Ramyun
Noodles Noodles
Bread Bread
Cake Cake
Snack Snack
Soybean curd Soybean curd
Beans Beans
Potatoes Potatoes
Sweet potatoes Sweet potatoes
Beef Beef
Pork Pork
Chicken Chicken
Ham sausage Ham sausage Boiled fish paste Boiled fish paste
Eggs Eggs
Blue-backed fish Mackerel, Tuna
White flesh fish Scabbard fish, Yellow corvina, Alaska Pollack
Anchovy Anchovy
Cuttlefish Cuttlefish Shellfish Shellfish Salted fish Salted fish Cabbage Radish Cabbage, Radish
Green vegetables Spinach, Cucumber, Red pepper, Carrot, Pumpkin White vegetables Bean sprouts, Cabbage
Mushroom Mushroom
Brown seaweeds Brown seaweed Dried laver Dried laver
Fruits Tomato, Orange, Persimmon, Apple, Watermelon, Strawberry, Pear, Musk melon, Peach, Banana, Grapes
Dairy products Milk, Yoghourt, Ice cream Carbonated beverage Carbonated beverage
Coffee Coffee
Tea Tea
Beer Beer
Soju Soju
Korean traditional
beverage Korean traditional beverage Fast food Hamburger, Pizza
62 items food frequency questionnaire was employed for the dietary survey. Detailed information about the 2001 KHANES is described elsewhere (Kim et al., 2005; Ministry of Health and Welfare, 2005).
In brief, for the subject, they were selected based on stratified multistage probability sampling from the total Korean population;
therefore, we can have the generalization from these findings to the general Korean population.
Assessment of hypertension
Among the data from the 2001 Korean National Health and Nutrition Survey (KHANES), data of systolic and diastolic blood
pressure in a health examination survey were used for the analysis. Hypertension was defined as a systolic blood pressure above 140mmHg or diastolic blood pressure above 90 mmHg
Assessment of dietary patterns
Factor analysis (Gorsuch, 1983) was conducted to derive dietary patterns from food consumption frequency of 38 food items, using the Factor procedures in SAS (version 8; SAS Institute, Cary, NC). Table 1 shows 38 food items which were categorized from 62 groups to reduce the complexity of the data.
The food groups were categorized based on the principles of similarity of nutrient profiles, or culinary usage of the foods, mainly according to the Standard Tables of Food Composition in Korea, 6 th Revised Edition (National Rural Living Science Institute, 2001), and the classification of food groups used by the National Nutrition Survey.
The factors were rotated by an orthogonal transformation (Varimax rotation function in SAS) to achieve simpler structure with greater interpretability. We considered components with an Eigen value greater than 1.6 as a significant factor. Eigen value 1.6 were identified as a break-point in the Screen plot and an interpretable level from previous study done by Schulz et al (2003). This served to limit the number of factors, as well as to better identify more meaningful factors. After Varimax rotation, factor scores were saved from the principal component analysis for each individual. All data presented here are from the Varimax rotation. Factor scores were categorized into quintile based on the distribution of the study population.
Statistical analysis for association
To determine the association between dietary patterns and hypertension, the odds ratios (OR) estimated for each quintile compared with the lowest quintile of each dietary pattern using Logistic regression analysis. In this analysis, age, smoking habit, drinking habit and physical activity were used as covariates based on the results of initial analysis. But, in the analysis of drinker pattern, the drinking habit as covariate was excluded.
Results
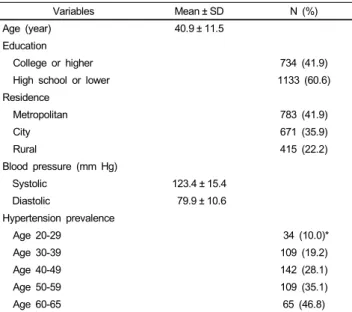
The characteristics of the study subjects are shown in Table 2. The mean age of the subjects was 40.9 years. The residential areas of the subjects were categorized as metropolitan city (41.9%), middle or small city (35.9%) and rural (22.2%). Among the study subjects, 41.9% of them had education levels of more than collage education.
Mean systolic and diastolic blood pressures were 123.4 and 79.9 mmHg, respectively. Hypertension prevalence was 10.0%
(20-29 years), 19.2% (30-39 years), 28.1% (40-49 years), 35.1%
(50-59 years) and 46.8% (60-65 years).
Table 2. General characteristics of study subjects (n=1,869)
Variables Mean ± SD N (%)
Age (year) 40.9 ± 11.5
Education
College or higher 734 (41.9)
High school or lower 1133 (60.6)
Residence
Metropolitan 783 (41.9)
City 671 (35.9)
Rural 415 (22.2)
Blood pressure (mm Hg)
Systolic 123.4 ± 15.4
Diastolic 79.9 ± 10.6
Hypertension prevalence
Age 20-29 34 (10.0)*
Age 30-39 109 (19.2)
Age 40-49 142 (28.1)
Age 50-59 109 (35.1)
Age 60-65 65 (46.8)
* Prevalence adjusted with age population.
Table 3. Factor-loading matrix for 3 major dietary patterns identified from Korean males
Food group Factor1
(pattern 1)
Factor2 (pattern 2)
Factor3 (pattern 3)
Green vegetables 0.64 - -
Brown seaweed 0.64 - -
Mushroom 0.59 - -
White flesh fish 0.57 - -
Blue-backed fish 0.52 - 0.25
Anchovy 0.52 - -
White vegetables 0.50 - -
Dried laver 0.48 - -
Potato 0.43 0.25 -
Beef 0.41 0.31 -
Shellfish 0.41 - -
Fruits 0.39 - -
Pork 0.39 0.28 0.37
Eggs 0.38 0.31 -
Cabbage radish 0.35 -0.27 -
Salted fish 0.33 - -
Soybean curd 0.33 0.30 -
Sweet potato 0.27 0.27 -
Tea - - -
Fast food - 0.60 -
Bread - 0.53 -
Ham sausage - 0.53 -
Snack - 0.52 -
Carbonated beverage - 0.51 -
Instant noodles - 0.51 -
Dairy products - 0.48 -0.19
Chicken 0.34 0.46 0.37
Cake - 0.42 -
Boiled fish paste - 0.42 -
Cuttlefish 0.26 0.31 -
Noodles - 0.30 -
Rice cake - 0.26 -
Beer - - 0.62
Soju - - 0.62
Korean traditional beverage - - 0.35
Coffee - - -
Beans 0.29 - -0.30
Cereal 0.26 - -0.31
Variance explained (%) 5.78 3.66 2.06
Values are factor loadings; absolute values < 0.25 are not displayed for simplicity.
Table 3 showed dietary patterns identified from the factor analysis in terms of the factor-loading matrixes for the 3 major dietary patterns. The 3 major dietary patterns were retained in Screen plot Eigen values for males. In the model, the greater the loading of a given food item to the factor, the larger the contribution of that food item to a specific factor. And a negative loading designates negative association with the factor, while a positive loading designates positive association with the factor.
Dietary pattern 1, which was loaded heavily on vegetables, brown seaweed, fish, mushroom, modestly loaded with pork, chicken, egg with cereal, could be labeled the ‘traditional’
pattern.
Dietary pattern 2 was heavily loaded with fast food, bread, ham, modestly loaded with dairy product, chicken, fish paste and negatively loaded with cabbage (radish) could be labeled the
‘western’ pattern. Dietary pattern 3 which was heavily loaded with beer and soju, modestly loaded with pork and then negatively loaded with beans, cereal, and dairy products could be labeled as the ‘drinker’ pattern.
Table 4 shows mean blood pressure according to quintile of dietary patterns among subjects.
Diastolic blood pressure were increased with quintile of pattern 1 (traditional) up to 4 th quintile and then decreased at the 5 th quintile.
Both systolic and diastolic blood pressure did not show any significant variation with quintile of dietary pattern 2 (western).
Systolic blood pressure increased at quintile 2 of dietary pattern 3 (drinker pattern) and then decrease from the quintile 3.
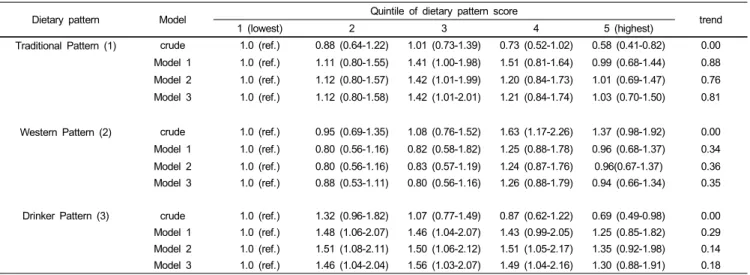
Table 5 showed the results of second stage of analysis based on logistic regression analysis. It showed hypertension risk (in terms of odd ratio) according to the quintile of three dietary patterns identified by 4 analytical models. Crude model was built without adjusting covariance. Model 1 was built with adjusting
for age, education, smoking, and drinking status. Model 2 was built with additionally adjusting for physical activity on model 1. Model 3 was built with further adjustments for energy intake on model 2.
In the crude model, hypertension risk was reduced with
increasing consumption of traditional dietary pattern (pattern 1)
except 2 nd quintile). Models 1, 2, and 3 did not show any
significant relationship between hypertension and traditional
dietary pattern (pattern 1). Even though it was not statistically
significant, there was a tendency that hypertension risk increased
Table 4. Multivariate adjusted means of systolic and diastolic blood pressure across quintile of dietary pattern score adjusted for age, smoking status, drinking status and physical activity
Dietary pattern Quintile of dietary pattern score p for
trend
1 (lowest) 2 3 4 5 (highest)
Pattern 1
Systolic blood pressure 127.6 ± 15.9 123.9 ± 18.0 124.6 ± 15.3 122.4 ± 13.6 121.4 ± 13.6 0.28 Diastolic blood pressure 79.9 ± 10.2 80.0 ± 11.4 81.2 ± 11.1 81.2 ± 10.4 78.7 ± 9.83 0.02
Pattern 2
Systolic blood pressure 123.2 ± 14.5 122.2 ± 14.3 122.9 ± 15.2 124.7 ± 15.3 123.9 ± 17.5 0.27 Diastolic blood pressure 80.1 ± 10.1 78.6 ± 10.6 80.3 ± 10.6 80.6 ± 10.6 79.9 ± 11.1 0.08 Pattern 3
Systolic blood pressure 123.2 ± 16.6 125.8 ± 16.1 123.9 ± 16.1 122.2 ± 13.8 121.8 ± 13.9 0.01 Diastolic blood pressure 79.9 ± 11.3 81.6 ± 10.8 80.1 ± 11.2 78.9 ± 9.89 79.1 ± 9.60 0.05 Values are mean ± SD calculated using ANCOVA adjusted for age, smoking status, drinking status, and physical activity.
Table 5. Odds ratios (95% confidence intervals) of hypertension risk by dietary pattern
Dietary pattern Model Quintile of dietary pattern score
trend
1 (lowest) 2 3 4 5 (highest)
Traditional Pattern (1) crude 1.0 (ref.) 0.88 (0.64-1.22) 1.01 (0.73-1.39) 0.73 (0.52-1.02) 0.58 (0.41-0.82) 0.00 Model 1 1.0 (ref.) 1.11 (0.80-1.55) 1.41 (1.00-1.98) 1.51 (0.81-1.64) 0.99 (0.68-1.44) 0.88 Model 2 1.0 (ref.) 1.12 (0.80-1.57) 1.42 (1.01-1.99) 1.20 (0.84-1.73) 1.01 (0.69-1.47) 0.76 Model 3 1.0 (ref.) 1.12 (0.80-1.58) 1.42 (1.01-2.01) 1.21 (0.84-1.74) 1.03 (0.70-1.50) 0.81
Western Pattern (2) crude 1.0 (ref.) 0.95 (0.69-1.35) 1.08 (0.76-1.52) 1.63 (1.17-2.26) 1.37 (0.98-1.92) 0.00 Model 1 1.0 (ref.) 0.80 (0.56-1.16) 0.82 (0.58-1.82) 1.25 (0.88-1.78) 0.96 (0.68-1.37) 0.34 Model 2 1.0 (ref.) 0.80 (0.56-1.16) 0.83 (0.57-1.19) 1.24 (0.87-1.76) 0.96(0.67-1.37) 0.36 Model 3 1.0 (ref.) 0.88 (0.53-1.11) 0.80 (0.56-1.16) 1.26 (0.88-1.79) 0.94 (0.66-1.34) 0.35
Drinker Pattern (3) crude 1.0 (ref.) 1.32 (0.96-1.82) 1.07 (0.77-1.49) 0.87 (0.62-1.22) 0.69 (0.49-0.98) 0.00 Model 1 1.0 (ref.) 1.48 (1.06-2.07) 1.46 (1.04-2.07) 1.43 (0.99-2.05) 1.25 (0.85-1.82) 0.29 Model 2 1.0 (ref.) 1.51 (1.08-2.11) 1.50 (1.06-2.12) 1.51 (1.05-2.17) 1.35 (0.92-1.98) 0.14 Model 3 1.0 (ref.) 1.46 (1.04-2.04) 1.56 (1.03-2.07) 1.49 (1.04-2.16) 1.30 (0.88-1.91) 0.18
1