Qualitative and Quantitative Analysis of Thirteen Marker Components in Traditional Korean Formula, Samryeongbaekchul-san using an Ultra-Performance Liquid Chromatography Equipped with Electrospray Ionization Tandem Mass Spectrometry
9
0
0
전체 글
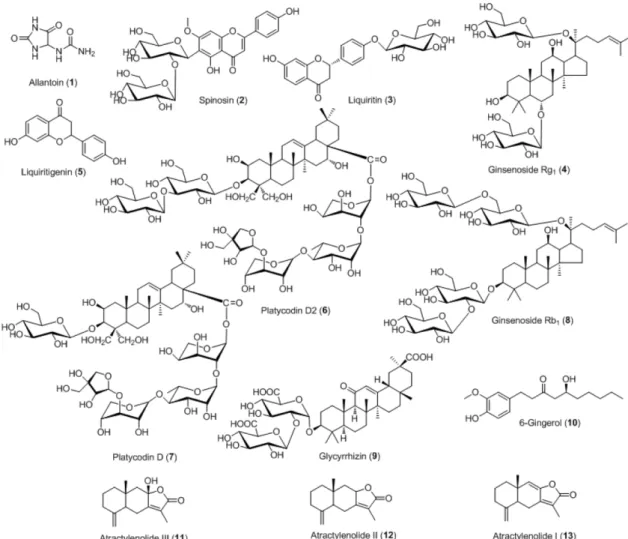
(2) Natural Product Sciences. 94. Fig. 1. Chemical structures of the compounds 1 - 13 in Samryeongbaekchul-san.. Experimental Plant materials – The twelve crude herbal medicines forming SRBCS was purchased from the Korean herbal market, Kwangmyungdang Medicinal Herbs (Ulsan, Korea) in February 2012 and identified by Prof. Je Hyun Lee, Dongguk University, Gyeongju, Korea. Voucher specimens (2012-KE39-1 ~ KE39-12) have been deposited at the Kherb Research Center, Korea Institute of Oriental Medicine. General experimental procedures – As the reference standards, compound 1 was purchased from SigmaAldrich (St. Louis, MO, USA) and compounds 2, 4, and 6 were obtained from Biopurify Phytochemicals (Chengdu, China). Compounds 3 and 8 - 10 were purchased from Wako Chemicals (Osaka, Japan) and compounds 5 and 7 were obtained from ChemFaces (Wuhan, China). Compounds 11 - 13 were purchased from KOC Biotec. (Daejeon, Korea). The purities of all reference standards were ≥ 98.0% (Fig. 1). For qualitative and quantitative. analysis, HPLC-grade methanol, acetonitrile and water were purchased from J.T. Baker (Phillipsburg, NJ, USA) and analytical reagent-grade, formic acid was purchased from Sigma-Aldrich (St. Louis, MO, USA). Apparatus – The chromatographic system was used a Waters ACQUITY UPLC system (Milford, MA, USA), consisting of a pump, degasser, column oven, and autosampler. The chromatographic separation of the compounds 1 - 13 was carried out on an ACQUITY UPLC BEH C18 column (2.1 × 100 mm, 1.7 μm). The LC-MS/MS system used was the Waters ACQUITY TQD LC-MS/MS system (Milford, MA, USA) with an electrospray ionization (ESI) source. All data was collected and analyzed using Waters MassLynx software (version 4.1, Milford, MA, USA). Preparation of standard solutions – Reference compounds 1 - 13 were accurately weighed and dissolved in methanol at a concentration of 1.0 mg/mL. Each standard stock solution was kept at 4 oC and used after serial dilution with methanol in order to prepare the calibration curves..
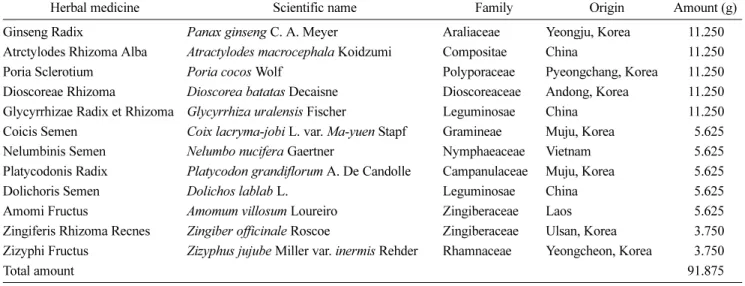
(3) Vol. 22, No. 2, 2016. 95. Table 1. Composition of Samryeongbaekchul-san Herbal medicine Ginseng Radix Atrctylodes Rhizoma Alba Poria Sclerotium Dioscoreae Rhizoma Glycyrrhizae Radix et Rhizoma Coicis Semen Nelumbinis Semen Platycodonis Radix Dolichoris Semen Amomi Fructus Zingiferis Rhizoma Recnes Zizyphi Fructus Total amount. Scientific name. Family. Panax ginseng C. A. Meyer Atractylodes macrocephala Koidzumi Poria cocos Wolf Dioscorea batatas Decaisne Glycyrrhiza uralensis Fischer Coix lacryma-jobi L. var. Ma-yuen Stapf Nelumbo nucifera Gaertner Platycodon grandiflorum A. De Candolle Dolichos lablab L. Amomum villosum Loureiro Zingiber officinale Roscoe Zizyphus jujube Miller var. inermis Rehder. Araliaceae Compositae Polyporaceae Dioscoreaceae Leguminosae Gramineae Nymphaeaceae Campanulaceae Leguminosae Zingiberaceae Zingiberaceae Rhamnaceae. Origin. Amount (g). Yeongju, Korea China Pyeongchang, Korea Andong, Korea China Muju, Korea Vietnam Muju, Korea China Laos Ulsan, Korea Yeongcheon, Korea. 11.250 11.250 11.250 11.250 11.250 5.625 5.625 5.625 5.625 5.625 3.750 3.750 91.875. Table 2. Conditions for the LC-MS/MS analysis of Samryeongbaekchul-san HPLC condition Column Flow rate Injection volume Column temperature Sample temperature. ACQUITY UPLC BEH C18 (100 × 2.1 mm, 1.7 µm) 0.3 mL/min 2.0 µL 45°C 5°C Time (min). Mobile phase. MS condition Capillary voltage (kV) Extract voltage (V) Source temp. (°C) RF lens (V) Desolvation temp. (°C) Desolvation gas (L/h) Cone gas (L/h) Collision gas (mL/min). 0 0.1 14.0 15.0 15.1 18.1. A (%)a 80 80 5 0 80 80. B (%)b 20 20 95 100 20 20. 3.3 3.0 120 0.3 300 600 50 0.14. a. 0.1% (v/v) formic acid in water, bAcetonitrile. Preparation of SRBCS water decoction and sample solutions – The SRBCS is composed of the twelve crude herbal medicines and these herbs was mixed with a total weight of 5.0 kg as shown in Table 1 (about 54.4 times of composition of single dose). The mixed sample was extracted in a 10-fold mass of water at 100 oC for 2 h under pressure (98 kPa) using an electric extractor (COSMOS-660; Kyungseo Machine Co., Incheon, Korea). The water extract. was filtered through a standard sieve (no. 270, 53 μm; Chung Gye Sang Gong Sa, Seoul, Korea) and lyophilized by freeze-drier (PVTFD10RS, IlShinBioBase, Yangju, Korea). The amount of SRBCS extract was 705.0 g (14.1%). For qualitative and quantitative analysis of the marker components by LC-MS/MS, 54.2 mg of the lyophilized SRBCS powder was dissolved in 5 mL of 70% methanol by sonication for 5 min. Subsequently, the.
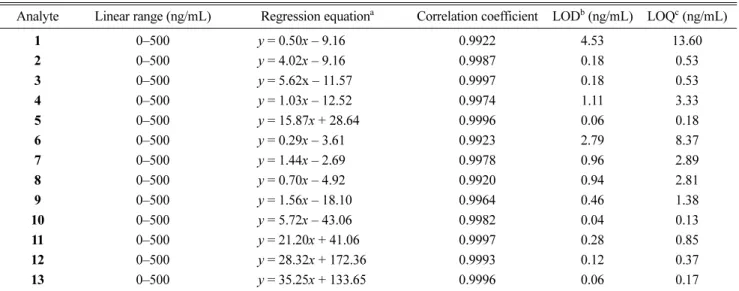
(4) Natural Product Sciences. 96. culated by plotting the peak areas (y) versus the corresponding concentrations (x, ng/mL) using standard solutions. For the calibration curves, five concentrations of each compound (0, 10, 50, 100, and 500 ng/mL) were prepared and measured in triplicate. The LOD and LOQ data under the present chromatographic conditions were determined at signal-to-noise (S/N) ratios of approximately 3 and 10, respectively.. solution was diluted 100-fold and filtered through a 0.22 μm membrane filter before the LC-MS/MS system injection. Liquid chromatographic conditions – The mobile phase consisting of 0.1% (v/v) formic acid in water (A) and acetonitrile (B) was flowed with gradient elution at a flow rate of 0.3 mL/min. These conditions are summarized in Table 2. LC–MS/MS conditions – The MS conditions were as follows: capillary voltage 3.3 kV, extractor voltage 3.0 V, RF lens voltage 0.3 V, source temperature 120 oC, desolvation temperature 300 oC, desolvation gas 600 L/h, cone gas 50 L/h and collision gas 0.14 mL/min (Table 2). Calibration curves, limits of detection (LOD), and quantification (LOQ) – Each calibration curve was cal-. Result and Discussion Linearity, range, LOD, and LOQ – The linearity of this method was evaluated from the correlation coefficient (r2) of the calibration curves of the thirteen compounds.. Table 3. Linearities, regression equation, correlation coefficients, LOD, and LOQ for the compounds 1 - 13 Analyte. Linear range (ng/mL). 1 2 3 4 5 6 7 8 9 10 11 12 13. 0–500 0–500 0–500 0–500 0–500 0–500 0–500 0–500 0–500 0–500 0–500 0–500 0–500. Regression equationa. Correlation coefficient. LODb (ng/mL). LOQc (ng/mL). 0.9922 0.9987 0.9997 0.9974 0.9996 0.9923 0.9978 0.9920 0.9964 0.9982 0.9997 0.9993 0.9996. 4.53 0.18 0.18 1.11 0.06 2.79 0.96 0.94 0.46 0.04 0.28 0.12 0.06. 13.60 0.53 0.53 3.33 0.18 8.37 2.89 2.81 1.38 0.13 0.85 0.37 0.17. y = 0.50x – 9.16 y = 4.02x – 9.16 y = 5.62x – 11.57 y = 1.03x – 12.52 y = 15.87x + 28.64 y = 0.29x – 3.61 y = 1.44x – 2.69 y = 0.70x – 4.92 y = 1.56x – 18.10 y = 5.72x – 43.06 y = 21.20x + 41.06 y = 28.32x + 172.36 y = 35.25x + 133.65. a. y: peak area of compounds; x: concentration (ng/mL) of compounds, bLOD = 3 × signal-to-noise ratio, cLOQ = 10 × signal-to-noise ratio.. Table 4. Mass detection condition of the compounds 1 - 13 Analyte. Molecular weight (Da). Ionization mode. Retention time (min). Precursor ion (m/z). Product ion (m/z). Cone voltage (V). Collision energy (eV). 1 2 3 4 5 6 7 8 9 10 11 12 13. 158.12 608.54 418.39 801.01 256.25 1387.48 1225.32 1109.29 822.93 294.39 248.32 232.32 230.13. [M−H]− [M+H]+ [M−H]− [M−H]− [M+H]+ [M−H]− [M−H]− [M−H]− [M−H]− [M+H]+ [M+H]+ [M+H]+ [M+H]+. 0.80 1.36 1.65 2.69 2.98 3.29 3.38 4.34 5.20 6.16 6.71 8.24 9.33. 157.0 609.6 417.4 800.4 257.1 1386.4 1224.1 1107.4 821.8 295.2 249.3 233.2 231.2. 96.9 327.1 255.3 637.0 137.0 843.6 469.4 178.8 351.0 177.2 231.2 187.1 185.1. 20 40 30 50 35 45 45 50 45 13 25 35 35. 15 25 15 20 25 48 48 45 40 10 10 15 20.
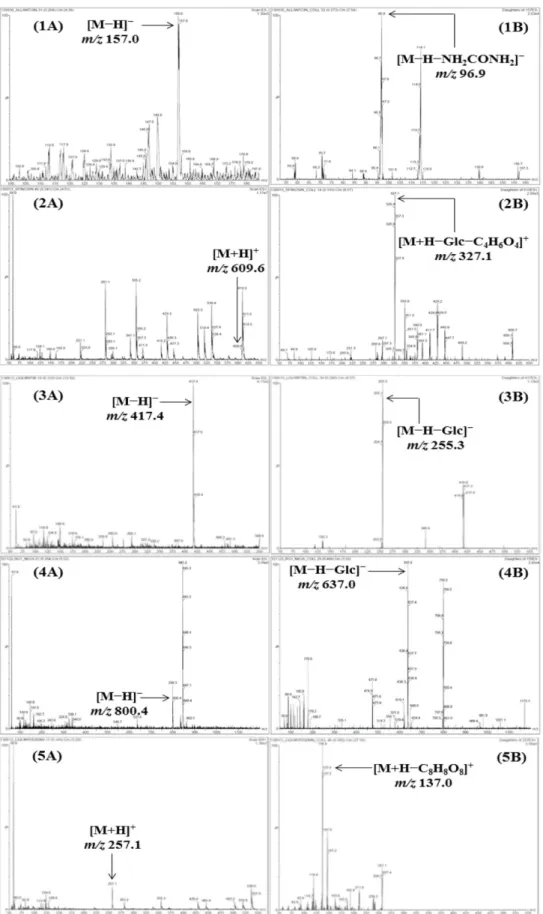
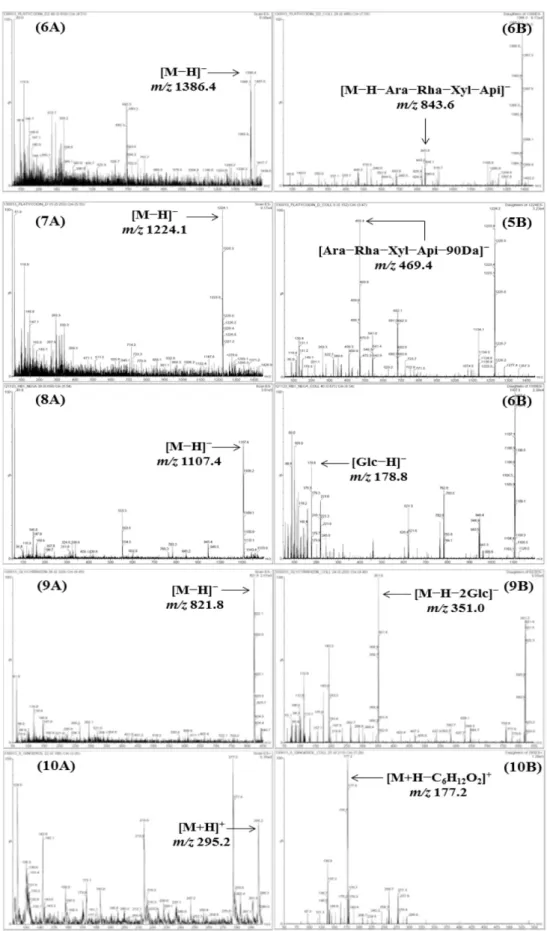
(5) Vol. 22, No. 2, 2016. 97. Fig. 2. Mass spectra of the precursor ion (Q1, A) and product ion (Q3, B) for LC-MS/MS MRM mode of the compounds 1 - 13. Allantoin (1), spinosin (2), liquiritin (3), ginsenoside Rg1 (4), liquiritigenin (5), platycodin D2 (6), platycodin D (7), ginsenoside Rb1 (8), glycyrrhizin (9), 6-gingerol (10), atractylenolide III (11), atractylenolide II (12), and atractylenolide I (13)..
(6) 98. Fig. 2. contineud. Natural Product Sciences.
(7) Vol. 22, No. 2, 2016. 99. Fig. 2. contineud. Calibration curves of each compound showed good linearity with r2 ≥ 0.9920 in the different concentration ranges (Table 3). The LOD and LOQ values of the tested compounds 1 - 13 were in the ranges of 0.01 - 4.53 ng/mL and 0.03 - 13.60 ng/mL, respectively. Peak identification of the compounds 1 - 13 – The mass spectral data for peak identification of the marker components using the established MS conditions were measured in the negative and positive ion modes. Compounds 1, 3, 4, and 6 - 9 were detected in the negative ion mode ([M–H]–) at m/z 157.0, 417.4, 799.2, 1386.4, 1224.3, 1107.5, and 821.9, respectively, and compounds 2, 5, and 10 - 13 were detected in the positive ion mode ([M+H]+) at m/z 609.5, 257.2, 295.3, 249.3, 233.3, and 231.2, respectively (Table 4 and Fig. 2). LC-MS/MS MRM conditions including precursor ion (Q1), product ion (Q3), cone voltage, and collision energy for quantitative determination were set as Table 4 and Fig. 2. Compound 1 was detected at m/z 157.0 (Q1) and tended to eliminate. NH2CONH2 to produce the fragmentation peaks m/z 96.9 (Q3) [M–H–NH2CONH2]–.10 Q3 peak of compound 2 (Q1 m/z 609.6) was detected at m/z 327.1 [M+H–Glc– C4H6O4]+, which is lost the one glucose and C4H6O4 group in precursor ion.11 Compounds 3 (Q1 m/z 417.4) and 4 (Q1 m/z 800.4) are apt to lose the glucose to produce aglycone ions of m/z 255.3 and 637.0 [M–H– Glu]–, respectively.12,13 The Q3 peaks of compounds 5 and 10 were detected at m/z 137.0 [M+H–C8H8O8]+ and 115.1 [M+H–C6H12O2]+, respectively, by eliminating C8H8O8 and C6H12O2 group from the each precursor ion.12-14 Compounds 6 and 7 were detected at at m/z 843.6 [M–H–Ara–Rha–Xyl–Api]– and 469.4 [Ara–Rha–Xyl– Api–90Da]–, these ions were formed by loss of Ara–Rha– Xyl–Api and Ara–Rha–Xyl–Api–90Da bonded to a 28carbon from each precursor ion.15 The Q1 peak ion of compound 8 exhibited an [M–H]– at m/z 1107.4 and the characteristic MS fragmentation was observed at m/z 178.8 [Glc–H]–.13 Compounds 9 and 11 were detected at.
(8) 100. Natural Product Sciences. Fig. 3. Total ion chromatograms of the standard solution (A) and Samryeongbaekchul-san sample (B) by LC-MS/MS MRM mode. Allantoin (1), spinosin (2), liquiritin (3), ginsenoside Rg1 (4), liquiritigenin (5), platycodin D2 (6), platycodin D (7), ginsenoside Rb1 (8), glycyrrhizin (9), 6-gingerol (10), atractylenolide III (11), atractylenolide II (12), and atractylenolide I (13).. m/z 351.0 [M–H–2Glc]– and 231.2 [M+H–H2O]+ by eliminating two glucose and one H2O molecule, respectively from the each precursor ion.12-16 The MS fragmentations of compounds 12 and 13 were detected at m/z 187.1 [M+H–H2O–CO]+, and 185.1 [M+H–H2O– CO]+, with the loss of both one H2O molecule and CO group from the parent ion [M+H]+ at m/z 233.2 and 231.2.16 Simultaneous determination of the compounds 1–13 in SRBCS – The developed analytical method using LC–. MS/MS was applied to the simultaneous determination of the compounds 1 - 13 in the SRBCS sample (Fig. 3). Consequently, the concentration of the compounds 1 - 13 in the SRBCS decoction were detected up to 12,253.69 μg/g (Table 5). Furthermore, compounds 9, which are major component of G. uralensis was found in concentrations of 12,253.69 μg/g and the most abundant compounds in the SRBCS extract. And then compounds 3 and 1 were detected 5,239.85 and 1,570.42 μg/g. These.
(9) Vol. 22, No. 2, 2016. 101. Table 5. Contents of the compounds 1 - 13 in Samryeongbaekchul-san (n = 3) Amount (µg/g). Compound 1 2 3 4 5 6 7 8 9 10 11 12 13. Mean. SD. RSD (%). 1,570.42 N.D. 5,239.85 299.35 318.88 ND 562.27 340.87 12,253.69 73.80 115.01 N.D. N.D.. 94.55 – 87.79 9.78 25.30 – 22.83 115.46 437.80 10.44 4.16 – –. 6.02 – 1.68 3.27 7.94 – 4.06 33.87 3.57 14.14 3.62 – –. Source D. batatas Z. jujube G. uralensis P. ginseng G. uralensis P. grandiflorum P. grandiflorum P. ginseng G. uralensis Z. officinale A. macrocephala A. macrocephala A. macrocephala. a. N.D. means not detected.. results are summarized in Table 5. In conclusion, a rapid, precise, and reliable LC–MS/ MS method for the simultaneous determination of the thirteen marker constituents in the herbal prescription, SRBCS was developed and successfully applied to the quantitative analysis of SRBCS. These results could be helpful for the quality control of SRBCS.. Acknowledgments This research was supported by a grant (no. K15251) from the Korea Institute of Oriental Medicine.. References (1) Qiu, J. Nat. Rev. Drug Discov. 2007, 6, 506-507. (2) Wang, L.; Zhou, G. B.; Liu, P.; Song, J. H.; Liang, Y.; Yan, X. J.; Xu, F.; Wang, B. S.; Mao, J. H.; Shen, Z. X.; Chen, S. J.; Chen, Z. Proc. Natl. Acad. Sci. U. S. A. 2008, 105, 4826-4831. (3) Chen, H.; Wu, M.; Kubo, K. Y. J. Ethnopharmacol. 2012, 142, 8085. (4) Lee, S. R. Korean J. Orient. Physiol. Pathol. 2009, 23, 374-380. (5) Heo, J. Dongeuibogam; Namsandang: Seoul, 2004, p 440. (6) Yang, Q. H.; Xu, Y. J.; Liu, Y. Z.; Liang, Y. J.; Feng, G. F.; Zhang, Y. P.; Xing, H. J.; Yan, H. Z; Li, Y. Y. Evid. Based Complement. Alternat.. Med. 2014, 2014, 671013-671021. (7) Yang, Q. H.; Xu, Y. J.; Feng, G. F.; Hu, C. F.; Zhang, Y. P.; Cheng, S. B.; Wagn, Y. P.; Gong, X. W. Afr. J. Tradit. Complement. Altern. Med. 2013, 11, 213-221. (8) Liu, X.; Jia, Y.; Iiu, Q.; Wu, J. Lishizhen Med. Mater. Med. Res. 2011, 22, 2671-2673. (9) You, Y.; Liu, U.; Gao, S. Chinese J. Experiment. Trad. Med. Formulae 2012, 18, 136-140. (10) Turner, R.; Stamp, L. K.; Kettle, A. J. J. Chromatogr. B Analyt. Technol. Biomed. Life Sci. 2012, 891-892, 85-89. (11) Ren, Y.; Wang, P.; Wu, C.; Zhang, J.; Niu, C. Biomed. Chromatogr. 2013, 27, 17-26. (12) Wang, Y.; Yang, L.; He, Y. Q.; Wang, C. H.; Welbeck, E. W.; Bligh, S. W.; Wang, Z. T. Rapid Commun. Mass Spectrom. 2008, 22, 1767-1778. (13) Zhao, J.; Su, C.; Yang, C.; Liu, M.; Tang, L.; Su, W.; Liu, Z. J. Pharm. Biomed. Anal. 2012, 64-65, 94-97. (14) Tan, G.; Zhu, Z.; Jing, J.; Lv, L.; Lou, Z.; Zhang, G.; Chai, Y. Biomed. Chromatogr. 2011, 25, 913-924. (15) Na, Y. C.; Ha, Y. W.; Kim, Y. S.; Kim, K. J. J. Chromatogr. A 2008, 1189, 467-475. (16) Chen, L.; Qi, J.; Chang, Y. X.; Zhu, D.; Yu, B. J. Pharm. Biomed. Anal. 2009, 50, 127-137.. Received November 2, 2015 Revised November 26, 2015 Accepted December 2, 2015.
(10)
수치
+2
관련 문서
Abstract − The aim of this study was to quantitatively analyze for quality assessment of eighteen marker compounds, including homogentisic acid,
Determinations of Toltrazuril and Toltrazuril Sulfone Levels in Olive Flounder Paralichthys olivaceus Samples Using Liquid Chromatography- Electrospray Ionization
Determination of 8-iso-PGF 2α as Oxidative Stress Marker in Human Urine by High Performance Liquid Chromatography.. with Tandem
In this study, we evaluated the feasibility of ultra-performance liquid chromatography (UPLC)-tandem mass spectrometry (MS/MS) in a leukocyte ARSA assay using a natu- ral
Analytical Method Development of Cholic Acid in Human Plasma and Gall Bladder Bile by Ultra Performance Liquid..
A Rapid and Sensitive Quantification Method of Sphingosine and Sphingosine-1-phosphate in Human Serum by Ultra High-Performance Liquid Chromatography-Tandem
