Evaluation of the palatal soft tissue thickness by cone-beam computed tomography
Objective: The purposes of this study were to measure the palatal soft tissue
thickness at popular placement sites of temporary anchorage devices (TADs) by cone-beam computed tomography (CBCT) and evaluate the age, gender, and positional differences in this parameter.
Methods: The study sample consistedof 23 children (10 boys and 13 girls; mean age, 10.87 ± 1.24 years; range, 6.7 to 12.6 years) and 27 adults (14 men and 13 women; mean age, 21.35 ± 1.14 years;
range, 20.0 to 23.8 years). Nine mediolateral and nine anteroposterior intersecting reference lines were drawn on CBCT scans of the 50 subjects, and the resultant measurement areas were designated according to their mediolateral (i.e., lateral, medial, and sutural) and anteroposterior (i.e., anterior, middle, and posterior) positions. Repeated-measures analysis of variance was performed to analyze intragroup and intergroup differences. Results: No significant age and gender differences were found (p = 0.309 and 0.124, respectively). Further, no significant anteroposterior change was observed (p = 0.350). However, the lateral area presented the thickest soft tissue whereas the sutural area had the thinnest soft tissue (p < 0.001). Conclusions: Clinical selection of the placement sites of TADs should be guided by knowledge of the positional variations in the palatal soft tissue thickness in addition to other contributing factors of TAD stability.
[Korean J Orthod 2012;42(6):291-296]
Key words: Palatal soft tissue, TADs, CBCT Trang Vua
Mohamed Bayomea Yoon-Ah Kooka Seong Ho Hanb
aDepartment of Orthodontics, Seoul St. Mary’s Hospital, The Catholic University of Korea, Seoul, Korea
bDivision of Orthodontics, Department of Dentistry, St. Vincent’s Hospital, The Catholic University of Korea, Suwon, Korea
Received October 22, 2011; Revised September 10, 2012; Accepted September 10, 2012.
Corresponding author: Seong Ho Han.
Assistant Professor, Division of Orthodontics, Department of Dentistry, St. Vincent’s Hospital, The Catholic University of Korea, 93 Jungbu-daero, Paldal-gu, Suwon 442-723, Korea.
Tel +82-31-249-7114 e-mail [email protected]
©
2012 The Korean Association of Orthodontists.The authors report no commercial, proprietary, or financial interest in the products or companies described in this article.
This is an Open Access article distributed under the terms of the Creative Commons Attribution Non-Commercial License (http://creativecommons.org/licenses/by-nc/3.0) which permits unrestricted non-commercial use, distribution, and reproduction in any medium, provided the original work is properly cited.
pISSN 2234-7518 • eISSN 2005-372X
http://dx.doi.org/10.4041/kjod.2012.42.6.291
INTRODUCTION
In the last decade, temporary anchorage devices (TADs) have been merged into the mainstream of clinical ortho- dontic practice because of several advantages over the conventional anchorage approaches, including simple design of force delivery systems, reduced dependence on patient compliance, and expansion of the existing boundaries of tooth movements.
1,2Their success is affected by various patient factors such as age and the general healing capacity, inflammation status of the peri- implant sites, quantity and quality of the cortical bone, and thickness and mobility of the soft tissue in the target areas.
3-5In the oral cavity, the palate is a popular site for TAD placement because of the thick keratinized masticatory mucosa, high accessibility, and reduced risk of root damage.
6Recently, several investigators have examined the adjacent areas of the midpalatal suture for use in TAD-assisted distalization mechanics in adole scents and adults.
7,8At present, several methods are available for evaluating the soft tissue thickness of the palate. The use of needles and periodontal probes has been documented since the 1970s.
9,10To avoid the need for local anesthesia, non- invasive techniques involving ultrasonic devices and computed tomography (CT) have also been studied.
11-14However, these approaches have been criticized for either questionable reliability or additional radiation risk.
On the other hand, the accuracy of cone-beam computed tomography (CBCT) for both soft tissue and bone thickness measurements in the maxillary anterior region has recently been confirmed, and a simple technique is now available for assessing the thickness of the palatal masticatory mucosa by CBCT.
15-17However, previous investigations with CBCT were limited to the buccal gingiva or palatal slope area, excluding the paramedian regions of the palate.
16-18Further, the soft tissue thickness at TAD placement sites in the palate at different ages has not been well documented in the literature.
The purposes of this investigation were to measure the palatal soft tissue thickness at popular placement sites of TADs by CBCT and evaluate the age, gender, and positional differences in this parameter.
MATERIALS AND METHODS
Subjects
CBCT scans (i-CAT, Imaging Sciences International, LLC, Hatfield, PA, USA) of randomly selected children (n
= 23; 10 boys and 13 girls; mean age, 10.87 ± 1.24 years;
range, 6.7 to 12.6 years) and adults (n = 27; 14 men and 13 women; mean age, 21.35 ± 1.14 years; range, 20.0 to 23.8 years) who had visited the Dental Department of Seoul
St. Mary’s Hospital, The Catholic University of Korea, were collected. The exclusion crite ria were the presence of ectopically positioned teeth or pathologic lesions in the palate, previous use of any medi cation that could affect the oral gingival status such as a calcium channel blocker, and CBCT images with the patient’s tongue contacting the palatal soft tissue. The Institutional Review Board of The Catholic University of Korea reviewed and approved the study protocol.
Measurements
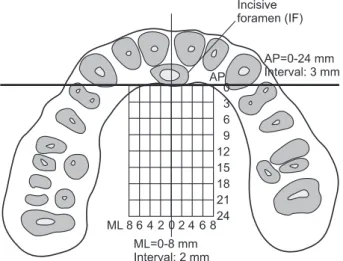
InVivoDental (Anatomage Inc., San Jose, CA, USA), a volumetric imaging software, was used for evaluating the palatal soft tissue thickness. Nine anteroposterior (AP) and nine mediolateral (ML) intersecting reference lines forming 81 intersection points were drawn on the CBCT scans. The ML reference lines were drawn at 0, 2, 4, 6, and 8 mm from the midpalatal suture along the coronal plane, and the AP reference lines were drawn at 3-mm intervals from the distal margin of the incisive foramen to 24 mm posteriorly along the sagittal plane (Figure 1).
19The palatal soft tissue thickness was then measured in the sutural (0 mm), medial (2 and 4 mm), and lateral (6 and 8 mm) areas and the anterior (0 - 6 mm), middle (9 - 15 mm), and posterior (18 - 24 mm) areas.
All measurements were performed by one investigator (TV). To test the intra-examiner reliability, 10 randomly selected scans were remeasured 2 weeks later by the same investigator.
Statistical analysis
SPSS ver. 16.0.2.1 (SPSS Inc., Chicago, IL, USA) was used to analyze the data. In addition to the intraclass correlation (ICC) test, the Bland-Altman method was
Figure 1. Anteroposterior (AP) and mediolateral (ML)
reference lines forming 81 intersection points for measuring the palatal soft tissue thickness.applied to evaluate the reliability of the assessments.
Because the paired t-test did not show a significant bilateral difference in the soft tissue thickness, only the right side was used for further analysis of the measure- ment areas. Repeated-measures analysis of variance (ANOVA) was applied to test the intergroup (children vs. adults and male vs. female subjects) and intragroup (ML and AP measurement areas) differences. Statistical significance was determined at p < 0.05.
RESULTS
The ICC coefficient of 0.976 and Bland-Altman plot revealed high intraexaminer assessment reliability (Figure 2). The gender-based comparison revealed no significant difference (p = 0.124), although the female subjects tended to have thicker palatal soft tissue. Similarly, no significant difference was noted in the age-based comparison (p = 0.309). Interestingly, a significant qualitative interaction between age and the ML position (p = 0.006) was ob- served, indicating that the children had thicker palatal
soft tissue laterally but thinner tissue medially than the adults (Table 1, Figure 3).
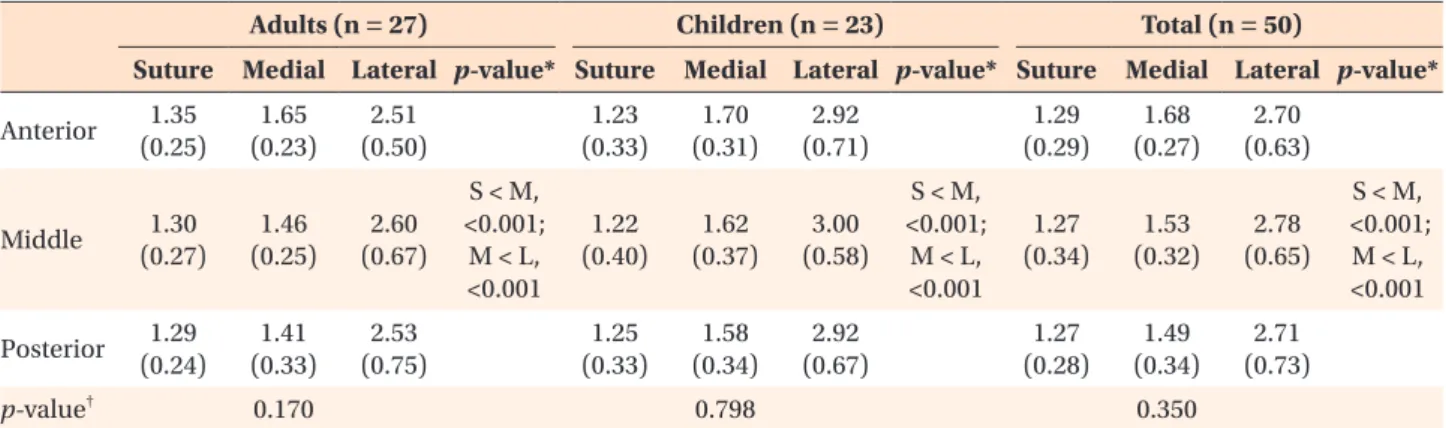
The analysis based on the measurement areas showed a significant effect of the ML position (p < 0.001) (Table 2, Figure 4): the lateral and sutural areas had the thickest and thinnest soft tissue, respectively. In contrast, no significant effect of the AP position was noted (p = 0.350) (Table 2). In addition, a significant interaction was observed between the ML and the AP positions (p = 0.011), as shown in Figure 4.
DISCUSSION
Various techniques are currently available to evaluate the palatal soft tissue thickness.
10-17For instance, Ueno et al.
14demonstrated a high correlation between spiral CT and physical measurements of the maxillary oral mucosa;
however, they also recommended that spiral CT should not be used to measure the mucosal thickness alone because of higher radiation exposure. On the other hand, CBCT, which is widely used in contemporary orthodontic practice, ensures a significantly reduced radiation dose
Figure 2. Bland-Altman plot of the intra-examiner assess-
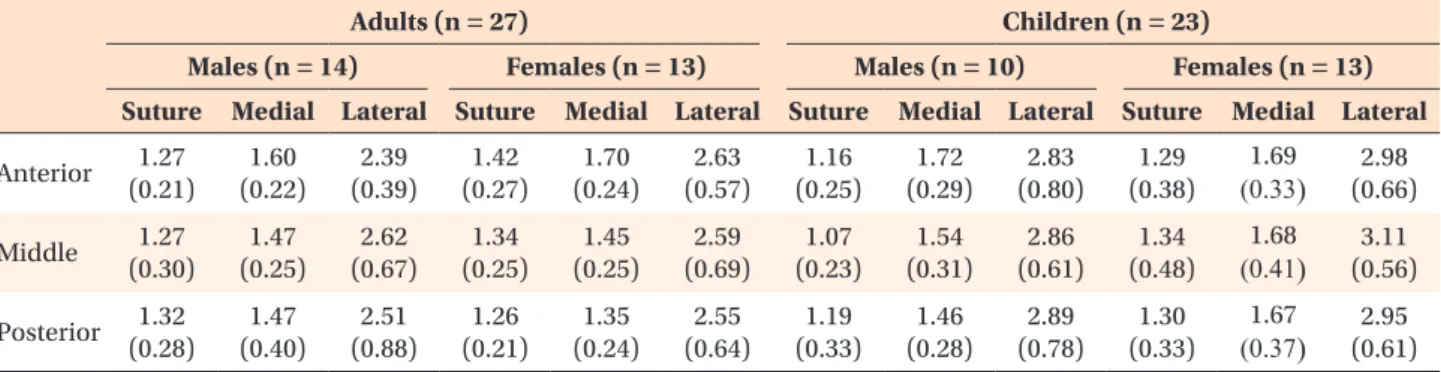
ment reliability (unit: mm).Table 1. Palatal soft tissue thickness (mm) at different measurement areas in adults and children of both genders
Adults (n = 27) Children (n = 23)
Males (n = 14) Females (n = 13) Males (n = 10) Females (n = 13) Suture Medial Lateral Suture Medial Lateral Suture Medial Lateral Suture Medial Lateral Anterior 1.27
(0.21)
1.60 (0.22)
2.39 (0.39)
1.42 (0.27)
1.70 (0.24)
2.63 (0.57)
1.16 (0.25)
1.72 (0.29)
2.83 (0.80)
1.29 (0.38)
1.69
(0.33
)
(0.66)2.98 Middle 1.27(0.30)
1.47 (0.25)
2.62 (0.67)
1.34 (0.25)
1.45 (0.25)
2.59 (0.69)
1.07 (0.23)
1.54 (0.31)
2.86 (0.61)
1.34 (0.48)
1.68
(0.41
)
(0.56) 3.11 Posterior 1.32(0.28)
1.47 (0.40)
2.51 (0.88)
1.26 (0.21)
1.35 (0.24)
2.55 (0.64)
1.19 (0.33)
1.46 (0.28)
2.89 (0.78)
1.30 (0.33)
1.67
(0.37
)
(0.61)2.95 Values are presented as mean (standard deviation).Figure 3. Changes in the palatal soft tissue thickness
according to the mediolateral positions.due to its lower output and shorter exposure time. Its potential drawbacks include higher image noise and lower contrast resolution from scattered radiation.
20CBCT has recently been applied for reliable measure- ment of the dentogingival soft tissue.
15-17Januário et al.
15and Barriviera et al.
16used plastic lip retractors and wooden spatulas to retract the soft tissue from the mu- cosal surface and obtain clear CBCT images. We took similar steps by excluding any scans in which the tongue contacted the roof of the mouth, so that no pressure was applied on the palatal surface and unambiguous measurements could be obtained.
According to our study, the soft tissue over the midpa- latal suture was the thinnest, ranging from 1.22 to 1.35 mm, whereas that in the lateral area was the thickest, ranging from 2.51 to 3.00 mm (p < 0.001) (Table 2).
Direct comparison with other investigations is somewhat difficult because of the difference in the reference struc- tures. For example, Barriviera et al.
16reported that the
mucosal thickness of the higher region of the palate, which may be physically related to the lateral area in our study, ranges from 3.13 to 4.51 mm. Although their slightly elevated data are still within the standard deviations determined in our study, differences in the measurement areas and ethnicity of the patients likely contribute to the discrepancy between the studies.
On the basis of CT images from 100 adult patients, Song et al.
13concluded that the soft tissue of the area over the palatal slope thickens posteriorly, and reported a range of 3.13 to 3.81 mm. However, we could not confirm this AP trend. The difference between their and our data may be explained by the fact that their measurement sites were located further away from the midpalatal suture, where even thicker tissue exists along the palatal slope, because their measurements were performed closer to their own reference structures such as the palatal gingival margins.
Kim et al.
18performed direct measurements of the soft tissue thickness in 23 adult cadavers and found that the thickness along the midpalatal suture stays relatively constant from 1.01 to 0.90 mm beginning 8 mm posterior to the incisive papilla. Consistent with their results, the soft tissue thickness over the suture was stable in our study, ranging from 1.22 to 1.35 mm (Table 2).
Considering age, Wara-aswapati et al.
10used a bone sounding method and discovered that older (mean, 38.7 ± 6.8 years) patients had thicker palatal masticatory mucosa than younger (mean, 16.8 ± 2.0 years) ones (p < 0.01).
This difference was not reciprocated in our investigation (p = 0.967). This inconsistency, however, is in agreement with the findings of Eger et al.,
11who also reported no difference among age groups. Possible explanations for these conflicting reports are the difference in the measurement areas and the increased palatal soft tissue thickness in the areas of interest with age. In fact, Song et al.
13reported that the palatal masticatory mucosa is Table 2. Palatal soft tissue thickness (mm) at different measurement areas in adults, children, and the total sample
Adults (n = 27) Children (n = 23) Total (n = 50)
Suture Medial Lateral p-value* Suture Medial Lateral p-value* Suture Medial Lateral p-value*
Anterior 1.35 (0.25)
1.65 (0.23)
2.51 (0.50)
1.23 (0.33)
1.70 (0.31)
2.92 (0.71)
1.29 (0.29)
1.68 (0.27)
2.70 (0.63)
Middle 1.30
(0.27)
1.46 (0.25)
2.60 (0.67)
S < M,
<0.001;
M < L,
<0.001 1.22 (0.40)
1.62 (0.37)
3.00 (0.58)
S < M,
<0.001;
M < L,
<0.001 1.27 (0.34)
1.53 (0.32)
2.78 (0.65)
S < M, <0.001;
M < L,
<0.001 Posterior 1.29
(0.24)
1.41 (0.33)
2.53 (0.75)
1.25 (0.33)
1.58 (0.34)
2.92 (0.67)
1.27 (0.28)
1.49 (0.34)
2.71 (0.73)
p-value† 0.170 0.798 0.350
Values are presented as mean (standard deviation). Repeated measure ANOVA followed by post hoc test was used.
S, Suture; M, medial; L, lateral.
*Independent comparison among mediolateral positions. †Independent comparison among anteroposterior positions.