Environmental Science
Vol. 34, No. 2, pp. 153-161, April, 2018 https://doi.org/10.7747/JFES.2018.34.2.153
The Analysis of Correlation between BVOCs and Ozone at Taehwa Research Forest
Dan-Bi Kim1, Sang-Deok Lee2,*, Seung-Ha Lee1, Rhok-Ho Kim1, Yeong-Jae Lee1 and Hee-Mun Chae2
1Department of Climate and Air Quality Research, National Institute of Environmental Research, Republic of Korea
2Division of Forest Science, Kangwon National University, Kangwondaehakgil, Chuncheon 24341, Republic of Korea
Abstract
Ozone absorbs ultraviolet light which is harmful to life. However, the recent increase of ambient ozone level due to climate change is becoming the cause of stimulating human eyes, affecting respiratory system, and damaging crops.
In this paper, a study was conducted at the Taehwa Research Forest (TRF) of Seoul National University with the purpose of analyzing the characteristics of forest air chemistry based on the measurement of BVOCs emitted from forests and investigating the correlation of BVOCs with ozone generation. The results showed that levels of isoprene and MVK (Methyl Vinyl Keton)+MACR (Methacrolein) were high in summer, but level of monoterpene was high in spring. Ozone level was high from the middle of May to the middle of June, which was before the rainy season.
Comparison of the correlation between ozone and isoprene during the measurement period at the TRF showing limited NOx showed that the R2 was correlated with a low value of about 0.4. However, when the isoprene was actively produced from 6:00 AM to 6:00 PM, correlation analysis showed that R2 was about 0.9, while monoterpene started to increase in the afternoon, and decreased level of ozone at night. Correlation analysis showed negative correlation.
Forests have two characteristics: not only the formation of ozone but also the decomposition of ozone.
Key Words: BVOCs, ozone, isoprene, monoterpene, photochemistry, MVK, MACR
Received: August 23, 2017. Revised: January 9, 2018. Accepted: February 20, 2018.
Corresponding author: Sang-Deok Lee
Division of Forest Science, Kangwon National University, Chuncheon 24341, Repulblic of Korea Tel: 82-33-250-8369, Fax: 82-33-259-5617, E-mail: [email protected]
Introduction
Recently, the increase in ozone concentrations caused by climate change affects people’s eyes or respiratory tract, and damages crops. Accordingly, studies on precursors con- tributing to ozone generation are increasing.
Volatile Organic Compounds (hereafter, VOCs) are widely known as precursors to photochemical smog such as ozone of atmosphere, etc. (Chameides et al. 1988), and stud- ies on their mechanism of formation, identification of pho- tochemical reactions, control of VOCs, etc. to minimize ozone generation are actively underway (Fehsenfeld et al. 1992).
The amount of VOCs (precursors of ozone generation in
the atmosphere) that are emitted by nature such as forests, etc. is more than 10 times of the amount of emissions pro- duced by anthropogenic emission sources (Benkovitz et al.
2004), and Photochemical Ozone Creation Potential (POCP) of VOCs is 5 or 6 times higher than that of anthropogenic pollutants. Also, the reactivity with oxides such as OH, O3
and NO3 in the trophosphere is higher than that of anthro- pogenic VOCs (Kim et al. 2013).
Although studies of ozone generation based on anthro- pogenic emission amount of VOCs are ongoing, there are not many studies on ozone generation of Biogenic Volatile Organic Compounds (BVOC) emitted by forests.
For countermeasures of reducing ozone, researches are
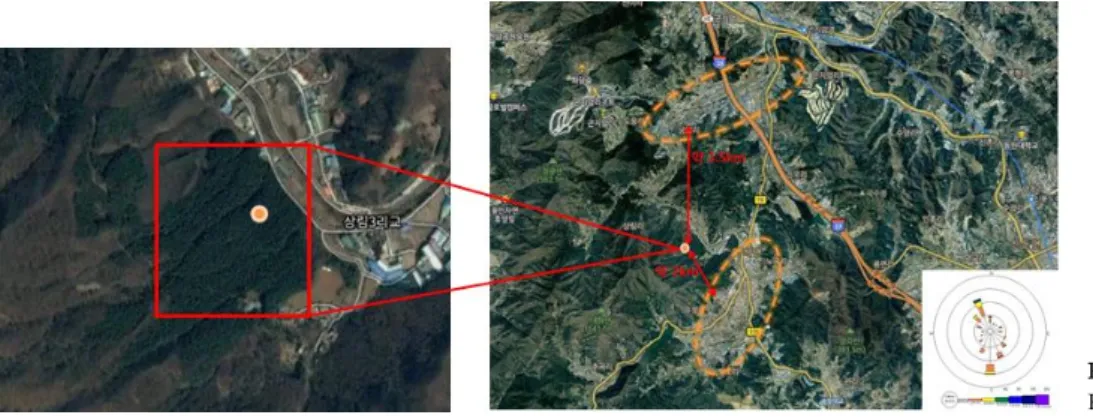
Fig. 1. The location of the Taehwa Research Forest (TRF).
Table 1. Distribution of species of trees in Taehwa Mountain
Species Area Rate
Quercus 468 ha 58.80%
Pinus Koraiensis 160 ha 20.10%
Larix leptolepis 123 ha 15.50%
Castanea crenata 8 ha 1.00%
Etc. 37 ha 4.60%
Sum 796 ha 100%
needed to investigate effects of natural ecosystem as well as countermeasures for anthropogenic emission sources.
In particular, Atlanta, an American metropolitan city sur- rounded by forests, had serious ozone problem. Researches on the emission and photochemistry mechanism of BVOCs have been actively conducted in the US, Europe, Japan, etc. since a study was published that understanding of pho- tochemical reaction in BVOCs was necessary in order to solve the problem (Chameide et al. 1988).
VOCs emitted by anthropogenic emission sources are about 142 TgC/year, and emission amount of natural emis- sion sources are 1150 TgC/year so that it is about 10 times (Fehsenfeld et al. 1992).
For a case of North America, the contribution of natural emission sources for ozone precursors is approximately 60% of VOCs and estimated to reach about two-thirds of the total size of the Earth. Thus, ozone in the air pollution research with extensive spatial coverage is further empha- sized by the effects of natural emission sources (Guenther et al. 1994).
Especially, as of 2015, the forest area of Korea was 6,318 kha, which was about 65% of the total area (KFS 2015), and major urban areas including Seoul are also surrounded by forests. However, according to the statistics of the National Air Pollutants Emission Service, the proportion of the emission amount of BVOCs out of the total emission amount of VOCs tends to be undervalued at 0.1% (NIER 2015).
Therefore, it is essential to understand the emission of BVOCs and mechanism of photochemical reaction as coun- termeasures to understand the photochemical pollution in the urban areas and minimize the generation of ozone. And not only the control of anthropogenic VOCs (AVOC), but
also biogenic VOCs emitted from nature, should be studied.
Materials and Methods
Study area
In order to analyze the relationship between the charac- teristics of forest air chemistry and ozone generation based on the measurement of BVOCs emitted from forests, a study was conducted at the Taehwa Research Forest (TRF) of Seoul University located in Sangnim-ri, Docheok-myeon, Gwangju-si, Gyeonggi-do, about 60 km northeast of Seoul.
The TRF is shown in Fig. 1.
Taehwa Mountain is located about 644 m above sea lev- el, and has about 500 ha of natural deciduous forest and about 300 ha of artificial forest. Among these forests, the natural deciduous forest is mostly composed of konara oak, oriental chestnut oak, fragrant styrax, etc., and the artificial forest where atmospheric observation tower is located mainly consists of pine trees.
Table 1 describes distribution of tree species in Taehwa Mountain. The average age of stand of Taehwa Mountain is about 50 years and the density of forest trees is 433 trees/ha.
Table 2. Seasonal variation of BVOCs concentration
Season Isoprene MVK+MACR Monoterpene
Average Std. Average Std. Average Std.
Spring 0.463 ±0.418 0.192 ±0.198 0.089 ±0.035
Summer 1.335 ±0.488 0.333 ±0.145 0.064 ±0.008
Fall 0.311 ±0.142 0.231 ±0.143 0.092 ±0.016
Winter 0.238 ±0.066 0.118 ±0.052 0.078 ±0.017
The measurement point is located at a relatively low height in Taehwa Mountain. In the vicinity, there are a number of Class 4 and 5 businesses within a radius of 4 km from the measurement point. Most common businesses are furniture manufacturing companies, or other metal or wood processing companies.
In addition, within a radius of 3 km from the measure- ment point, the Jungbu Expressway and local road that runs from Gonjiam to Yongin are located. Comparing these geographical conditions with the wind field, the wind direc- tion was distributed evenly around the measurement point, but the wind blowing from the northwest and south was the main wind. This indicates that the measurement point was under the influence of anthropogenic emission sources.
Measurement and analysis
In order to study the characteristics of BVOCs that show different effects for each season, we set up a monthly in- tensive measurement period, and secured as many quantita- tive data as possible to compare them.
General air pollutants have been operated from January to December except February and March. For BVOCs, there were the intensive measurement periods of at least 4 days per month from March to October except July and August in which a measurement was difficult due to the equipment characteristics when water content was high.
Ozone was measured using AQMS (Air Quality Mea- surement System, Thermo), and the device was periodically calibrated using dynamic gas calibrator and zero air supply.
High sensitivity PTR-MS systems (IONICON Analytik, Innsbruck Austria) were deployed during the measurement period. General information for the analytical technique can be found in Blake et al. (2009) and references therein.
Karl et al. (2005) and Kim et al. (2009) presented in- formation on the analytical characteristics and calibration
procedures for the specific instruments used in this study.
Since we explore a wide range of molecular masses (m/z=40+
to 210+), the mass discrimination of the system was care- fully characterized before and after measurement period with a certified standard gas (Matheson Tri Gas, USA) containing 14 aromatic compounds from benzene (MW 78) to trichlorobenzene (MW 180). The relative sensitivity over the mass range generally declines in an exponential function. In addition, we calibrated relative sensitivities at m/z205+, the molecular weight of the protonated sesqui- terpene (SQT) parent ion with a triisopropylbenzene stand- ard generated by a capillary diffusion system (CDS) located at the University of Colorado at Boulder (Helmig et al.
2004). The experiment demonstrated that the exponential fi tting line, based on the certified aromatic standards, pre- dicts the transmission efficiency reasonably well (Kim et al.
2009). The average deviation from the transmission curve is estimated to be ∼15%, an error very similar to the esti- mation of Taipale et al. (2008).
Results and Discussion
Seasonal variation characteristics of BVOCs
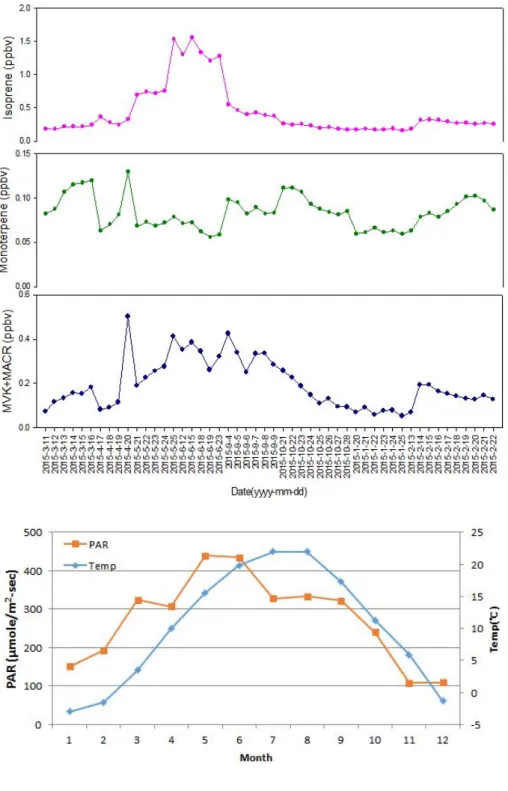
The concentration of BVOC species were summarized in Table 2, Fig. 2 shows the distribution characteristics of rep- resentative BVOCs such as isoprene and monoterpene, and MVK (methyl vinyl ketone)+MACR (methacrolein) pro- duced by oxidation of isoprene, OH, etc. in forests.
Levels of isoprene and MVK+MACR were high in summer, whereas level of monoterpene was high in spring.
Isoprene is closely related to the synthesis of substances gen- erated by photosynthesis in the leaves of plants and mostly sensitive to temperature and light because it is released di- rectly through chlorophyll rather than stored in the leaves of plants (Guenther et al. 1991; Guenther et al. 1993).
Fig. 2. The variation of BVOCs concentration.
Fig. 3. Variation of PAR and Temp.
Even in the graph of PAR (Photosynthetically Active Radiation) and temperature as shown in Fig. 3, level of iso- prene was the highest in May and June, and in June, level of isoprene was high because of overlapping of these two characteristics. At that moment, levels of isoprene and MVK+MACR were high.
On the other hand, unlike isoprene, monoterpene is formed in the pores of the leaf surface, and stored in the leaves and stem reservoir before being emitted (Lerdau and Keller 1997). The emission speed of monoterpene for each season has the highest value in spring because the growth rate of conifers is higher compared with other seasons so
Fig. 5. Concentration of ozone at TRF.
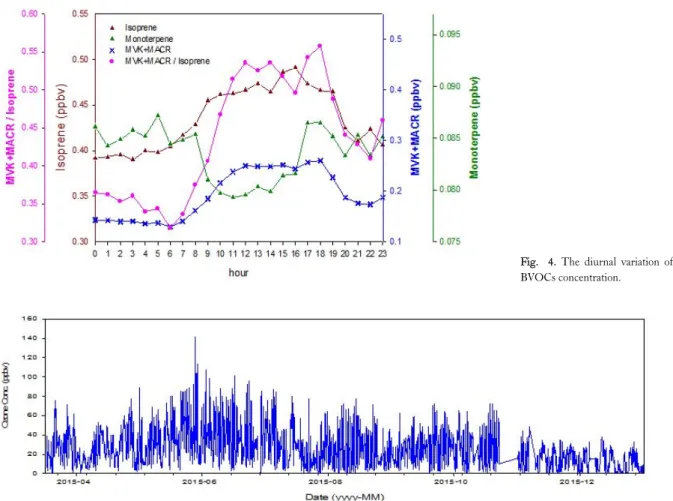
Fig. 4. The diurnal variation of BVOCs concentration.
that level of monoterpene is high in spring (Kim and Lee 2010).
BVOCs are emitted due to the increase of plant body temperature caused by temperature, PAR, etc. which are atmospheric meteorological elements. Physiochemically, they are emitted due to the leaf structure and the assim- ilation of the plant itself by opening and closing of pores, and it was shown that the concentration of BVOCs was high in spring and summer when these were most active.
Daily change characteristics of BVOCs
Fig. 4 shows the diurnal variation of BVOCs, and the hourly distribution of isoprene and monoterpene over the entire period showed the highest isoprene concentration in the late afternoon, and the monoterpene concentration be- gan to increase in the evening and peaked at late night.
In general, isoprene starts to increase instantly when the
sun rises and reaches its maximum value in the afternoon depending on transpiration of plants related temperature and light (Lee and Wang 2006; Baier et al. 2015). MVK and MACR are produced by the oxidation of isoprene with ozone and OH. Because the loss rate of isoprene was sim- ilar to the rate of emission, a similar concentration was maintained from 9 to 14 o’clock, and one of the evidences for loss of isoprene was the increase of MVK+MACR.
The concentration increase rate of MVK+MACR was similar to that of isoprene because it reacts with OH sepa- rated from HONO in the early morning. After the sunrise, more OH radicals were generated by photochemical re- action so that isoprene was rapidly oxidized to MVK+
MACR, and the peak ratio of isoprene and MVK+
MACR indicated that oxidation of isoprene was the max- imum at 12 o’clock. Since OH radicals are predominantly generated by photochemical reactions, the highest concen-
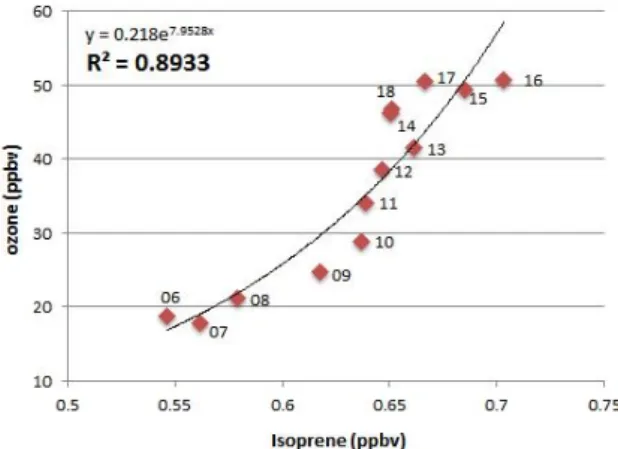
Fig. 6. The correlation between BVOCs and ozone. Fig. 7. The correlation between isoprene and ozone from 6 to 18 o’clock.
tration is usually observed at noon. These sufficient OH radicals react with not only isoprene but also MVK+
MACR to produce HO2 and RO2 radicals. The decrease in the ratio of isoprene and MVK+MACR indicates that photochemical reactions and radical chemistry are more active. This means that BVOCs induce a process more rap- idly that the RO2 and HO2 radicals contribute to the con- version of NO to NO2 and the NOx cycle process, and en- hancing of ozone generation in afternoon. Unlike isoprene, which increases with sunrise and declines from late after- noon, monoterpene begins to increase in the late afternoon, appears high in late evening, and decreases in the day time.
This is due to the characteristics conifers that store mono- terpene in the stem and leaves after production, and mostly emit it in late afternoon and at night. Also, it is because of disappearing by making a secondary oxide through rapid photochemical reaction with OH radical, etc. due to the strong reactivity (Laffineur et al. 2011). Also, at night, light dependence is low, boundary layer height is low, and the amount of compounds is small so that the concentration of monoterpene observed in the nighttime is high. This ob- servation has been commonly reported by previous studies in other forest environment researches (Kim et al. 2010).
Seasonal variation characteristics of ozone
To observe change characteristics of atmosphere envi- ronmental standard substances, etc. in the measurement point, regular measurements were made throughout the year from March 2015. Based on this, seasonal changes were analyzed.
Fig. 5 is a time series distribution of ozone. Concentra- tion of ozone was high from mid-May to mid-June, which was before the rainy season. The average concentration during this period was greater than 80 ppb, and the max- imum concentration was 140 ppb. Highly concentrated ozone is produced by high temperature, high solar radiation and relatively low humidity. In the rainy season, ozone con- centration is lowered because the relative humidity is high and the solar radiation is lowered (Park et al. 2005). Also, in spring, the concentration of precursors in Korea is high, and photochemical activity is lower than summer because of the effect of air moving from the mainland of China with the effect of northwest wind. On the other hand, in late summer, the concentration of precursors is lowest in the year due to heavy rain and the air coming from the Pacific Ocean, but the photochemical activity is high (An et al. 2015).
Correlation between BVOCs and ozone
Seasonal and diurnal changes of BVOCs were found to affect ozone photochemical reaction. Ozone in the tropo- spheric is produced through complicated reactions involving precursors including NOx and VOCs, and the relationships between ozone and isoprene, and between ozone and mono- terpene were studied in more detail. Isoprene contributes significantly to ozone formation in the tropospheric atmos- phere (Tilton 1989), and produces ozone through an oxida- tion process. Isoprene reacts with OH to produce hy- droxy-peroxy radicals which are converted from NO to NO2
to produce MVK+MACR and formaldehyde (HCHO).
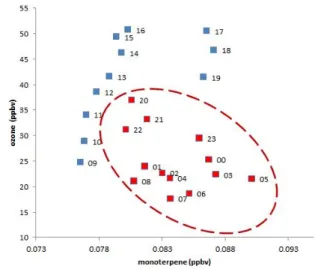
Fig. 6 shows the correlation between BVOCs and ozone
Fig. 8. The duration of monoterpene and ozone. Fig. 9. The correlation between monoterpene and ozone.
observed at the TRF, and R2 was about 0.4, showing a rela- tively low correlation. To analyze the correlation between BVOCs and ozone generation through photochemical re- actions, and the correlation between level of isoprene and ozone between 6 AM, when the increase of BVOCs by transpiration of plants and photochemical reactions began to be active after sunrise, and 18 o’clock, when ozone began to decrease with sunset, was analyzed in Fig. 7. In the corre- lation analysis of diurnal changes of isoprene and ozone, R2 was about 0.9 so that the correlation was distinct.
BVOCs by plants affect not only ozone formation but al- so ozone deposition. Unlike isoprene, monoterpene starts to decrease in the morning, and increase from the afternoon and appears high at late night. In Fig. 8, ozone was com- pared with monoterpene. At 16 o’clock, the level of mono- terpene increased rapidly, and then ozone started to de- crease, and the change of monoterpene was opposite to that of ozone.
For more details, Fig. 9 shows the correlation between monoterpene and ozone. In the evening, a negative correla- tion was observed between monoterpene and ozone.
Monoterpene produced ozone by reacting with OH in the day, but removed ozone by reacting with NO2 or showed tendency of removing ozone by reacting with it directly.
Conclusions
As the ozone concentration increases due to climate change, the rate of achieving the atmospheric environment standard of ozone is decreasing year by year. As a result, in-
terest in ozone is increasing. In order to analyze the causes of the increase of ozone concentration, the emission charac- teristics of biogenic volatile organic compounds (BVOCs), which account for 90% of the total amount of VOCs that are precursors of ozone production, were analyzed at the Taehwa Research Forest (TRF). Ozone and other gaseous materials in forests were measured and compared to inves- tigate seasonal and diurnal variation of the substances in- volved in the photochemical generation of BVOCs, and the relationship with the substances that affect ozone gen- eration at the Taehwa Research Forest. After that, the corre- lation between BVOCs and ozone was analyzed.
Isoprene and MVK+MACR among BVOCs that are emitted in forests are the temperature and light sensitive substances, and their levels were high in June when the two characteristics of PAR and temperature were overlapped.
However, level of monoterpene was high in spring because, as a presumption, the growth rate of conifers which mainly emit monoterpene was high in spring. As a result of the di- urnal change analysis of BVOCs, the concentration of iso- prene began to increase after the increase of the transpira- tion and stomatal conductance in the leaves of plants after sunrise, and reached the highest value at 17:00 in the late afternoon. On the other hand, the concentration of mono- terpene began to increase from late afternoon and reached its maximum concentration at night because monoterpene is stored in stem and leaves after being produced, begins to be emitted in late afternoon, and disappears by going
through rapid photochemical reaction with OH radical, etc. due to the strong reactivity.
The ozone concentration was higher in June than in July and August even though the temperature in July and August was higher than in June. This was because of the high activity of plants in June due to the effect of summer monsoon. Levels of carbon monoxide, sulfur dioxide and nitrogen oxides mainly caused by anthropogenic pollutants are high in the winter when the consumption of heating fuel is high, and low in the summer when there is a low mixing depth and a low convection current in the atmosphere. This is similar to the distribution of urban areas.
As a result of analyzing the ozone production in the for- est, the O3 concentration in the afternoon reflects various mechanisms of chemical precursors such as NOx and BVOCs, and analysis of the correlation between ozone and BVOCs at the TRF showed that R2 was about 0.4, showing a low correlation. The correlation of active isoprene pro- duction from 6:00 to 18:00 was 0.9, showing a distinct cor- relation, and it shows that the photochemical reaction of iso- prene had a great influence on the formation of ozone.
Monoterpene increased in the late evening, but on the other hand, ozone showed the decreasing pattern of diurnal change. The correlation between monoterpene and ozone in the evening showed a significant negative correlation.
Therefore, forests have two characteristics: ozone adsorp- tion as well as ozone formation. However, an additional re- search is needed to produce statistical data on how much ozone is generated and absorbed, and study ozone in- ventory production related to BVOCs activities.
References
An H, Han J, Lee M, Kang E. 2015. The long-term variations of ozone and nitrogen oxides in Suwon city during 1991-2012. J Korean Soc Atmos Environ 31: 378-384.
Baier BC, Brune WH, Lefer BL, Miller DO, Martins DK. 2015.
Direct ozone production rate measurements and their use in as- sessing ozone source and receptor regions for Houston in 2013.
Atmos Environ 114: 83-91.
Benkovitz CM, Schwartz SE, Jensen MP, Miller MA, Easter RC, Bates TS. 2004. Modeling atmospheric sulfur over the northern hemisphere during the Aerosol Characterization Experiment 2 experimental period. J Geophys Res 109: D22207.
Black RS, Monks PS, Ellis AM. 2009. Proton-transfer reaction mass spectrometry. Chem Rev 109: 861-896.
Chameides WL, Lindsay RW, Richardson J, Kiang CS. 1988. The role of biogenic hydrocarbons in urban photochemical smog:
Atlanta as a case study. Science. 241: 1473-1475.
Fehsenfeld F, Calvert J, Fall R, Golden P, Guenther AB, Hewitt CN, Lamb B, Liu S, Trainer M, Westberg H, Zimmerman P.
1992. Emissions of volatile organic compounds from vegetation and the implications for atmospheric chemistry. Global Biochemical Cycles 6: 389-430.
Guenther A, Zimmerman P, Wildermuth M. 1994. Natural vola- tile organic compound emission rate estimates for U.S. wood- land landscapes. Atmos Environ 28: 1197-1210.
Guenther AB, Monson RK, Fall R. 1991. Isoprene and mono- terpene emission rate variability: Observations with eucalyptus and emission rate algorithm development. J Geophys Res 96:
10799-10808.
Guenther AB, Zimmerman PR, Harley PC, Monson RK, Fall R.
1993. Isoprene and monoterpene emission rate variability:
Model evaluations and sensitivity analyses. J Geophys Res 98:
12609-12617.
Helmig D, Bocquet F, Pollmann J, Revermann T. 2004. Analytical techniques for sesquiterpene emission rate studies in vegetation enclosure experiments. Atmos Environ 38: 557-572.
Karl T, Harley P, Guenther A, Rasmussen R, Baker B, Jardine K, Nemitz E. 2005. The bi-directional exchange of oxygenated VOCs between a loblolly pine (Pinus taeda) plantation and the atmosphere. Atmosc Chem Phys 5: 3015-3031.
Kim HC, Lee KH. 2010. A study on emission rates of VOCs from conifers at Jeju island. J Environ Sci 19: 627-637.
Kim S, Karl T, Guenther A, Tyndall G, Orlando J, Harley P, Rasmussen R, Apel E. 2010. Emissions and ambient dis- tributions of Biogenic Volatile organic compounds in a ponder- osa pine ecosystem: interpretation of PTR-MS mass spectra.
Atmos Chem Phys 10: 1759-1771.
Kim S, Karl T, Helmig D, Daly R, Rasmussen R, Guenther A.
2009. Measurement of atmospheric sesquiterpenes by proton transfer reaction-mass spectrometry (PTR-MS). Atmos Meas Tech 2: 99-122.
Kim SY, Jiang X, Lee M, Turnipseed A, Guenther A, Kim JC, Lee SJ, Kim S. 2013. Impact of biogenic volatile organic compounds on ozone production at the Taehwa Research Forest near Seoul, South Korea. Atmos Environ 70: 447-453.
Korea Forest Service (KFS). 2015. Forest Basic Statistics by Region. Korea Forest Service, Daejeon.
Laffineur Q, Aubinet M, Schoon N, Amelynck C, Müller JF, Dewulf J, Van Langenhove H, Steppe K, Šimpraga M, Heinesch B. 2011. Isoprene and monoterpene emissions from mixed temperate forest. Atmosc Environ 45: 3157-3168.
Lee BS, Wang JL. 2006. Concentration variation of isoprene its implications for peak ozone concentration. Atmos Environ 40:
5486-5495.
Lerdau M, Keller M. 1997. Controls on isoprene emission from trees in a subtropical dry forest. Plant Cell Environ 20: 569-578.
National Institute of Environmental Research (NIER). 2015. The study on the emission and deposition of BVOCs using Eddy Covariance in the trees (II). National Institute of Environmental Research, Incheon, 44 pp.
Park SJ, Song YJ, Kim SD, Lee JY. 2005. A study on the variations of maximum ozone concentrations with the meteorological char- acteristics in Seoul. Korean Society of Environmental Engineers 12: 700-707.
Taipale R, Ruuskanen TM, Rinne J, Kajos MK, Hakola H, Pohja T, Kulmala M. 2008. Technical Note: Quantitative long-term measurements of VOC concentrations by PTR-MS measure- ment, calibration, and volume mixing ratio calculation methods.
Atmos Chem Phys 8: 6681-6698.
Tilton BE. 1989. Health effects of tropospheric ozone. Environ Sci Technol 23: 257-263.