Vol. 28, No. 2, pp. 68-74, May, 2012
Study on Aboveground Biomass of Pinus sylvesris var. mongolica Plantation Forest in Northeast China Based on Prediction Equations
Weiwei Jia*, Lu Li and Fengri Li
Forestry School, Northeast Forestry University, Harbin 150040, China
Abstract
A total of 45 Pinus sylvestnis var. mongolica trees from 9 plots in northeast China were destructively sampled to develop aboveground prediction equations for inventory application. Sampling plots covered a range of stand ages (12-47-years-old) and densities (450-3,840/ha). The distribution of aboveground biomass of whole-trees and tree component (stems, branches and leaves) of individual trees were studied and 4 equations were developed as functions of diameter at breast height (DBH), total height (HT). All the equations have good estimation effect with high prediction precision over 90%. Forest biomass was estimated based on the individual biomass prediction equations. It was found forest biomass of all organs increased with the increasing of stand age and density. And the period of 45-50 years was the suitable harvest time for Pinus sylvesris plantation.
Key Words: pinus sylvestnis var. mongolica, biomass, equations
Received: February 8, 2012. Revised: April 3, 2012. Accepted: April 4, 2012.
Corresponding author: Weiwei Jia
Forestry School, Northeast Forestry University, Harbin 150040, China Tel: 86-451-82191215, Fax: 86-451-82191215, E-mail: [email protected]
Introduction
Great attention has been paid to forest biomass in recent years because biomass is essential for carbon accounting, bio-energy feasibility studies, and other analyses. Accurate estimation of forest biomass is required for greenhouse gas inventories and terrestrial carbon cycle.
The earliest study of biomass was in Germany in 1876 by Ebermeyr, biomass of branches and leaves of several tree species and stem weight were measured (Ebermeyr 1876).
During the first half of the 20th century, thorough inves- tigations of the various organs of forest biomass were start- ed in some countries. As an essential tool for forest biomass estimation, biomass equations for individual trees have been produced in studies of forest production and its corre-
lation with stand attributes. It used the tree variables that were easily measured to predict forest biomass. Once the models or equations were established, it can be used to esti- mate the biomass in similar stands based on forest resources inventory data. Especially in the large-scale survey of forest biomass, it can greatly reduce the field workload. Kittredge (1944) successfully predicted the leaf biomass of white pine (Pinus strobus Linn.) using a logarithmic regression equa- tion. In the 1960s, with the implementation of International Biological Program (IBP), forest biomass and net primary productivity (NPP) were, for the first time, systematically studied worldwide, resulting in accumulation of biomass data and the development of new methods to estimate bio- mass (Cannell 1982; Satoo and Madgwick 1982).
The biomass research in China began in the late 1970s.
Table 1. Attributes of Pinus sylvestnis var. mongolica plantation plots
Plot no. Age (a) Average DBH (cm) Average height (m) Dominant height (m) Density (N/ha) Canopy density Z01
Z02 Z03 Z04 Z05 Z06 Z07 Z08 Z09
44 33 43 31 47 38 45 20 12
19.3 11.0 20.3 13.8 30.2 19.6 21.5 10.0 7.2
21.35 10.13 16.67 11.97 20.85 16.31 19.40 7.70 4.30
23.6 12.2 18.9 14.2 22.0 17.5 22.1 9.1 5.1
1,640 3,840 1,100 2,025 450 1,220 1,267 3,260 1,567
0.78 0.80 0.70 0.80 0.60 0.70 0.60 0.70 0.60
In the early 1980s, Chinese forestry researchers started a nationwide investigation on forest biomass and productivity in China, and large quantities of forest biomass data have been published in the past several decades (Fang et al.
1998; Feng et al. 1999; Fang and Wang 2001; Wang et al.
2001). Currently, the biomass of hundreds of tree species all over the country were studied, which were focus on the China fir (Cunninghamia lanceolata (Lamb.) Hook.), bam- boo species and Eucalyptus in the south (Wang 1996; Xiao et al. 1999; Chen et al. 2002; Dong et al. 2002) and many conifer and broad-leaved species all over the country (Liao 1996; Yi et al. 2000; Wang et al. 2001; Ding 2003).
The study was performed in Pinus sylvesris plantation plots with different age, density and site conditions estab- lished in Northeast China. This paper describes studies to develop aboveground biomass prediction equations for dif- ferent component of individual Pinus sylvesris trees in dif- ferent plots. The total forest biomass of each plot was esti- mated used the prediction equations based on the inventory data. The relationships between total forest biomass and stand age, density were analyzed to provide basic infor- mation the reasonable management of Pinus sylvesris plantation.
Materials and Methods
Data collection
Sample trees were collected in 9 Pinus sylvesris planta- tions of different age and density from Mengjiagang forest center, which is located in the northeast of China, ranging across 130o33′-130o53′E and 46o20′-46o31′N. One plot was chosen in each plantation with areas of 0.06 ha. Stem
diameter at breast height (DBH), total height (HT), height to crown base (HCB), crown width (CW), crown ratio (CR) were recorded or calculated for each tree in the plots. The crown base was defined to be the location where the lowest living branch is. The stand attributes were sum- marized in Table 1.
The trees in each plot were divided into five grades ac- cording to their sizes. In each grade, one sample tree was chosen randomly according to DBH and HT outside the plot in the stand, 45 different sizes of trees were selected as sample trees and the biomass of different organs of each sample trees were collected by stem and branch analysis.
8 sample trees were random selected as an independent validation data set, and the data of remaining 36 trees were used for equation fitting. The attributes of sample trees were summarized in Table 2.
The sample trees were felled and the trunk was cut with 1 m interval. The weights of each 1-m sections were meas- ured and the total amount was taking as the fresh weight of trunk. The discs were taken from the stem at height of 1.3 m, stump, and then at 1 m interval above stump following Smalian’s method of stem analysis. The discs were taken back as the sample of trunk. The fresh weight of very branch with leaves within each whorls of sample tree was weighed. A sample branch was selected in each whorl.
Then the leaf and branch of the sample branches were sepa- rated and the fresh weight of branch (without leaf) and leaf were weighted respectively. Then the fresh weight of branch (without leaf) and leaf of other branches in the same whorl were calculated according to the ratio of branch and leaf. About 100 g leaves and 200 g branches were selected in each whorl as the sample. The sample of trunk, branch
Table 2. Variables of sample trees of Pinus sylvestnis var. mongolica plantation
Variables
Fitting data Validation data
Mean Minimum Maximum Standard
deviation Mean Minimum Maximum Standard
deviation n=45
DBH (cm) HT (m) HCB (m) CL (m) CR (%) CW (m)
n=37 n=8
17.21 14.45 8.38 6.32 0.49 1.93
6.0 3.45 0.16 2.85 0.24 0.35
34.5 22.45 15.00 16.45 0.97 4.90
1.22 0.99 0.79 0.40 0.03 0.16
18.43 15.22 8.80 6.42 0.66 1.80
7.8 5.03 0.69 4.34 0.28 0.68
30.50 21.80 14.05 9.73 0.86 3.20
2.44 1.95 1.52 0.61 0.06 0.34
and leaf were taken back to be dried in direr under the tem- perature of 80oC. Then the water content and dry biomass data of the organs of the sample tree can be obtained.
Establishment of biomass equations
The efficient tree variables were select to estimate bio- mass of different organs (trunk, branch, leaf and the whole tree) according to the simple correlation analysis between the biomass of different component and tree variables, such as DBH, HT, HCB, CW, CR. It was found that DBH and HT are better determination variables of biomass factor.
The traditional tree biomass equations were fitted sepa- rately for each component and whole-tree biomass by using equation: and , Where for bio- mass, D and H for DBH and tree height, a and b are corre- sponding parameters.
For traditional biomass models, Equation (1) and Equation (2) was transformed respectively into following form in order to eliminate heteroscedasticity.
D b a
w log
log = + (Equation 1)
) log(
logw=a+b D2H (Equation 2)
The best equations for predicting biomass of different component were selected according to the statistical meas- ures of coefficient of determination (R2) and sum square of error (SSE).
R2=1−
∑
(yi−yˆi)2/∑
(yi−y)2;SSE=
∑
(yi−yˆi)2Using independent data, the validation procedures were performed using the following statistical measures:
1) Mean Error (ME): ∑
=
⎟⎠
⎜ ⎞
⎝
⎛ −
= n
i i i
n y ME y
1
ˆ
2) Absolute Mean Error (MAE): ∑
=
= n −
i i i
n y MAE y
1
ˆ
3) Relative Mean Error (M%E): % 1 ˆ 100%
1
⎟⎟×
⎠
⎜⎜ ⎞
⎝
⎛ −
= ∑
= n
i i
i i
y y y E n M
4) Absolute Relative Mean Error (MA%E):
% ˆ 100
% 1
1
− ×
= ∑
= i
i n i
i y
y y E n MA
5) Precision Estimation (P%): =(1− 0.05ˆ )×100%
y S
P t y ;
where Sy n((yni−pyˆ)i)2
= ∑ −
Where: yi is observed value, yˆi is predicted value, and p is number of parameters.
Results and Discussion
Characteristic of individual tree biomass in Pinus sylvestnis var. mongolica plantation of different ages
The plantation biomass is influenced by factors of cli- mate, soil and various human disturbances, which leading to great variation of individual tree biomass with sage same stand age.
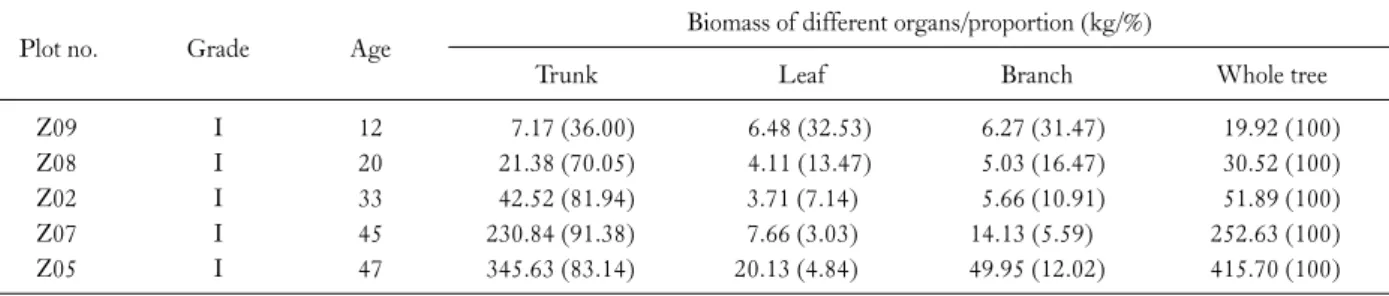
Table 3. Biomass and proportion of different organs for individual tree with different ages
Plot no. Grade Age Biomass of different organs/proportion (kg/%)
Trunk Leaf Branch Whole tree
Z09 Z08 Z02 Z07 Z05
I I I I I
12 20 33 45 47
7.17 (36.00) 21.38 (70.05) 42.52 (81.94) 230.84 (91.38) 345.63 (83.14)
6.48 (32.53) 4.11 (13.47) 3.71 (7.14) 7.66 (3.03) 20.13 (4.84)
6.27 (31.47) 5.03 (16.47) 5.66 (10.91) 14.13 (5.59) 49.95 (12.02)
19.92 (100) 30.52 (100) 51.89 (100) 252.63 (100) 415.70 (100)
Usually, the biomass accumulation of individual tree in- creases with the tree age. But there are significant differ- ences for the proportion of various organs biomass at differ- ent growth periods of forest.
This paper selected the biggest sample tree (grade I) of 5 plots with large age difference. The biomass of different or- gans and whole tree of individual tree, and respective pro- portion, were listed in the Table 3.
Tree biomass is the result of organic photosynthesis mat- ter accumulation and it changes with stand age and conditions. The statistical results in Table 3 shows that branch, trunk and whole tree biomass increases sig- nificantly with stand age, while leaf biomass has a peak at the initial period, then has little change in the forest growth process. Biomass of tree trunks and branches gradually in- creases with age,it is the result of photosynthesis function.
At the beginning of forest growth (12-years), there are lots of leaves to performing photosynthesis for the growth of the whole tree. Then it will remain a stable level with the com- bination function of tree growth and forest "self-thinning"
at medium and mature forest (30-40 years). This is also the explanation of tree growth has a characteristics of "S" shap- ed curve: a account of leaves was needed when the tree is young and more produced dry matter was distributed to the roots, branches and the self-need of leaf, so the overall growth is slow; middle-aged stage has a rapid growth as lush foliage; when reached a mature stage, the amount of leaf canopy to maintain a steady state, the biomass fixed by the trees through photosynthesis remains a stable level, so the amount of dry matter growth will be lower than a mid- dle-aged stage.
In the Pinus sylvestnis var. mongolica plantation forests of different ages, the biomass proportion of different organs is different. It is mainly due to the allometric growth of in-
dividual tree. It can be found in Table 3, the trunk biomass occupies dominant position of aboveground biomass of all the trees. Normally the allocation pattern in various organs of the biomass as: trunk>branches>leaves. The pro- portion of trunk biomass increases with tree age, which from 36% in 12-years plantation to 91.38% in 45-years forest. In the medium and mature forest, it remains at 80-90%. The proportion of branch and leaf has an inverse tendency versus trunk biomass, which was about 30% in the young forest and 5-10% in the growth forest.
Biomass prediction equations
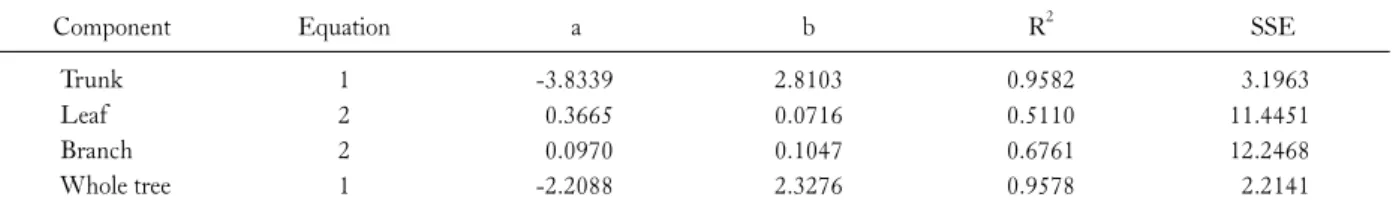
Equation (1) and (2) for the biomass of different organs and whole-tree were tested and fitted using the biomass fit- ting data. The fitting results were compared according to statistical measures of coefficient of determination (R2) and sum square of error (SSE). The best equation was found for estimating the biomass of different organs and whole- tree in Pinus sylvesris plantation. All the equation develop- ing procedures were performed using STATISTICA 6.0 software.
For developing prediction equations the equation (1) was best to estimate trunk and whole-tree biomass. Equation (2) was best for predicting leaf and branch biomass as a function of D2H.
Parameter estimates and fit statistics for best biomass equations for different organs and whole-tree were obtained using nonlinear regression (Table 4). The residuals were plotted against the predicted biomass (Fig. 1). The residual plot shows no trends with respect to DBH and HT.
Parameter estimates, fit statistics and residuals all suggested biologically reasonable behavior and an adequate fit to the data.
The results of equation’s parameter estimation show that
Table 4. Parameter estimates and fit statistics of biomass prediction equation (1) and (2)
Component Equation a b R2 SSE
Trunk Leaf Branch Whole tree
1 2 2 1
-3.8339 0.3665 0.0970 -2.2088
2.8103 0.0716 0.1047 2.3276
0.9582 0.5110 0.6761 0.9578
3.1963 11.4451 12.2468 2.2141
Fig. 1. Residuals for biomass equation of different organs. (a) Trunk, (b) leaf, (c) branch (d) whole tree.
the biomass of different organs and DBH has a significant proportion relationship. The larger trees with bigger DBH often have higher HT, and they have bigger biomass of dif- ferent organs, including the trunk, leaves and branches.
Equation validation
For the validation procedure, the performance evaluation criteria were computed with the equations of biomass devel- oped above for the independent validation data set. The val- idation date set includes biomass data of 18 sample trees (2 sample trees were selected in 1 plots). The result of stat-
istical validation test was summarized in Table 5.
The results indicated that deviance measures were all fairly low. The average relative error (M%E) of four equa- tions were all less than 10%, the biomass prediction equa- tions of trunk, branch and whole-tree were less than 6%. It shows that the established equations of various organs have no systematic bias. The estimated precisions of all equations for the validation data sets were greater than 90%.
The average absolute relative error (MA%E) of whole-tree, trunk, branches and leaves ranges from 11.33%
to 24.87%. That the estimation results of the trunk and
Table 5. Validation results of prediction equation for independent data set (n=18)
Equation ME MAE M%E (%) MA%E (%) p (%)
Whole-tree Trunk Branch Leaf
1.10 3.36 -0.56 -0.36
6.11 6.25 1.49 0.89
-3.55 5.64 -5.19 -9.22
10.33 10.84 14.24 24.87
94.57 93.62 90.46 90.39
Table 6. Forest biomass of 9 Pinus sylvestnis var. mongolica plantation plot
Plot no. Age (a) Density (N/ha) Forest biomass of different organs/proportion (kg/%)
Trunk (kg) Branch (kg) Leaf (kg) Whole-tree (kg)
Z01 Z02 Z03 Z04 Z05 Z06 Z07 Z08 Z09
45 33 43 31 47 38 45 20 12
1,640 3,840 1,100 2,025 450 1,220 1,267 3,260 1,567
7,516.86 (84.00) 3,687.35 (64.99) 5,812.09 (85.89) 2,982.15 (72.83) 6,578.24 (79.24) 5,841.77 (84.92) 9,121.86 (88.61) 833.44 (61.80) 538.29 (51.94)
475.00 (5.31) 604.98 (10.66) 343.56 (5.08) 314.25 (7.68) 345.37 (4.16) 361.13 (5.25) 499.12 (4.85) 163.58 (12.13) 226.78 (21.88)
703.25 (7.86) 670.51 (11.82) 526.64 (7.78) 386.62 (9.44) 742.31 (8.94) 543.70 (7.90) 802.01 (7.79) 175.64 (13.02) 220.10 (21.24)
8,948.88 (100) 5,674.14 (100) 6,766.96 (100) 4,094.44 (100) 8,301.33 (100) 6,879.19 (100) 10,294.32 (100) 1,348.50 (100) 1,036.39 (100)
whole-tree were better than branches and leaves; the trunk biomass estimation was better than the two organs of the crown. This is consistent with previous research results.
The reason is mainly that the crown biomass of trees was great influenced by crown shape, size, and tree growth.
These factors were varying with climate and site conditions.
They caused great variations of crown biomass. In addition, in biomass surveys, we used sampling methods in the data acquisition of the crown part. The estimation data were af- fected by the presence of sampling error, which has great influence on equation fitting and estimation results.
Estimation of forest biomass
The biomass of different organs and whole-tree of all the trees in each plot were estimated using the best biomass equations for individual tree developed in this paper previously. Then the forest biomass of 9 plots was calcu- lated and listed in Table 6.
The total biomass of a stand was related with stand age and forest density under the assumption that the site con- dition of all the stands in the same research area has no great difference.
As can be seen from Table 6, the forest biomass of
branch, leaf, especial trunk and whole-tree, have an obvious increasing tendency with the increase of stand age. The bio- mass of trunk and whole-tree in plot Z05 of 47-years were less than the same component biomass in plot Z01 and Z07 of 45-years. It is mainly because that plot Z05 has the small- est forest density of 450 per hectare. Taking plot Z01, Z06 and Z09 as examples to reduce the influence of forest den- sity, the there plot has a similar forest density about 1500 per hectare, and the stand ages were 45, 38, 12 years respectively. It can be found that the biomass of all the or- gans increased with the stand age. The biomass of branch and leaf of plot Z09 were large than plot Z08 with stand age of 20. It is because Pinus sylvestnis var. mongolica plantation forest in plot Z09 is young forest and the branch and leaf bi- omass account for a large scale of total biomass, which had been described in previous study. The forest biomass in the plots that stand ages were larger than 45, remains a relative stable trend. It can be conclude that 45-50 years was the mature stand age of Pinus sylvestnis var. mongolica plantation and it can be harvest near the period.
The influence of forest density on forest biomass was not significant comparing with stand age. The total biomass of 9 plots almost has no obvious relationship with forest den-
sity for the age difference. Considering about the plots of Z05, Z03 and Z01, which have a similar stand age about 45 years, and the forest density were 450, 1100, 1640 per hec- tare respectively, the forest biomass of all component has the same increasing trend with the number of trees in the forest.
There was no further study about the influence of forest density on forest biomass in this paper for the lack of abun- dant data.
Conclusions
1) The biomass of branch, trunk and whole tree biomass of individual tree in Pinus sylvestnis var. mongolica plantation increases significantly with stand age for the result of photosynthesis. There is a great deal of leaf biomass at the beginning of forest growth period, and then it remains a stable level before the mature age.
Trunk biomass occupies dominant position of above- ground biomass. The proportion of trunk biomass in- creases with tree age while branch and leaf biomass has an inverse tendency.
2) Diameter at breast height (DBH) and tree eight (HT) were determination independent variables to predict individual tree biomass. The validation results of estab- lished equations of different organs of Pinus sylvestnis var.
mongolica plantation show that the equations’ deviance measures were all fairly low and they have no systematic bias. The estimated precisions of all equations for the vali- dation data sets were greater than 90%.
The estimation results of trunk and whole-tree were bet- ter than branch and leaf. The equations of predicting branch and leaf biomass has lower precision for the sam- pling error in data acquisition process.
3) Normally, the forest biomass of different organs in- creased with the increasing of stand age and density. But the influence of forestry was not obviously compared with stand age. The harvest period of Pinus sylvestnis var. mongolica plantation is about 45-50 years according to the study.
Acknowledgements
We thank the workers and researches for investigating filed data and setting up the database on biomass based upon the following programs: Forestry Public Welfare
Project (201004026)-the Basic Model System for Main Tree Species in Northeast China, National Scientific and Technology Supporting Project (2011BAD37B02) -Key Technologies and Demonstration of Optimize and Cultivating for Carbon-sinks Forest in Northeast China, Research Fund Project of Higher Education of China (DL09BA10).
References
Cannell, MGR. 1982. World forest biomass and Production Date, Academic Press, Penicuik, Scotland.
Chen LG, Zheng YS, Yao QD. 2002. New Bamboo Plant in Less Crowded Coastal Sand and Biomass Structure. Fujian College of Forestry 22: 249-252.
Ding GJ. 2003. Studies on Pine Plantation Biomass and Productiv- ity - Biomass and Density Effects in Different Planting Densi- ties. Fujian College of Forestry 2: 34-38.
Dong WY, Huang BL, Xie ZX. 2002. Biomass Structure of Clonal Population and Dynamics Study of Cage Bamboo. Forest Research 15: 416-420.
Ebermeyr E. 1876. Die Gesamte Lehre der Waldstreu Mit Rucksicht Auf Die Chemische Statik des Waldbaues. Belin: J, Springer.
Fang JY, Wang GG, Liu GH, Xu SL. 1998. Forest Biomass of China: An Estimate Based on the Biomass-Volume Relation- ship. Ecological Applications 8: 1084-1091.
Fang JY, Wang ZM. 2001. Forest Biomass Estimation at Regional and Global Levels, with Special Reference to China’s Forest Biomass. Ecological Research 16: 587-592.
Feng Z, Wang X, Wu G. 1999. Biomass and Productivity of Chinese Forest Ecosystems. Science Press, Beijing, China.
Kittredge J. 1944. The Estimation of the Amount of Foliage of Trees and Stands. J Forest 42: 905-912.
Liao KF. 1996. Growth of Loblolly Pine Plantations at High Altitudes and Biomass Research. Fujian College of Forestry 16:
375-377.
Satoo, T. 1982. Forest Biomass. Dr. W. Junk Publisher, The Hague, Netherlands.
Wang M, Dai L, Ji L. 2001. A preliminary study on ecological re- sponse of dominant tree species in Korean pine broadleaf forest at Changbai Mountain to soil water stress and their biomass allocation. Ying Yong Sheng Tai Xue Bao 12: 496-500.
Wang YG. 1996. Research Results of Biomass and Productivity in Different Mixed Fir Forests. Fujian College of Forestry 16:
156-159.
Xiao WF, Nie DP, Zhang JC. 1999. Research China's Fir Timber Biomass and Energy Efficiency. Forest Research 12: 237-243.
Yi WM, Zhang ZP, Ding MB. 2000. Community Biomass of Grid Wood and Efficiency of Energy Use in Dinghushan. Ecology 20: 397-403.