Vol. 29, No. 2, pp. 157-164, May, 2013 http://dx.doi.org/10.7747/JFS.2013.29.2.157
Chittagong University Campus: Rich in Forest Growing Stock of Valuable Timber Tree Species in Bangladesh
Salena Akter1, Md. Siddiqur Rahman2,* and M. Al-Amin2
1Department of Environment, Chittagong, Ministry of Environment and Forest, Chittagong 4202, Bangladesh
2Institute of Forestry and Environmental Sciences, University of Chittagong, Chittagong 4331, Bangladesh
Abstract
The campus of Chittagong University in Bangladesh is rich in forest ecosystem. The campus has large area with vast tract of land planted with valuable timber tree species. The present study identifies and discovers the potential growing stock of the plantations in the campus area. This Growing stock was measured in three parameters viz. volume, biomass and organic carbon stock. Study identified thirty three economically valuable forest tree species in the plantations of Chittagong University. Out of three growing stock parameters, volume of timber was found to be low in indigenous tree species in the plantation sites other than exotic species. This might be due to their slow growth rate and low density in the plantation sites. However, biomass and organic carbon stock of trees per hactre area showed that indigenous species gather and sequester more timber and carbon respectively than introduced species. Plantations of Chittagong University campus can acquire 25.51 m3/ha volume of economically important tree species, where biomass and organic carbon stock is 222.33 tonne/ha and 107.48 tonne/ha respectively. This result shows a positive impression on the plantation site to be considered as good forest reserve.
Key Words: Growing stock, economically important forest tree species, University of Chittagong, volume and biomass, organic carbon stock
Received: May 17, 2012. Revised: October 9, 2012. Accepted: October 9, 2012.
Corresponding author: Md. Siddiqur Rahman
Institute of Forestry and Environmental Sciences, University of Chittagong, Chittagong 4331, Bangladesh Tel: 8801814308288, E-mail: [email protected]
Introduction
An ideal forest consists of three components one of which is growing stock (Davis 1966). Growing stock is the sum (by number or volume) of all the trees growing in the forest or a specified part of it (Prakash 1986). In any healthy forest, growing stock can be measured by volume, biomass or its carbon content.
The Study was conducted in the campus of the Chittagong University, Bangladesh. Chittagong University campus has a healthy forest plantation area where the cam-
pus belongs 1,271 acres of land (Islam et al. 1979). The original vegetation is highly eroded due to biotic inte- raction. Then it is converted to secondary forest with weedy environment such as thickest with a few scattered trees, thatching grasses and some bamboos (Anon 2002). A total of 665 species under 404 genera and 126 families are pres- ent in Chittagong University campus (Alam and Pasha 1999). Forest plays an important role in global carbon se- questration (Rawat et al. 2003). Brown (1996) reported that a hectare of actively growing forest can sequester 2-5 tonne of carbon per year. The plantations of the campus
may be a good reservoir of organic carbon (Miah et al.
2011).
With a huge pool of existing plantations and natural for- ests in Bangladesh, it can be assumed that Bangladesh is playing a major role in mitigating global warming. To real- ize the potential of the forestry sector in Bangladesh for full-scale emission mitigation, understanding carbon se- questration potential of different species in different types of plantations are important (Miah et al. 2011).
Islam et al. (1979) described that primary forest of the hills was cleared long ago and presently covered with secon- dary vegetation such as thickets with a few scattered trees, thatching grasses and some bamboos. Pre existing natural forests were cleared and presently they are almost left unproductive. The condition resembles to the most of the unclassified state forest (USF) of the Chittagong Hill tracts (CHTs). In a view to have quick vegetation cover in these barren hills both the indigenous and exotic species have been tried to grow. The valleys are locally under short grasses and reeds. A large part of them is cultivated mainly for rice. Most of the presently fallow land is valleys used to be cultivated before the university took it.
The forests of Chittagong University are fall under the tropical wet Evergreen forests and the tropical semi ever- green forests (Anon 2011). The university authority first initiated a small scale plantation program in 1973. Except for roadside plantation, the progress was slow till 1982.
Then an afforestation program was taken by the then IFCU in 1982. After this plantation program IFESCU started year wise plantation activities in different places in the campus area (Anon 2011). Almost all the tree species are planted as a part of afforestation programme (Akter et al. 2011). Alam and Pasha (1999) conducted a study on the angiosperm plant diversity of Chittagong University Campus through repeated field trips in different seasons during the last 20 years. An extensive survey and collection of angiosperm flora were made throughout the area. A total of 665 species under 404 genera and 126 families are pre- sented, of which 550 species belonged to dicotyledons and 115 species to Monocotyledons. The plants were analyzed according to their habit types. The number of tree species was 103 in dicotyledons and 4 in monocotyledons. Present study finds some authentic information about the growing
the campus.
Materials and Methods
Study site
The Study was conducted in the campus of the University of Chittagong. The campus of Chittagong University is located at Fatehpur, a village under Hathajari thana in the sadar north subdivision of Chittagong District.
The Chittagong University campus lies between about 22o 27'30'' and 22o29'0'' North latitudes and 91o46'30'' and 91o47'45'' East longitudes. The campus lies some 12 miles north of the Chittagong town itself, about 2 miles south-west of the Chittagong-Rangamati road and a little closer to the Chittagong-Nazirhat railway branch lines (Islam et al. 1979).
Sampling and design of plots
The plot was determined through Gareth’s method (Gareth 1991). For sampling tree species 10x10 m plot were determined. Complete Randomized Block Design (CRBD) was followed for taking samples from the sample plots (Akter et al. 2011). The plot were laid out in the field through measuring tape and peg were used in each corner of the plot, within plot diameter at breast height (1.3 m) were measured by using diameter tape. Total height was measured using Spiegel Relaskope. Wood sample from main bole of the trees were collected by using wood borer.
Volume calculation
After collection of field data, data were compiled and proceed with the help of computer. The basal area per tree and volume per tree was calculated by the formula given by Chaturvedi and Khanna (1982):
Basal area per tree=3.14xD2/4 ··· (I) Where, D=Diameter at breast height in meter
Volume (V)=Basal areaxH ··· (II) Where, H=Total height in meter
total basal area of each species were calculated and then converted to the basal area per hectare and volume per hec- tare for each species.
Biomass estimation
As the study was conducted in the forest and individuals of 33 tree species were measured in the sampling plot. It was not possible to cut all the trees and estimating biomass of trees. Some models were developed by Brown (1997), Luckman et al. (1997), Negi et al. (1988) and Brown et al.
(1989). In the present study Models of Brown et al. (1989) was used to determine above ground biomass because this method is the most suitable method for tropical forest (Alves et al. 1997; Brown 1997; Schroeder et al. 1997;
Miah et al. 2011; Ullah and Al-Amin, 2012). This is the simplest method of estimating forest tree biomass in the tropics as it requires only tree diameter at breast height, to- tal height and wood specific gravity. While other models or regression equations require sectional diameter, this simply deals with diameter at breast height.
This models is as follows
Y=exp. {-2.4090+0.9522 ln (D2HS)} ··· (III)
Where, Exp.=[……] means “raised to the power of [……]”
Y=Above ground biomass in kg H=Height of the trees in meter.
D=Diameter at breast height (1.3 m) in cm.
S=Wood density in units of tonne/m3 for a specific spe- cies (Brown 1997; Sattar et al. 1999).
Using these models above ground biomass of each trees were estimated. From above ground biomass of each in- dividuals mean biomass of each species were calculated and each individual biomass was converted to tonne/ha for each species and mean was calculated and added each in- dividuals of a species to get total above ground biomass of each species.
Below ground biomass was calculated considering 15%
of the above ground biomass (MacDicken 1997; IPCC 2003; Miah et al. 2011). Below ground biomass was calcu- lated for each individual. Above and below ground biomass of trees were added to get total biomass of trees.
Organic carbon measurement
This method is known as Loss on Ignition Method (postulated by Allen et al. 1986; supported by Alamgir and Al-Amin 2007 and Ullah and Al-Amin 2012). During field work sample from each tree was collected. After taking the fresh weight of samples using electric balance, samples were dried at 65oC in the oven for 48 hours and dried weight of each sample was taken. Dried samples were grind into fine powder. Then porcelain crucibles were washed with 6N HCL and distilled water and dried in an oven at 65oC for 1 hour. Oven dried grind samples are taken (1.00 g) in pre-weighted crucibles. The crucibles are placed in the furnace. Then the furnace was adjusted at 550oC, heat- ing was increased slowly and after reaching at 550oC, igni- tion was continued for 1 hour. The crucibles were cooled slowly keeping them inside the furnace. After cooling, the crucibles with ash were weighted and percentage of organic carbon was calculated. This method is supported by Alamgir and Al-Amin (2007); Ullah and Al-Amin (2012) and Miah et al. (2011) in international peer reviewed jour- nal articles and books. The formula and symbolic calcu- lations are given below which were formulated by Allen et al. (1986) is given below:
Ash (%)=(W3-W1)/(W2-W1)x100 ··· (IV) C (%)=(100-% Ash)x0.58 ··· (V)
[Considering 58% carbon in ash free timber material]
(Alamgir and Al-Amin 2007).
Where,
C=Organic carbon;
W1=Weight of crucibles;
W2=Weight of sample+Crucibles;
W3=Weight of ash+Crucibles
Using above procedure and formula, carbon percentage was calculated for each tree. This is a reliable method where IPCC (Intergovernmental Panel on Climate Change of the UN) has dependent on biomass for estimating organic car- bon content of living tree (IPCC 2003).
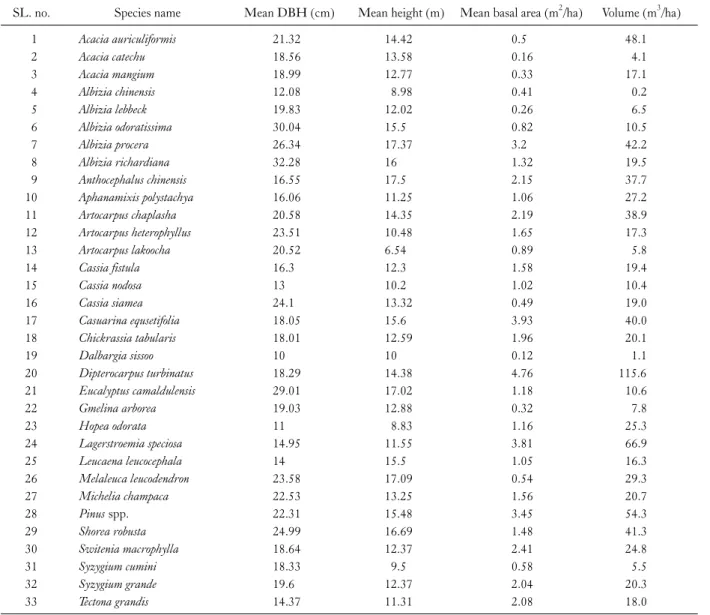
Table 1. Volume of economically important tree species in the study area in unit area
SL. no. Species name Mean DBH (cm) Mean height (m) Mean basal area (m2/ha) Volume (m3/ha) 1
2 3 4 5 6 7 8 9 10 11 12 13 14 15 16 17 18 19 20 21 22 23 24 25 26 27 28 29 30 31 32 33
Acacia auriculiformis Acacia catechu Acacia mangium Albizia chinensis Albizia lebbeck Albizia odoratissima Albizia procera Albizia richardiana Anthocephalus chinensis Aphanamixis polystachya Artocarpus chaplasha Artocarpus heterophyllus Artocarpus lakoocha Cassia fistula Cassia nodosa Cassia siamea Casuarina equsetifolia Chickrassia tabularis Dalbargia sissoo Dipterocarpus turbinatus Eucalyptus camaldulensis Gmelina arborea Hopea odorata Lagerstroemia speciosa Leucaena leucocephala Melaleuca leucodendron Michelia champaca Pinus spp.
Shorea robusta Switenia macrophylla Syzygium cumini Syzygium grande Tectona grandis
21.32 18.56 18.99 12.08 19.83 30.04 26.34 32.28 16.55 16.06 20.58 23.51 20.52 16.3 13 24.1 18.05 18.01 10 18.29 29.01 19.03 11 14.95 14 23.58 22.53 22.31 24.99 18.64 18.33 19.6 14.37
14.42 13.58 12.77 8.98 12.02 15.5 17.37 16 17.5 11.25 14.35 10.48 6.54 12.3 10.2 13.32 15.6 12.59 10 14.38 17.02 12.88 8.83 11.55 15.5 17.09 13.25 15.48 16.69 12.37 9.5 12.37 11.31
0.5 0.16 0.33 0.41 0.26 0.82 3.2 1.32 2.15 1.06 2.19 1.65 0.89 1.58 1.02 0.49 3.93 1.96 0.12 4.76 1.18 0.32 1.16 3.81 1.05 0.54 1.56 3.45 1.48 2.41 0.58 2.04 2.08
48.1 4.1 17.1 0.2 6.5 10.5 42.2 19.5 37.7 27.2 38.9 17.3 5.8 19.4 10.4 19.0 40.0 20.1 1.1 115.6 10.6 7.8 25.3 66.9 16.3 29.3 20.7 54.3 41.3 24.8 5.5 20.3 18.0
Results and Discussion
Volume
Results depict that highest timber volume was found in Dipterocarpus turbinatus (115.6 m3/ha) followed by Lagerstroemia speciosa (66.9 m3/ha), Pinus spp. (54.3 m3/ha).
Volume of exotic tree species (Acacia auriculiformis, Casuarina equsetifolia, Lagerstroemia speciosa, Pinus spp. etc.) showed higher volumetric growth than indigenous forest tree species (Acacia catechu, Albizia chinensis, Albizia lebbeck, Albizia odoratissima, Albizia richardiana, Artocarpus lakoocha,
This may be due slow growth rate, in abundant distribution of the indigenous species in plantations. One exception is Dipterocarpus turbinatus which showed highest volume in its plantations sites. On an average 25.51 m3/ha volume has been gathered in the campus plantations. Table 1 shows vol- ume per hactre area of thirty three economically important tree species found in the study area.
Biomass
While volume was low for indigenous species per hectare basis, biomass of trees per unit hactre is it is higher than
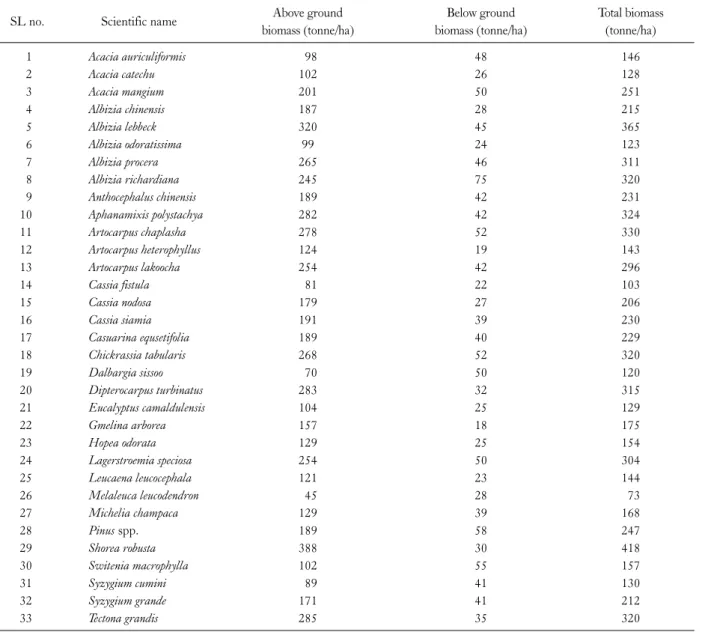
Table 2. Above ground, below ground and total biomass of tree species in study area
SL no. Scientific name Above ground
biomass (tonne/ha)
Below ground biomass (tonne/ha)
Total biomass (tonne/ha) 1
2 3 4 5 6 7 8 9 10 11 12 13 14 15 16 17 18 19 20 21 22 23 24 25 26 27 28 29 30 31 32 33
Acacia auriculiformis Acacia catechu Acacia mangium Albizia chinensis Albizia lebbeck Albizia odoratissima Albizia procera Albizia richardiana Anthocephalus chinensis Aphanamixis polystachya Artocarpus chaplasha Artocarpus heterophyllus Artocarpus lakoocha Cassia fistula Cassia nodosa Cassia siamia Casuarina equsetifolia Chickrassia tabularis Dalbargia sissoo Dipterocarpus turbinatus Eucalyptus camaldulensis Gmelina arborea Hopea odorata Lagerstroemia speciosa Leucaena leucocephala Melaleuca leucodendron Michelia champaca Pinus spp.
Shorea robusta Switenia macrophylla Syzygium cumini Syzygium grande Tectona grandis
98 102 201 187 320 99 265 245 189 282 278 124 254 81 179 191 189 268 70 283 104 157 129 254 121 45 129 189 388 102 89 171 285
48 26 50 28 45 24 46 75 42 42 52 19 42 22 27 39 40 52 50 32 25 18 25 50 23 28 39 58 30 55 41 41 35
146 128 251 215 365 123 311 320 231 324 330 143 296 103 206 230 229 320 120 315 129 175 154 304 144 73 168 247 418 157 130 212 320
Shorea robusta followed by Albizia lebbeck, Artocarpus chapla- sha, Aphanamixis polystachya, Albizia richardiana, Chickrassia tabularis etc. all of which are pure indigenous species for Bangladesh. On an average 222.33 tonne/ha biomass has been stored in the campus. Table 2 shows how much dry matter content (biomass) can be stored in different planted tree species in the campus area.
While calculating biomass content in the forest of Chittagong hilly regions of Bangladesh, Miah et al. (2011) found that the average highest biomass carbon content (145 tC ha-1) was in the Aphanamixis polystachya stands, and the
lowest (43 tC ha-1) was in the Swietenia mahagoni stands.
Results found that, 8-year-old Acacia auriculiformis stand had the highest (173 tC ha-1) biomass carbon contents fol- lowed by 12-year-old A. polystachya stand (166 tC ha-1).
Lowest (55.20 tC ha-1) carbon contents were found in the 6-year-old D. turbinatus stand. Average biomass content was found 183 t/ha.
Ullah and Al-Amin (2012) found biomass content in Tankawati natural forest of Bangladesh in 2009 to be 209.85 tha-1, which was slightly lower than our result (222.33 tha-1).
Table 3. Above ground, below ground and total organic carbon of tree species in study area
SL no. Scientific name Mean above ground organic carbon (tonne/ha)
Mean below ground organic carbon (tonne/ha)
Mean organic carbon (tonne/ha) 1
2 3 4 5 6 7 8 9 10 11 12 13 14 15 16 17 18 19 20 21 22 23 24 25 26 27 28 29 30 31 32 33
Acacia auriculiformis Acacia catechu Acacia mangium Albizia chinensis Albizia lebbeck Albizia odoratissima Albizia procera Albizia richardiana Anthocephalus chinensis Aphanamixis polystachya Artocarpus chaplasha Artocarpus heterophyllus Artocarpus lakoocha Cassia fistula Cassia nodosa Cassia siamia Casuarina equsetifolia Chickrassia tabularis Dalbargia sissoo Dipterocarpus turbinatus Eucalyptus camaldulensis Gmelina arborea Hopea odorata Lagerstroemia speciosa Leucaena leucocephala Melaleuca leucodendron Michelia champaca Pinus spp.
Shorea robusta Switenia macrophylla Syzygium cumini Syzygium grande Tectona grandis
56 41 140 99 170 62 149 1.40 81 102 150 61 97 55 101 83 39 158 34 160 48 49 82 111 71 38 79 98 127 89 54 73 140
9 7 20 25 24 14 20 25 12 16 28 8 38 7 14 5 6 20 18 24 17 5 11 18 2 16 11 24 17 8 1 21 19
65 48 160 124 194 76 169 165 93 118 178 69 135 62 115 88 45 178 52 184 65 54 93 129 73 54 90 122 144 97 55 94 159
Alamgir and Al-Amin (2007) found that mean total bio- mass was highest in Ficus bengalensis (6.21 tonne/tree) and lowest in Pterocarpus indicus (0.05 tonne/tree) in Chittagong (South) Forest Division. Another study conducted by Ullah (2010) concluded that in Tankawati Natural Forest of Bangladesh total ground biomass was highest in Ficus bengalensis (3,580.28 kg/tree) and lowest in Albizia falcataria (38.68 kg/tree).
Organic carbon stock
species studied is summarized in Table 3. Results show that some species like Albizia lebbeck, Dipterocarpus turbinatus, Chickrassia tabularis, Artocarpus chaplasha, Albizia procera, Albizia richardiana etc. can sequester more than 150 tonne organic carbon per hactre area. All these species are purely indigenous. Therefore, they have the ability to store more carbon and act as sink than exotic species in plantations.
However, on an average 107.48 tonne/ha organic carbon has been stored in the campus. This figure is very much im- pressive and the site might be considered as a potential car-
mean organic carbon stored per hactre area in the planta- tions of thirty three economically important species.
Studying plantations in the Chittagong hilly regions, Miah et al. (2011) found good reserve of forest trees. Study found an average of 92 t/ha organic carbon content in hill forest of Chittagong.
Study conducted by Chavan and Rasal (2010) found that mean above ground, mean below ground and mean organic carbon stock in Albizia lebbeck was 1.18, 0.17 and 1.35 tonne/tree respectively. And in Cassia fistula it was 0.55, 0.08 and 0.63 tonne/tree and in Dalbergia sissoo 0.46, 0.06 and 0.53 tonne/tree correspondingly.
Akter et al. (2011) found that mean organic carbon (kg/tree) was highest for Shorea robusta (185.03 kg/tree) while for Hopea odorata and Dipterocarpus turbinatus it was 167.51 kg/tree and 142.64 kg/tree respectively in Dipterocarpaceae plantations of Chittagong University campus. Above ground, below ground and total biomass organic carbon (tonne/hm2) was highest in Dipterocarpus turbinatus (7.9, 1.18 and 9.08 tonne/km2) in Chittagong (South) Forest Division (Alamgir and Al-Amin 2007).
Total carbon sequestration in Schima-Castanopsis forest, Nepal is 178.52 tonne/ha (Shrestha 2009). The weighted mean carbon concentration of Pinus pinaster reached 53.6%
in the shoots and 51.7% in the roots. The carbon content in the pine stand was 74 tonne carbon per hectare (Bert and Danjon 2005). Well-stocked forests typically sequester car- bon at a maximum rate between age 10 and 20-30 years. As an indication, at age 30 years about 200 to 520 tonnes CO2
equivalent (one tonne of C=3.67 tonnes of CO2 equiv- alent), are sequestered per ha in forests with productivity ranging from low to high. The sequestration rate slows gradually at about 80 to 100+ years of age, and then flat- tens out as growth is balanced by decay (Johnson and Coburn 2009). Pine, oak, fir and pine-oak forest of Mexico presented the highest total carbon stocks with values rang- ing between 220.7 and 266.9 Mg C/ha; degraded forest contained 169.2 Mg C/ha; plantation 142 Mg C/ha; avoca- do orchards reported 156.1 Mg C/ha; scrublands 121 Mg C/ha; grasslands 90.8 Mg C/ha and agriculture 82.7 Mg C/ha (Ordonez et al. 2008).
Ullah and Al-Amin (2012) found biomass tree organic carbon to be 110.94 tㆍha-1 in a purely natural forest where no plantations were ever held, which shows less than the
University plantation. Thus, plantations tree species gather higher organic carbon than pure natural stand.
Conclusion
The study concludes by estimating growing stock of thirty three economically important plantation tree species in the Chittagong University Campus. Growing stock in three parameters viz. Volume, Biomass and Organic Carbon Stock has been calculated and found to be im- pressive for establishing and conserving the area as ecologi- cally important. The campus might be considered as a good growing forest rich in growing stock. These forest planta- tions might be used as carbon forest to trade carbon in future. The study may be helpful to estimate growing stocks in these three parameters in other plantations of Bangladesh as a generic methodology. It will facilitate to get a more complete understanding of the organic carbon se- questration potential of different types of forests and planta- tions of Bangladesh. Study revealed that, plantations areas of Chittagong University campus can be a model for con- ducting research in forestry related studies which will help graduates to complete their projects easily without going elsewhere.
References
Akter S, Al-Amin M, Rahman MS. 2011. Carbon sequestration potential of dipterocarps at chittagong university plantations in Bangladesh. SAARC For 1: 103-112.
Alam MA, Pasha MK. 1999. A floristic account of chittagong uni- versity campus. Chittagong Univ J Sci 23: 81-99.
Alamgir M, Al-Amin M. 2007. Organic carbon storage in trees within different geopositions of Chittagong (South) forest divi- sion, Bangladesh. J For Res 18:174-180.
Allen SE, Grimshaw HM, Rowland AP. 1986. Chemical analysis.
In: Methods in Plant Ecology (Moore PD, Chapman SB, eds).
Blackwell Scientific Publications, Boston, pp 285-344.
Alves DS, Soares JVS, Amaral EMK, Mello SAS, Almeida O, Fernandes S, Silveria AM. 1997. Biomass of primary and secon- dary vegetation in Rondonia, Western Brazilian Amazon.
Global Change Biol 3: 451-462.
Anon. 2002. Forest management plan. Management plan proposal for chittagong university campus for the period of 2002-2003 to 2012-2013. Institute of Forestry and Environmental Sciences.
University of Chittagong. pp 131.
Anon. 2011. Integrated forest management plan for chittagong
university campus for the period 2010-2011 to 2020-2021.
Institute of forestry and environmental sciences. University of Chittagong. pp 142.
Bert D, Danjon F. 2005. Carbon concentration variations in the roots, stem and crown of mature Pinus pinaster (Ait.). For Ecol Manage 222: 279-295.
Brown S. 1996. Present and potential roles of forests in global change debate. Unasylva 47: 3-10.
Brown S. 1997. Estimating biomass changes of tropical forests: a primer, FAO Forestry Paper 134 edn. Food and Agriculture Organization (FAO UN), Rome, Italy.
Brown S, Gillespie AJ, Lugo AE. 1989. Biomass estimation meth- ods for tropical forests with applications to forest inventory data.
For Sci 35: 881-902.
Chaturvedi AN, Khanna SL. 1982. Forest mensuration. Interna- tional Book Distributors, Dehra Dun, India, pp 406.
Chavan BL, Rasal GB. 2010. Sequestered standing carbon stock in selective tree species grown in University campus at Auranga- bad, Maharashtra. Int J Eng Sci Te 2: 3003-3007.
Davis KP. 1966. Forest management: regulation and valuation.
2nd. McGrraw-Hill Book Company, USA.
Gareth W. 1991. Techniques and field work in ecology. Collins edu- cational publishers, Hammersmith, London, pp 125.
IPCC. 2003. Good practice guidance for land use, land-use change and forestry. Institute for Global Environmental Strategies (IGES), Japan.
Islam ATMT, Chowdhury MS, Hoque AKMM, Malek SA.
1979. Detailed Soil Survey of Chittagong University Campus, Hathazari, Chittagong, pp 13.
Johnson I, Coburn R. 2009. Trees for carbon sequestration.
Climate in Primary Industries, Primefact 981. Forest Science Centre, West Pennant Hills, Australia. www.dpionsw.gov.au Luckman A, Baker J, Mora T, Corina-da-Costa F, Frery CA.
1997. A study of the relationships between radar backscatter and regeneration tropical forest biomass for space borne SAR instruments. Remote Sens Environ 60: 1-13.
MacDicken KG. 1997. A guide to monitoring carbon storage in forestry and agroforestry projects. Winrock International Institute fir Agricultural Development, Arlington, VA 22209, USA.
Miah MD, Shin MY, Koike M. 2011. Forests to climate change mitigation: clean development mechanism in Bangladesh.
Springer-Verlag Berlin Heidelberg, ISBN 978-3-642-13252-0.
Negi JDS, Sharma SC, Sharma DC. 1988. Comparative assess- ment of methods for estimating biomass in forest ecosystem.
Indian For 114: 136-146.
Ordonez JAB, Jong BHJ, Oliva FG, Avina FL, Perez JV, Guerrero G, Martinez R, Masera O. 2008. Carbon content in vegetation, litter and soil under 10 dofferent land use and land cover classes in the Central Highlands of Michoacan, Mexico.
For Ecol Manage 255: 2074-2084.
Prakash R. 1986. Forest Management. M/S. International Book Distributors, Rajpur Road, Dehra Dun-248001, India, pp 256.
Rawat V, Singh D, Kumar P. 2003. Climate change and its impact on forest biodiversity. Indian For 129: 787-798.
Sattar MA, Bhattacharjee DK, Kabir MF. 1999. Physical and me- chanical properties and uses of timbers of Bangladesh.
Seasoning and Timber Physics Division, Bangladesh Forest Research Institute (BFRI), Chittagong, Bangladesh.
Schroeder P, Brown S, Birdsey JMR, Cieszewski C. 1997. Biomass estimation for temperate broadleaf forests of the US using in- ventory data. For Sci 43: 424-434.
Shrestha BP. 2009. Carbon Sequestration in Schima-Castanopsis Forest: A case study from Palpa District. The Greenery- a Journal of Environment and Biodiversity 7: 34-40.
Ullah MR, Al-Amin M. 2012. Above- and below-ground carbon stock estimation in a natural forest of Bangladesh. J For Sci 58:
372-379.
Ullah MR. 2010. Species composition, carbon stock and soil mac- ronutrients in natural and man made forests in chittagong. M.S.
unpublished Thesis paper. Institute of Forestry and Environ- mental Sciences, University of Chittagong, Bangladesh, pp 89.