J F E S
Journal of Forest and Environmental Science
Journal of Forest and Environmental Science Vol. 34, No. 1, pp. 1-11, February, 2018 https://doi.org/10.7747/JFES.2018.34.1.1
Biomass and Carbon Storage Pattern in Natural and Plantation Forest Ecosystem of Chhattisgarh, India
Manoj Kumar Jhariya* and Dhiraj Kumar Yadav
Department of Farm Forestry, Sarguja University, Ambikapur-497001 (Chhattisgarh), India
Abstract
We studied natural and plantation forest ecosystem of Sarguja in Chhattisgarh, India in order to understand how vegetation biomass, carbon stock and its allocation patterns vary among the sites. For this, stratified random sampling was opted to measure the different layers of vegetation. Wide floral diversity was found in the natural forest site as compared to the teak stand. Overall, 17 tree species found in natural forest comprising 8 families while in the teak stand 6 species were recorded. In understory strata 23 species were recorded (18 herbs and 5 shrubs) in natural forest whereas in teak stand 20 herb species and 3 shrubs were found. Great variation was also seen in the population dynamics of the different vegetation stratum in concerned sites. The sapling, seedling and herb density was found to be highest in natural stand while tree and shrub density was more in teak stand. Results indicated that stand biomass of the natural site was 321.19 t ha-1 while in the teak stand it was 276.61 t ha-1. The total biomass of tree layer in plantation site was 245.22 t ha-1 and natural forest 241.44 t ha-1. The sapling, seedling, shrub and forest floor biomass was found highest under natural forest as compared to the teak plantation site. Carbon stock has similar trend as that of biomass accumulation in natural forest and teak stand. Higher biomass accumulation and carbon stock were recorded in the higher girth class gradation of the population structure. Proper efforts are required to manage these diverse ecosystems to obtain higher biomass and sustainable ecological services.
Key Words: biomass, carbon storage, natural forest, stand, teak plantation
Received: May 19, 2017. Revised: October 8, 2017. Accepted: October 10, 2017.
Corresponding author: Manoj Kumar Jhariya
Department of Farm Forestry, UTD, Sarguja University, Ambikapur-497001 (Chhattisgarh), India Tel: +91-07774-223242, Fax: +91-07774-222791, E-mail: [email protected]
Introduction
Ecosystems are typically filled with large numbers of plant species along environmental gradient, making spe- cies-centered studies of systemic processes and functions ex- tremely difficult. Tropical forests are globally important be- cause of their economical and ecological perspectives. The forest stands are important as biodiversity habitats, major and minor forest products as well as carbon (C) sinks (Brown and Lugo 1990; UNDP et al. 2000; FAO 2010;
Jhariya et al. 2014; Yadav et al. 2017). Tropical forests har- bour the greatest wealth of biological and genetic diversity on the earth (Bargali et al. 2015; Baboo et al. 2017; Jhariya 2017a). These biodiversity rich forests have world attention because of the growing awareness of its importance on the one hand and the anticipated massive depletion on the other (Singh 2002; Jhariya 2010; Yadav et al. 2017). Forests are natural storehouses of biomass and C (FAO 2005). Forests fix, store and emit C by photosynthesis, respiration, decom- position and disturbances through a series of stages in the
life cycle from regeneration to harvest.
These forest ecosystems are most used, threatened and large pressures being placed on these forests as a results of different human activities. Anthropogenic activities have contributed to accelerated forest degradation. Land use pat- tern and disturbance regimes had a profound effect on the abundance, distribution and diversity of vegetation in the area (Kyayesimira and Lejju 2015). The magnitude of the impacts on these forests ecosystem dynamics can be assessed by using the vegetation structure, composition and pro- duction variability. Predictions of possible forests ecosystem, structural and functional changes over time can be assessed by these approaches. The magnitude of impact that anthro- pogenic pressures on forest ecosystem functioning can fur- ther be assessed using plant biomass quantification (Vogt and Persson 1991). The rate and intensity of disturbances regulates the level of heterogeneity of the habitat. The forest stands are subjected to various kinds of natural disturbances that emit a range of space of new species introduction in a place (Jhariya et al. 2016; Jhariya and Yadav 2017). These pressures on forest can cause uncontrolled influences that bring changes in floral and faunal diversity, habitat, land- scape, soil degradation and may often lead to considerable alterations in the environmental conditions (Jhariya et al.
2012, 2014; Bargali et al. 2014; Kittur et al. 2014a, 2014b;
Jhariya 2014, 2017a, 2017b).
To evaluate the status and trends of forest ecosystems along with the structure and its function, the quantification of stand biomass is essential (Ovington 1962; Brown et al.
1999; Jhariya 2014; Behera et al. 2017). Storage pattern and production of organic matter in forests in relation to the biotic and abiotic disturbances is critical for better manage- ment and an essential aspect of studies of C cycle (Keller et al. 2001; Cairns et al. 2003; Sahu et al. 2013a; Jhariya 2014; Jhariya et al. 2014; Pawar et al. 2014) which facilitate knowledge regarding changes in forest ecosystem and to compare the stand by forest types. Presently there is a dearth of information on biomass and carbon storage pattern of natural and plantation forest of this region. Therefore, pres- ent investigation was done to assess and highlight these as- pects of such forest ecosystem.
Materials and Methods
Study sites
The present work is carried out to quantify the biomass and carbon storage pattern in natural forest of Chendra and teak plantation (Established in the year 1962) of Sumerpur (Chendra, range Dhaurpur, Beat No. 2589, Ganjhadand, Coupe No. VII and area about 47 ha). The study area is lo- cated between 23° 05’ 14.7’’ to 23° 05’ 16.8’’ north latitude and 83° 16’ 29.6” to 83° 16’ 31.8’’east longitude. Sarguja district is placed in the northern part of Chhattisgarh state of India. The area has over extension between S-E parts of Vindhyachal-Baghelkhand domain of peninsular India.
The district Sarguja, is represented by very rich floral and faunal diversity (Sinha et al. 2014, 2015; Yadav et al. 2015;
Jhariya and Yadav 2016; Yadav and Jhariya 2017). About 58% of the area in the district lies under forests. The flora of Nazzul and other areas are changing frequently with the human activities and land-use. The physiographic division of the regions are: highlands, uplands and central plain.
The climate of district is characterized by hot summer and well distributed rainfall during the monsoon season. Soil of Sarguja district can be broadly classified in four major classes: red and yellow soils, alluvial soils, laterite soils and medium blue soils, respectively.
Experimental design
The stratified random sampling was laid out to analyze the vegetation structure in natural and plantation forest ecosystem. The tree layer was analyzed by randomly laying quadrats of size 10×10 m and girth at breast height (i.e., 1.37 m above the ground) of all the species was measured and recorded individually. In each of these quadrat, a sub-quadrat of 2×2 m size were randomly laid for measur- ing saplings, seedlings and shrub, while the herb and forest floor biomass were quantified by laying a sub-quadrat of 50×50 cm. The seedlings (<10 cm GBH) and shrub were measured at the collar height and each species counted separately.
For the measurement of biomass, allometric equation as- sociated with tree circumference to biomass developed by Singh and Misra (1979) and Singh and Singh (1991) for the dry deciduous forest species were used. The individuals were classified into various girth classes. The mean circum-
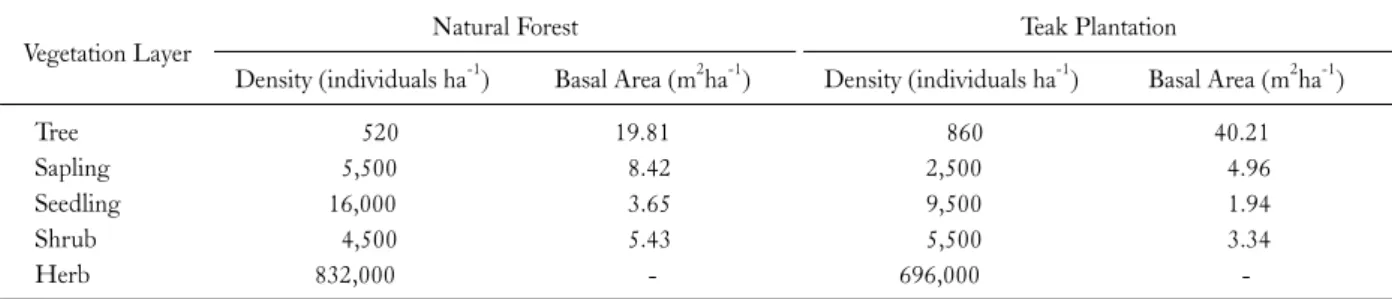
Table 1. Vegetation statistic in natural forest and teak plantation in Sarguja forest division
Vegetation Layer Natural Forest Teak Plantation
Density (individuals ha-1) Basal Area (m2ha-1) Density (individuals ha-1) Basal Area (m2ha-1)
Tree 520 19.81 860 40.21
Sapling 5,500 8.42 2,500 4.96
Seedling 16,000 3.65 9,500 1.94
Shrub 4,500 5.43 5,500 3.34
Herb 832,000 - 696,000 -
Fig. 1. Relationship between density with mean girth class (cm) are: A=≤10;
B=>10-≤30; C=>30-≤50;D=>50-≤70; E=>70-≤90; F=>
90-≤110; G=>110.
ference at breast height value for each species for a girth class was used in the regression equation to get an estimate of biomass (by component i.e. bole, branch, foliage and root) for that girth class. Then this value was multiplied by the density of trees in that girth class. The girth class values were added to obtain the biomass estimate for each of the quadrates in each site. The forest floor biomass was col- lected and samples were weighed after drying. Forest floor was collected from each site and then categorized into dif- ferent components (Singh 1995; Jhariya 2017b). Carbon storage in the vegetation was calculated using the reported carbon concentration values for vegetation pools of dry trop- ics as 43.5% in bole, 45.67% in branch, 46.67% in leaf and 35.73% in root (Sahu et al. 2013a; Jhariya 2014, 2017a;
Pawar et al. 2014).
Results and Discussion
Stand structure and composition
In natural forest, tree layer comprised of 9 species belong- ing to 8 families, sapling layer represented by 6 species and 6 families, while in seedling layer 7 species belonging to 7 families were found. The teak stand showed less diversity in terms of species presence and family richness (total 6 spe- cies, 2 trees species with 2 family, 3 sapling species belong- ing to 3 family and 6 seedling species comprising 5 fami- lies) as compared to natural forest. Natural forest comprised of 5 shrub and 18 herb species whereas in teak stand 3 shrub and 20 herb species were noticed. The density of tree, sap- ling, seedling and shrub in natural forest was 520, 5,500, 16,000 and 4,500 individuals ha-1 with basal area of 19.81, 8.42, 3.65 and 5.43 m2h-1, respectively. Whereas in planta- tion site it was 860 individuals ha-1 for tree, 2500 in- dividuals ha-1 for sapling, 9,500 individuals ha-1 for seed-
ling and 5,500 individuals ha-1 for shrub layer (Table 1).
The herb density was found more in natural stand while it was lesser in teak stand.
In the present study tree density and girth relationship (Fig. 1) revealed an exponential model [Y=exp (a-bx)].
The sites possessed small structure (≤10 cm girth) as 72.66% and 73.87% individuals, respectively in natural and teak stand. The relationship between density and girth class revealed 1.27-6.22% individuals were distributed in girth class >50 cm. This was due to higher turnover, anthro- pogenic removal and low biomass accumulation in natural forest and teak stand. Pooled data on density and girth class
gradation were related according to:
(1) Y=exp [15,300−0.9586x] for Natural stand r2=0.767 p<5%
(2) Y=exp [6110.7−0.6998x] for Teak stand r2=0.619 p<5%
The species richness in the concerned site is comparable with the report of Pawar et al. (2014), which reflected that 6-12 species of trees, 2-9 species of sapling, 4-14 species of seedlings across the site at same forest types. The density of trees resembles with the findings of various reports. Pawar et al. (2014) reported the tree density between 100-510 stems ha-1, seedling density from 7,750-39,500 stems ha-1 and total tree basal area varied from 11.47-26.67 m2 ha-1 which found to be comparable with present estimated values. Jhariya et al. (2010) reported that tree density ranged from 255-630 trees ha-1. Higher value of tree den- sity (650-1,520 trees ha-1) were reported by Bargali et al.
(2014). Thakur and Swamy (2010) estimated the density of different forest types and it varied from 324-733 trees ha-1, basal area from 8.13-28.87 m2 ha-1 and number of species from 9-26. Sharma et al. (2010) studied the four forest stands each of twenty major forest types in sub-tropical to temperate zones and reported stem density ranged from 295-850 individuals ha-1. Murphy and Lugo (1986) have measured 17-40 m2 ha-1 basal area in sub-tropical dry forests.
Kumar et al. (2016) reported 4 tree species, 5 sapling spe- cies, 18 seedling species and 7 shrub species across the study sites. A total of 440 trees ha-1 were encountered in eucalyptus plantation, 480 trees ha-1 in teak plantation and 960 trees ha-1 in mixed plantation. The total density of saplings, seed- lings and shrubs ranged from 60-860 saplings ha-1, 2400-8960 seedlings ha-1 and 240-960 shrubs ha-1, re- spectively across the sites (Kumar et al. 2016). Thapa et al.
(2011) reported a very close value of tree density to present investigation (864 ha-1 for teak plantation & 1,110 trees ha-1 for sal plantation), sapling density (432-2,880 trees ha-1 for teak and sal plantation) and seedling density (12,800- 14,450 ha-1 for teak and sal plantation). Cordero and Kanninen (2003) reported tree density from 156-1,600 in- dividuals ha-1 for different aged of teak plantation. Sahu et
al. (2013a) reported 1,010-1,380 trees ha-1 in teak planta- Table 2
. Biomass (t ha-1 ) of tree layer in natural forest and teak plantation in Sarguja forest division SpeciesNatural forestTeak plantation BoleBranchLeafRootTotalBoleBranchLeafRootTotal Aegel marmelous (L.)5.66±1.139.09±1.820.53±0.112.13±0.4317.41±3.48----- Anogeissus latifolia Wall.1.69±0.315.03±0.990.32±0.051.16±0.23 8.20±1.63----- Cassia fistula Linn.0.81±0.13 0.75±0.120.09±0.020.31±0.051.97±0.36----- Diospyrous melanoxylon Roxb.0.81±0.140.56±0.110.08±0.01 0.31±0.051.75±0.33----- Lannea coromandelica (Houtt.) Merr.0.81±0.130.75±0.120.09±0.02 0.31±0.051.97±0.36----- Madhuca latifolia Roxb.8.45±1.0212.01±1.620.84±0.38 3.17±0.7724.48±2.22----- Mitragyna parviflora Roxb.6.97±1.3911.88±2.350.64±0.112.62±0.5022.11±4.40 ----- Shorea robusta Gaertn.f.50.98±1.3286.66±2.33 4.80±0.3419.15±0.81161.58±2.78----- Tectona grandis Linn. f.-----115.40±1.0554.09±0.84 24.30±0.4534.01±0.47227.80±1.48 Terminalia tomentosa W & A.0.81±0.160.75±0.140.09±0.020.31±0.061.97±0.38 5.66±1.119.09±1.800.53±0.082.13±0.4117.41±3.45 Total77.01±1.38127.49±2.48 7.49±0.4029.45±0.90241.44±2.96121.06±1.1963.18±1.3624.83±0.4736.14±0.61245.22±1.87
Table 3. Biomass (t ha-1) of sapling and seedling layer in natural forest and teak plantation in Sarguja forest division Vegetation
layer
Natural forest Teak plantation
Bole Branch Leaf Root Total Bole Branch Leaf Root Total
Sapling 27.73±2.69 14.53±2.27 4.19±1.03 10.13±1.62 56.59±4.0 10.19±1.47 3.59±0.79 2.24±0.78 4.58±1.04 20.60±2.10 Seedling 4.27±0.83 0.94±0.17 0.86±0.14 1.59±0.28 7.66±1.51 2.54±0.49 0.56±0.10 0.51±0.09 0.94±0.18 4.55±0.91
Table 4. Shrub biomass (t ha-1) in natural forest and teak plantation in Sarguja forest division
Shrub pools Stem Foliage Root Total
Natural Forest 11.56±2.80 1.33±0.80 2.61±1.28 15.50±3.17
Teak Plantation 4.42±1.74 0.72±0.15 1.10±0.61 6.24±1.98
Fig. 2. Girth class wise distribution of biomass in natural and plantation for- est ecosystem.
tion site which was found higher than present investigation.
Vegetation biomass
The tree biomass among the site found to be significantly different. The total biomass of natural forest and teak stand were 241.44 t ha-1 and 245.22 t ha-1, respectively. In natural forest higher biomass were contributed by Shorea robusta (66.92%) while in the plantation site Tectona grandis (92.90%) shared the highest biomass in total (Table 2). The total aboveground biomass for tree in natural forest was
211.99 t ha-1 while in teak plantation it was 209.08 t ha-1. The bole, branch, leaf and root component comprised of 31.90%, 52.80%, 3.10% and 12.20%, respectively to the to- tal biomass in natural forest. Distribution of biomass by components in teak stand were 49.37% by bole, 25.76% by branch, 10.13% by leaf and 14.74% by root, respectively.
The sapling and seedling biomass was found highest un- der natural stand as compared to teak plantation. The high- est sapling biomass in natural forest was recorded by Shorea robusta (21.12 t ha-1) followed by Lagerstroemia parviflora (21.05 t ha-1) and least by Buchanania lanzan (2.21 t ha-1).
Teak stand reflected the higher biomass contributed by Tectona grandis (14.08 t ha-1). The seedling biomass ranged from 4.55 t ha-1 to 7.66 t ha-1 being highest under natural forest while least in teak stand (Table 3). The shrub biomass showed similar pattern as of sapling and seedling biomass.
It was found maximum in natural forest (15.50 t ha-1) and least unde teak plantation (6.24 t ha-1) (Table 4).
The size class A and B which represented seedling and sapling layer, respectively were found higher in terms of their population but the gross biomass seems to be accumu- lated in higher girth class (>100 cm) in natural forest while in the teak stand most share of biomass was accumu- lated in the girth class of 80-90 cm (Fig. 2). It reflected from the study that in natural stand 64.89% of biomass was accumulated under the girth class of >100 cm, 23.26% in girth class of 60-100 cm and 11.85% in the girth class of 30-60 cm, respectively. In teak stand about 42.48% biomass accumulation was found in the girth class of >100 cm, 39.40% in girth class of 70-100 cm and remaining (18.12%) in girth class of 40-70 cm.
Table 5. Forest floor biomass (t ha-1) in natural forest and teak plan- tation in Sarguja forest division
Components Natural forest Teak plantation
Leaf Litter 4.54±0.26 1.65±0.18
Wood Litter 1.34±0.58 0.78±0.41
Total 5.89±0.30 2.43±0.14
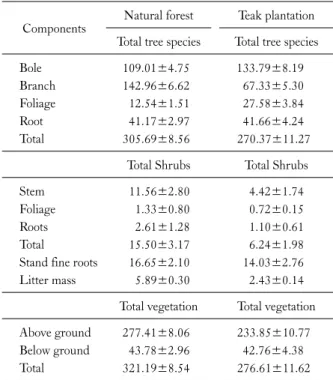
Table 6. Stand biomass (t ha-1±1 SE) in natural forest and teak plantation in Sarguja forest division
Components Natural forest Teak plantation Total tree species Total tree species
Bole 109.01±4.75 133.79±8.19
Branch 142.96±6.62 67.33±5.30
Foliage 12.54±1.51 27.58±3.84
Root 41.17±2.97 41.66±4.24
Total 305.69±8.56 270.37±11.27
Total Shrubs Total Shrubs
Stem 11.56±2.80 4.42±1.74
Foliage 1.33±0.80 0.72±0.15
Roots 2.61±1.28 1.10±0.61
Total 15.50±3.17 6.24±1.98
Stand fine roots 16.65±2.10 14.03±2.76
Litter mass 5.89±0.30 2.43±0.14
Total vegetation Total vegetation Above ground 277.41±8.06 233.85±10.77 Below ground 43.78±2.96 42.76±4.38
Total 321.19±8.54 276.61±11.62
Forest floor biomass
The litter mass in natural forest and teak stand varied greatly (Table 5). In the natural stand total litter mass was twice as compared to the teak stand. Total litter biomass was 5.89 t ha-1 in natural stand, of which (77.08%) constituted by leaf litter and remaining (22.92%) by wood litter. The teak plantation has 2.43 t ha-1, of which 67.90% contributed by leaf mass and remaining (32.10%) by wood litter. The litter component reflected that the leaf mass was higher in natural stand while the wood litter biomass was found to be highest in teak stand.
The ground materials (forest floor & litterfall) are the key source for nutrients cycling in vegetation stand. Higher litter mass leads towards rich and diverse forest stand (Jhariya 2017b; Kumar et al. 2017a). Kumar et al. (2017b) reported that the total forest floor biomass ranged from 2.61-6.07 t ha-1 which supports the present findings.
Kumar et al. (2016) found that the total litter biomass in different plantation sites varied from 1.98-4.01 t ha-1, least in teak plantation and highest under eucalyptus plantation.
Sahu et al. (2013b) reported the forest floor biomass in teak plantation varied from 2.19-2.66 t ha-1.
Stand biomass
The stand biomass of the study site varied from 276.61-321.19 t ha-1 being highest under natural forest and least in teak stand. The total above ground and below ground biomass were 86.37% and 13.63% to the total in natural forest while in the teak plantation it was 84.54% and 15.46% in above ground and below ground compartments, respectively (Table 6). It was found that natural forest con- sists of 44.58 t ha-1 higher total biomass than the teak stand.
The tree biomass shared 95.17% to the total vegetation bio- mass in natural forest while in teak plantation it was 97.74%
to the total vegetation biomass, respectively.
The forest biomass rely on type of species, species mix, density, girth class, age, locality factors of the stand or region. It is significantly altered by perturbation, land-use, harvesting and climatic variance (Canadell et al. 2007).
Pawar et al. (2014) reported total biomass between 127.69-227.71 t ha-1. Total above ground biomass was 111.20-199.42 t ha-1 and total below ground biomass varied from 16.49-28.29 t ha-1, respectively. Alone (2014) re- ported the above ground biomass of 104.27-196.32 t ha-1, below ground biomass of 21.49-37.78 t ha-1 and total bio- mass of 119.37-235.14 t ha-1 for teak plantation in tropics of Chhattisgarh, India. The contribution of bole, branches and foliage to the total above ground biomass ranged be- tween 58.60-60.88%, 25.81-29.37% and 13.30-12.02%, respectively. Jhariya et al. (2014) reported total biomass range from 101.43-192.36 t ha-1. The closer value of above ground biomass (225 Mg ha-1) was reported by Cairns et al. (2003) for Mexican tropical forest. The global pattern of above ground biomass (30-273 t ha-1) and total biomass (78-320 t ha-1) also supports the present estimated values (Murphy and Lugo 1986).
The above ground biomass is very similar to Cairns et al.
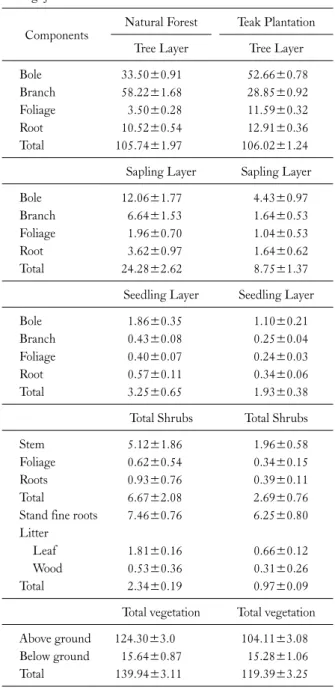
Table 7. Stand C stock (t ha-1) in natural forest and teak plantation in Sarguja forest division
Components Natural Forest Teak Plantation Tree Layer Tree Layer
Bole 33.50±0.91 52.66±0.78
Branch 58.22±1.68 28.85±0.92
Foliage 3.50±0.28 11.59±0.32
Root 10.52±0.54 12.91±0.36
Total 105.74±1.97 106.02±1.24
Sapling Layer Sapling Layer
Bole 12.06±1.77 4.43±0.97
Branch 6.64±1.53 1.64±0.53
Foliage 1.96±0.70 1.04±0.53
Root 3.62±0.97 1.64±0.62
Total 24.28±2.62 8.75±1.37
Seedling Layer Seedling Layer
Bole 1.86±0.35 1.10±0.21
Branch 0.43±0.08 0.25±0.04
Foliage 0.40±0.07 0.24±0.03
Root 0.57±0.11 0.34±0.06
Total 3.25±0.65 1.93±0.38
Total Shrubs Total Shrubs
Stem 5.12±1.86 1.96±0.58
Foliage 0.62±0.54 0.34±0.15
Roots 0.93±0.76 0.39±0.11
Total 6.67±2.08 2.69±0.76
Stand fine roots 7.46±0.76 6.25±0.80 Litter
Leaf 1.81±0.16 0.66±0.12
Wood 0.53±0.36 0.31±0.26
Total 2.34±0.19 0.97±0.09
Total vegetation Total vegetation Above ground 124.30±3.0 104.11±3.08
Below ground 15.64±0.87 15.28±1.06
Total 139.94±3.11 119.39±3.25
(2000) for the semi-evergreen forest (111.2-225.8 Mg ha-1).
Total below ground biomass of present study resembled with below ground biomass of tropical deciduous forest es- timated by Singh et al. (2009). Present findings are sup- ported by Borah et al. (2013) where they have reported aboveground tree biomasses from 32.47-261.64 Mg ha-1 in tropical forest of Assam. Similarly, Thokchom and Yadava (2013) noted the aboveground biomass in the range of 179.14-246.38 Mg ha-1 for subtropical forests of India.
Gairola et al. (2011) reported the wide range of above- ground biomass from 172-380 Mg ha-1. Mohanraj et al.
(2011) estimated 372 Mg ha-1 aboveground biomass of tropical forests of India which was more than present value.
Pande and Patra (2010) estimated the biomass of Sal forest and miscellaneous forest of India and found that the above ground biomass ranged from 154.9-345 t ha-1. Yadava (2010) found 130-255 Mg ha-1 above ground biomass for sub-tropical broad leaved forest of India. The plantation bi- omass values also resembles with the biomass values of oth- er plantations such as Eucalyptus (127-242 t/ha) from sub-tropical region (Bargali and Singh 1991; Bargali et al.
1992; Bargali and Singh 1995) and Pinus patula (109-151 t/ha) from temperate region (Bargali and Singh 1997a & b).
Ambagahaduwa et al. (2009) estimated 136-194 t ha-1 above ground biomass for Pinus caribaea plantation.
Cordero and Kanninen (2003) studied above ground bio- mass of teak plantations and found the foliage dry biomass comprised of 1-6% of the total tree dry biomass, 5-30%
corresponded to branches and 70-90% to stem dry weight.
Devagiri et al. (2013) reported above ground biomass ranged from 7.25-287.047 t ha-1. Navar-Chaidez (2011) found 116.37-167.43 Mg ha-1 aboveground biomass which is comparable with the present study. Sharma et al. (2010) reported that the total biomass ranged from 129-533 Mg ha-1. Nascimento and Laurance (2002) found the total above ground biomass values was 397.7 t ha-1. The most important component of above ground biomass were large trees which comprised 81.9% of total above ground bio- mass followed by downed wood debris (7.0%), small trees, saplings & seedlings (5.3%), lianas (2.1%), litter (1.9%), snags (1.5%) and stemless palms (0.3%). Among large trees above ground biomass was greatest in intermediate sized (20-50 cm DBH) stems (46.7%), with very large (< or
> 60 cm DBH) trees also containing substantial biomass
(13.4%). Swamy et al. (2010) concluded that total stand bi- omass averaged from 440-571 Mg ha-1, of which trees con- tributed 90.2-92.2% and remaining 8.8-9.8% contributed by shrubs and herbs. Upadhyay et al. (2009) found that the understorey contributed about 32% (172 t ha-1) and over- storey layer constituted about 68% (372 t ha-1) to the total biomass.
Carbon stock
The carbon allocation pattern of above ground, below ground compartments and total C stock varied greatly in natural and plantation sites (Table 7). Furthermore, site to site variations by different vegetation stratum were also var- ied significantly. The total C stock varied from 119.39- 139.94 t C ha-1, being highest in natural forest and least in teak stand. The tree layer comprised of 75.56% and 88.80%
share to the total C stock, respectively in natural forest and teak stand. The sapling, seedling and shrub shared 17.35%, 2.32% and 4.77% C to the total C stock in natural forest while in the teak stand it were 7.33%, 1.62% and 2.25%, re- spectively shared by sapling, seedling and shrub layer to the total C stock. The total above ground and below ground contribution were 88.82% and 11.18% to the total C stock in natural forest whereas in teak stand it were 87.20% and 12.80%, respectively to the total C stock. The girth class wise C stock has similar trend of allocation as that of bio- mass accumulation in both the studied sites.
The higher fraction of biomass accumulation in the higher girth class in natural stand reflects the role of large trees in C capture and storage. The natural forests in tropics are under the pressure due to various anthropogenic interferences. The distribution of trees by size class is a key determinant of C stock (Baishya et al. 2009; Alone 2014;
Jhariya 2014). Pawar et al. (2014) found 55.125-98.548 t C ha-1 across the sites. Jhariya et al. (2014) have reported the total C stock varied from 50.71-96.18 t C ha-1 which is close to the present estimated value. Alone (2014) reported the total C stored in teak plantation varied from 54.06-100.68 t ha-1. The total C in aboveground and belowground components varied from 46.38-87.38 t ha-1 and 7.68-13.28 t ha-1, respectively. The relative contribution of aboveground and belowground components in the total C storage was 85.79-86.78% and 13.19-14.20%, respectively.
Thokchom and Yadava (2013) reported the above- ground C stock varied from 81.17-118.29 Mg C ha-1 across the forest stand. Borah et al. (2013) reported that the aboveground C stock in tree species ranged from 16.24- 130.82 Mg C ha-1 which is well within the range of present forest C stock. Tang et al. (2012) reported 155 Mg C ha-1 for the tropical forest of China, whereas Hoover et al. (2012) found 116-125 Mg C ha-1 in above ground compartment.
Metzker et al. (2011) reported 48-91 Mg C ha-1 for trop- ical forest of Brazil. Sharma et al. (2010) reported the total C storage ranged between 59-245 Mg ha-1 which sup- ported the present findings. The present findings are lower than the value documented by Baishya et al. (2009) and Mohanraj et al. (2011). Singh et al. (2009) reported the C storage was varied from 46.25-96.44 Mg ha-1 in tropical forests.
Flint and Richards (1996) estimated C stored in Southeast Asia including India, Thailand, Cambodia, Malaysia and Indonesia, and found 17 Mg C ha-1 in dry tropical forest and 350 Mg C ha-1 in tropical rain forests.
The C stored value in present investigation was higher (77 Mg C ha-1) to Sri Lanka’s tropical forests, but lower (223 Mg C ha-1) than tropical rain forest of Malaysia (Brown and Lugo 1982). Ogawa et al. (1965) found 60-179 t C ha-1 in variety of tropical forest of Thailand.
Conclusion
The plantation can be good substitute for obtaining the higher biomass in addition to its ecological services, but it can not be biologically rich as compared to natural forest.
Great variations were recorded in natural and teak stand in terms of the floral diversity, species richness, population dy- namics, girth gradation, biomass, littermass and C stock re- tained by these ecosystems. The tree biomass was found to be higher in teak stand due to its higher age and individuals belonging to higher girth class and less variability among them. The total stand biomass and C stock were sig- nificantly higher in natural ecosystem. For proper stocking plantation should be promoted in blank area and in such area where natural regeneration is not up to the mark.
Planting the fast growing species in the degraded land or clear felled area of the region was an effective measure in terms of the biomass production, C storage and sequestration. The information related to biomass and car- bon allocation patterns of different layer/stratum were piv- otal for effective decision making in sustainable forest man- agement and climate change mitigation.
Acknowledgements
We thank forest department of Ambikapur, Chhattisgarh
(India) for providing necessary assistance during the survey.
References
Alone RA. 2014. Biomass, carbon stock and carbon sequestration in an age series of teak plantation in tropical environment. PhD thesis. Indira Gandhi Krishi Vishwavidyalaya, Raipur, India.
Ambagahaduwa IM, Prasad N, Gunatilleke IAUN, Seneviratne G, Gunatilleke CVS. 2009. Estimation of above ground biomass of a Pinus caribaea Morelet stand in lower Hantana. J Nat Sci Found Sri Lanka 37: 195-201.
Baishya R, Barik SK, Upadhaya K. 2009. Distribution pattern of aboveground biomass in natural and plantation forests of humid tropics in northeast India. Trop Ecol 50: 295-304.
Bargali SS, Pandey VP, Bargali K. 2014. Floral composition and di- versity pattern in open and closed dry deciduous forest. Vegetos 27: 149-157.
Bargali SS, Shukla K, Singh L, Ghosh L, Lakhera ML. 2015.
Leaf litter decomposition and nutrient dynamics in four tree species of dry deciduous forest. Trop Ecol 56: 191-200.
Bargali SS, Singh SP. 1991. Aspects of productivity and nutrient cycling in an 8-year-old Eucalyptus plantation in a moist plain area adjacent to central Himalaya, India. Can J For Res 21:
1365-1372.
Bargali SS, Singh SP, Singh RP. 1992. Structure and function of an age series of eucalypt plantations in Central Himalaya. I. Dry matter dynamics. Ann Bot 69: 405-411.
Bargali SS, Singh SP. 1995. Dry matter dynamics, storage and flux of nutrients in an aged eucalypt plantation in Central Himalaya.
Oecologia Montana 4: 9-14.
Bargali SS, Singh RP. 1997a. Pinus patula plantations in Kumaun Himalaya. I. Dry matter dynamics. J Trop For Sci 9: 526-535.
Bargali SS, Singh RP. 1997b. Pinus patula plantations in Kumaun Himalaya. II. Nutrient dynamics. J Trop For Sci 10: 101-104.
Baboo B, Sagar R, Bargali SS, Verma H. 2017. Tree species com- position, regeneration and diversity of an Indian dry tropical for- est protected area. Trop Ecol 58: 409-423.
Behera SK, Sahu N, Mishra AK, Bargali SS, Behera MD, Tuli R.
2017. Aboveground biomass and carbon stock assessment in Indian tropical deciduous forest and relationship with stand structural attributes. Ecol Eng 99: 513-524.
Borah N, Nath AJ, Das AK. 2013. Aboveground biomass and car- bon stocks of tree species in tropical forests of Cachar districts, Assam, Northeast India. Int J Ecol Enviro Sci 39: 97-106.
Brown S, Lugo AE. 1982. The storage and production of organic matter in tropical forests and their role in the global carbon cycle.
Biotropica 14: 161-187.
Brown S, Lugo AE. 1990. Tropical secondary forests. J Trop Ecol 6: 1-32.
Brown SL, Schroeder P, Kern JS. 1999. Spatial distribution of bio- mass in forests of the eastern USA. For Ecol Manag 123: 81-90.
Cairns MA, Haggerty PK, Alvarez R, De Jong BHJ, Olmsted I.
2000. Tropical Mexico’s recent land use and change: a region’s contribution to the global carbon cycle. Ecol Appl 10: 1426-1441.
Cairns MA, Olmsted I, Granados J, Argaez J. 2003. Composition and aboveground tree biomass of a dry semi-evergreen forest on Mexico’s Yucatan Peninsula. For Ecol Manag 186: 125-132.
Canadell JG, Kirschbaum MUF, Kurz WA, Sanz MJ, Schlamad- inger B, Yamagata Y. 2007. Factoring out natural and indirect human effects on terrestrial carbon sources and sinks. Environ Sci Policy 10: 370-384.
Cordero LDP, Kanninen M. 2003. Aboveground biomass of Tectona grandis plantations in Costa Rica. J Trop For Sci 15:
199-213.
Devgiri GM, Money S, Singh S, Dadhwal VK, Patil P, Khaple A, Devkumar AS, Hubballi S. 2013. Assessment of above ground biomass and carbon pool in different vegetation types of south western part of Karnataka, India using spectral modeling. Trop Ecol 54:149-165.
FAO. 2005. Global forest resources assessment 2005: progress to- wards sustainable forest management. FAO, Rome.
FAO. 2010. Global forest resources assessment 2010. Food and Agriculture Organization of the United Nations, Rome, 378 pp.
Flint EP, Richards JF. 1996. Trends in carbon content of vegetation in South and Southeast Asia associated with changes in land use.
In: Effects of land-use change on atmospheric CO2 concen- trations (Dale VH, eds). Springer-Verlag, Berlin, pp 201-299.
Gairola S, Sharma CM, Ghildiyal SK, Suyal S. 2011. Live tree bio- mass and carbon variation along an altitudinal gradient in moist temperate valley slopes of the Garhwal Himalaya (India). Curr Sci 100: 1862-1870.
Hoover CM, Leak WB, Keel BG. 2012. Benchmark carbon stocks from old-growth forests in northern New England, USA. For Ecol Manag 266: 108-114.
Jhariya MK. 2010. Analysis of vegetational structure, diversity and fuel load in fire affected areas of tropical dry deciduous forests in Chhattisgarh. MSc thesis. Indira Gandhi Krishi Vishwavidya- laya, Raipur, India.
Jhariya MK, Bargali SS, Swamy SL, Kittur B. 2012. Vegetational structure, diversity and fuel load in fire affected areas of tropical dry deciduous forests in Chhattisgarh. Vegetos 25: 210-224.
Jhariya MK, Bargali SS, Swamy SL, Kittur B, Bargali K, Pawar GV. 2014. Impact of forest fire on biomass and carbon storage pattern of tropical deciduous forests in bhoramdeo wildlife sanc- tuary, Chhattisgarh. Int J Ecol Environ Sci 40: 57-74.
Jhariya MK. 2014. Effect of forest fire on microbial biomass, stor- age and sequestration of carbon in a tropical deciduous forest of Chhattisgarh. PhD thesis. Indira Gandhi Krishi Vishwavidya- laya, Raipur, India.
Jhariya MK, Kittur BH, Bargali SS. 2016. Assessment of herba- ceous biomass: a study in Rowghat mining areas of Chhatt- isgarh, India. J Appl Natural Sci 8: 645-651.
Jhariya MK, Yadav DK. 2016. Understory vegetation in natural
and plantation forest ecosystem of Sarguja (C.G.), India. J Appl Nat Sci 8: 668-673.
Jhariya MK, Yadav DK. 2017. Invasive alien species: challenges, threats and management. In: Agriculture Technology for Sustaining Rural Growth (Rawat SK, Narain S, eds). Biotech Books, New Delhi, pp 263-285.
Jhariya MK. 2017a. Vegetation ecology and carbon sequestration potential of shrubs in tropics of Chhattisgarh, India. Environ Monit Assess 189: 518.
Jhariya MK. 2017b. Influences of Forest Fire on Forest Floor and Litterfall in Bhoramdeo Wildlife Sanctuary (C.G.), India. J For Environ Sci 33: 330-341.
Keller M, Palace M, Hurtt G. 2001. Biomass estimation in the Tapajos national forest, Brazil: examination of sampling and al- lometric uncertainties. For Ecol Manag 154: 371-382.
Kittur BH, Swamy SL, Bargali SS, Jhariya MK. 2014a. Wildland fires and moist deciduous forests of Chhattisgarh, India: di- vergent component assessment. J For Res 25: 857-866.
Kittur B, Jhariya MK, Lal C. 2014b. Is the forest fire can affect the regeneration and species diversity. Ecol, Environ Conserv 20:
989-994.
Kumar A, Jhariya MK, Yadav DK, Banerjee A. 2017a. Vegetation dynamics in Bishrampur collieries of northern Chhattisgarh, India: eco-restoration and management perspectives. Environ Monit Assess 189: 371.
Kumar A, Jhariya MK, Yadav DK. 2016. Vegetation Dynamics in Plantation Sites of Collieries. Nat Environ Pollut Technol 15:
1285-1291.
Kumar A, Jhariya MK, Yadav DK. 2017b. Tree stratum and forest floor biomass in the proximity of collieries. Van Sangyan 4: 1-6.
Kyayesimira J, Lejju JB. 2015. Vegetation regeneration in formerly degraded hilly areas of Rwampara, South Western Uganda. J Ecol Nat Environ 7: 87-94.
Metzker T, Sposito TC, Martins MTF, Horta MB, Garcig QS.
2011. Forest dynamics and carbon stocks in Rio Doce state park – an Atlantic rainforest hotspot. Curr Sci 100: 1855-1862.
Mohanraj R, Saravanan J, Dhanakumar S. 2011. Carbon stock in Kolli forests, Eastern Ghats (India) with emphasis on above- ground biomass, litter, woody debris and soils. iForest – Biogeo- sci For 4: 61-65.
Murphy PG, Lugo AE. 1986. Structure and biomass of a sub- tropical dry forest in Puerto Rico. Biotropica 18: 89-96.
Nascimento HEM, Laurance WF. 2002. Total aboveground bio- mass in central Amazonian rainforests: a landscape-scale study.
For Ecol Manag 168: 311-321.
Navar-Chaidez J. 2011. The spatial distribution of aboveground biomass in tropical forests of Mexico. Trop Subtrop Agroecosys- tems 13: 149-158.
Ogawa H, Yoda K, Ogino K, Kira T. 1965. Comparative ecological studies on three main types of forest vegetation in Thailand II Plant biomass. Nat Life Southeast Asia 4: 49-80.
Ovington JD. 1962. Quantitative ecology and the woodland eco-
system concept. Adv Ecol Res 1: 103-192.
Pande PK, Patra AK. 2010. Biomass and productivity in Sal and miscellaneous forests of Satpura plateau (Madhya Pradesh) India. Adv Biosci Biotechnol 1: 30-38.
Pawar GV, Singh L, Jhariya MK, Sahu KP. 2014. Effect of anthro- pogenic disturbances on biomass and carbon storage potential of a dry tropical forest in India. J Appl Nat Sci 6: 383-392.
Sahu KP, Singh L, Alone RA, Jhariya MK, Pawar GV. 2013a.
Biomass and carbon storage pattern in an age series of teak plan- tation in dry tropics. Vegetos 26: 205-217.
Sahu KP, Singh L, Jhariya MK. 2013b. Fine root biomass, forest floor and nutrient status of soil in an age series of teak plantation in dry tropics. The Bioscan 8: 1149-1152.
Sharma CM, Baduni NP, Gairola S, Ghildiyal SK, Suyal S. 2010.
Tree diversity and carbon stocks of some major forest types of Garhwal Himalaya, India. For Ecol Manag 260: 2170-2179.
Singh KP, Misra R. 1979. Structure and functioning of natural, modified and silvicultural ecosystems of Eastern Uttar Pradesh:
technical report October 1975-October 1978. Banaras Hindu University, Varanasi, 161 pp.
Singh L, Singh JS. 1991. Species structure, dry matter dynamics and carbon flux of a dry tropical forest in India. Ann Bot 68:
263-273.
Singh L. 1995. Seasonal variation in biomass and nutrient content of the forest floor in a dry tropical forest. Oecol Mont 4: 21-26.
Singh L, Yadav DK, Pagare P, Ghosh L, Thakur BS. 2009. Impact of land use changes on species structure, biomass and carbon storage in tropical deciduous forest and converted forest. Int J Ecol Environ Sci 35: 113-119.
Singh SP. 2002. Balancing the approaches of environmental con- servation by considering ecosystem services as well as biodi- versity. Curr Sci 82: 1331-1335.
Sinha R, Yadav DK, Jhariya MK. 2014. Growth performance of Sal in Mahamaya central forest nursery (Ambikapur), Chha- ttisgarh. Int J Sci Res 3: 246-248.
Sinha R, Jhariya MK, Yadav DK. 2015. Assessment of Sal Seed- lings and Herbaceous Flora in the Khairbar Plantation of Sarguja Forest Division, Chhattisgarh. Curr World Environ 10:
330-337.
Swamy SL, Dutt CBS, Murthy MSR, Mishra A, Bargali SS.
2010. Floristics and dry matter dynamics of tropical wet ever- green forests f Western Ghats, India. Curr Science 99: 253-264.
Tang JW, Yin JX, Qi JF, Jepsen MR, Lu XT. 2012. Ecosystem carbon storage of tropical forests over limestone in Xishuang- banna, SW China. J Trop For Sci 24: 399-407.
Thakur T, Swamy SL. 2010. Analysis of land use, diversity, bio- mass, C and nutrient storage of a dry tropical forest ecosystem of India using satellite remote sensing and GIS techniques. Int For Environ Symp 15: 273-278.
Thapa N, Upadhaya K, Baishya R, Barik SK. 2011. Effect of plan- tation on plant diversity and soil status of tropical forest ecosys- tems in Meghalaya, Northeast India. Int J Ecol Environ Sci 37:
61-73.
Thokchom A, Yadava PS. 2013. Biomass and carbon stock assess- ment in the sub-tropical forests of Manipur, North-East India.
Int J Ecol Environ Sci 39: 107-113.
UNDP, UNEP, World Bank, World Resources Institute. 2000. A guide to world resources 2000-2001: people and ecosystems: the fraying web of life. World Resources Institute, Washington, DC, p 276.
Upadhyay R, Singh J, Singh B. 2009. Effect of disturbance on standing biomass in a sal mixed forest of Eastern U.P. Indian J For 32: 251-256.
Vogt KA, Persson H. 1991. Root methods. In: Techniques and ap- proaches in forest tree ecophysiology (Lassoie JP, Hinckley TM. eds). CRC Press, Boca Raton, pp 477-502.
Vogt KA, Vogt DJ, Bloomfield J. 1998. Analysis of some direct and indirect methods for estimating root biomass and production of
forests at an ecosystem level. 200: 71-89.
Yadav DK, Jhariya MK, Kumar A, Sinha R. 2015. Documentation and ethnobotanical importance of medicinal plants found in Sarguja district. J Plant Dev Sci 7: 439-446.
Yadav DK, Ghosh L, Jhariya MK. 2017. Forest Fragmentation and Stand Structure in Tropics: Stand Structure, Diversity and Biomass.
Lap Lambert Academic Publishing, Saarbrucken, 116 pp.
Yadav DK, Jhariya MK. 2017. Tree community structure, re- generation and patterns of diversity in natural and plantation forest ecosystem. Res Environ Life Sci 10: 383-389.
Yadava PS. 2010. Soil and vegetation carbon pool and sequestration in the forest ecosystems of Manipur, NE India. In: CO2 seques- tration technologies for clean energy: awareness and capacity building (Qasim SZ, Goel M, eds). Daya Publishing House, New Delhi, pp 163-170.