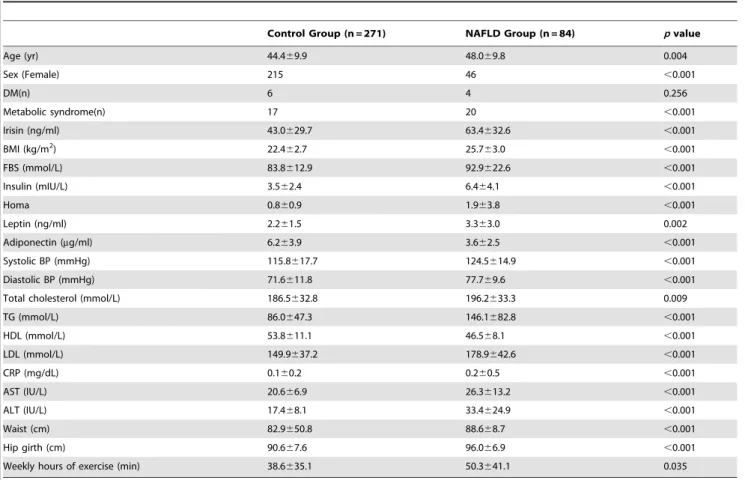
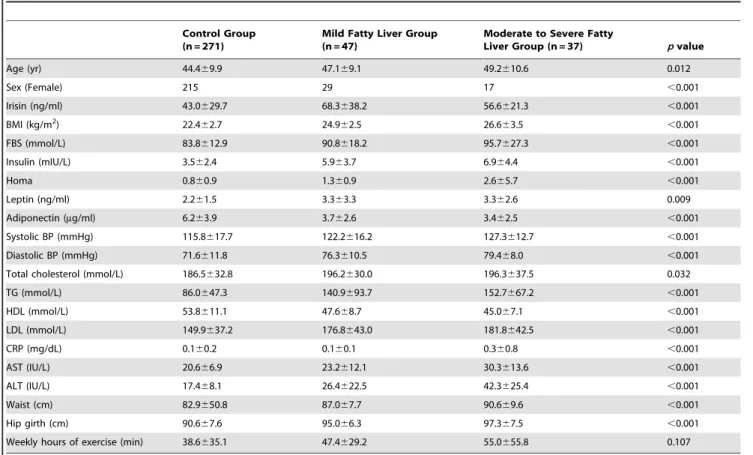
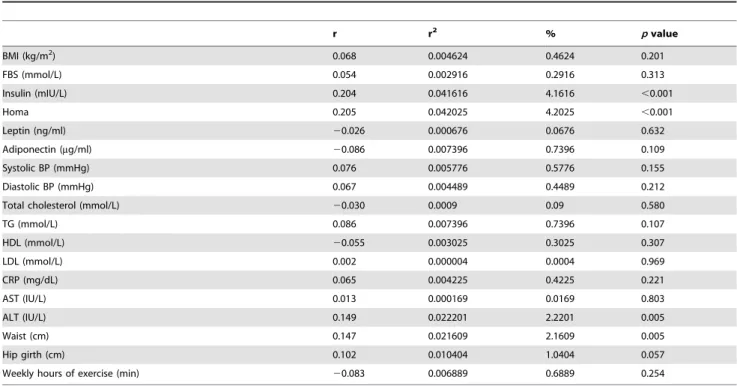
Association between Serum Irisin Levels and Non-Alcoholic Fatty Liver Disease in Health Screen Examinees
8
0
0
전체 글
(2)
(3)
(4)
(5)
(6)
(7)
(8)
수치

관련 문서
Keywords: Nonalcoholic Fatty Liver Disease; Osteoporosis; Bone Density; Metabolic Syndrome; Insulin Resistance.. Ah Young Eo, et al. The Association between NAFLD and Rate of
담낭암의 생존율은 방사선 검사 장비 및 치료가 발전하고 향상되 었다 하더라도 여전히 거의 증상이 없는 초기 단계에서 전이를 하기 도 하고 수술을 할 수 없는
Relevance of non- alcoholic fatty liver disease and colorectal neoplasia in asymptomatic populations
Table 3. Characteristics of colorectal cancer or adenoma according to the degree of non-alcoholic fatty liver disease.. Jae-Wook Lee, et al. Relevance of non- alcoholic fatty
를 검색하여 관련된 단어를 모두 포함하여, 검색어를 다음과 같이 조합하였다: (nonalcoholic fatty liver OR non-alcoholic fatty liver OR non alcoholic fatty
We designed this study to investigate the differences in serum iron, cardiac, and biochemical indices in men with fatty liver and the difference between alcohol
High-free androgen index is associated with increased risk of non-alcoholic fatty liver disease in women with polycystic ovary syndrome, independent of obesity and insulin
Increased serum levels of free fatty acid and glucose can cause oxida- tive stress in the liver and peripheral tissue, leading to ectopic fat accumulation, especially in the
Association of Serum Adipocyte-Specific Fatty Acid Binding Protein with Fatty Liver Index as a Predictive Indicator of Nonalcoholic Fatty Liver Disease.. Won Seon Jeon, Se Eun
