Difference in Serum Iron, Cardiac, and Biochemical Indices between Alcoholic and Non-alcoholic Fatty Liver
Cheol-Yu Kim, Seong-Min Moon1, Kyung-Yae Hyun1, Dae-Sik Kim2 and Seok-Cheol Choi3* Ung-Sang Health Center, Yang San 626-837, Korea
1Department of Biomedical Laboratory of Science, College of Smart Foods and Drugs, Inje University, Gimhae 621-749, Korea
2Department of Clinical Laboratory Science, Dongnam Health College, Suwon 440-714, Korea
3Department of Clinical Laboratory Science, College of Health Sciences, Catholic University of Pusan, Busan 609-757, Korea
Received January 6, 2009 /Accepted February 17, 2009
Although alcohol drinking may cause fatty liver to induce hepatocytic injury, other factors lead to it.
We designed this study to investigate the differences in serum iron, cardiac, and biochemical indices in men with fatty liver and the difference between alcohol drinkers (Alcohol group) and non-drinkers (Non-alcohol group). The alcohol group had higher body indices than the non-alcohol group. Systolic and diastolic blood pressure (SBP and DBP), and right and left intraocular pressure in the alcohol group were higher than those in the non-alcohol group. Hemoglobin, hematocrit, mean corpuscular hemoglobin, mean corpuscular hemoglobin concentration, and monocyte counts were higher in the al- cohol group than in the non-alcohol group. Alanine aminotransferase, γ-glutamyltranspeptidase, total cholesterol, triglyceride, low-density lipoprotein cholesterol, glucose, creatinine, uric acid, iron, total iron binding capacity, and ferritin levels in the alcohol group were greater than those in the non-alco- hol group. The present data reveals that alcohol-induced fatty liver has more elevated level of iron indices than in non-alcohol fatty liver as well as biochemical and cardiac indices, indicating that alco- hol-induced fatty liver may cause possibility of adult diseases including cardiovascular disease and metabolic syndrome.
Key words : Alcohol, fatty liver, iron indices, cardiac indices, biochemical indices
*Corresponding author
*Tel:+82-51-510-0564, Fax:+82-51-510-0568
*E-mail : [email protected]
Introduction
Fatty liver is one of adult diseases and alcohol con- sumption is its major factor. Although moderate alcohol con- sumption has been identified in the elevation of high-density lipoprotein cholesterol (HDL) and in the improvement in fi- brinolytic activity, chronic alcohol intake excess induces risks including hypertension and various diseases.
Alcohol intake is associated with liver diseases such as fatty liver, alcoholic hepatitis, and cirrhosis. Regular alcohol intake relates to higher blood pressure (BP) [41]. Chronic alcoholics are more prone to infections with a variety of pathogens, have decreased ability to fight infections, and have an increased risk of developing cancers, particularly those of the head, neck, and upper gastrointestinal system [25]. Both acute and chronic alcohol consumption can affect the immune system at the level of innate or acquired im- mune responses. Especially, heavy drinking causes compro-
mised immunity [11].
Previous study has defined that alcoholic liver disease pa- tients frequently show iron overload [36]. More recently, even mild to moderate alcohol consumption has been shown to increase the indices of iron stores [13]. Parenchymal cells of the liver and reticuloendothelial macrophages serve as de- pots for excess iron storage [17].
Though iron is an essential micronutrient required for vir- tually every aspect of normal function, hepatic iron is a risk factor in disease progression [28]. Iron may also leak out of injured hepatocytes. Fatty liver is one of the liver dis- orders to contribute to hepatocytic damage and plays a role in development of adults diseases. However, very little is known about the differences between alcoholic and non-al- coholic fatty liver in pathophysiological influences.
The present study was carried out to clarify whether there are the differences in serum iron metabolism, cardiac, and biochemical indices between alcoholic and non-alco- holic fatty liver. Moreover, we investigated hematological marker and compared the differences between the two groups.
Materials and Methods
Study population
65 alcohol drinking men (Alcohol group) and 37 non- drinking men (Non-alcohol group) were subjected to this study. Body indices (height, weight, and so forth), systolic and diastolic blood pressure (SBP and DPB, respectively), right and left intraocular pressure (RIP and LIP), CBC (complete blood cell count) & diff-count, urinalysis, bio- chemistry (liver and renal function), and iron indices [iron, total binding iron (TIBC), unsaturated binding iron (UIBC), and ferritin] were measured in fasting state in the study population.
Methods Body indices
For the study population, height, weight, waist measure- ment, obesity degree, body fat mass, waist-hip, index of body fat were measured by FA-94H (Fanics Co., Korea) and GENIVS-220 (Jawon-Medical Co., Korea) instruments.
Blood pressure and intraocular pressure
Systolic and diastolic blood pressure (SBP and DBP, re- spectively), and right and left intraocular pressure (RIP and LIP, respectively) were determined by Autoanalyzer (Green-Cross Co., Korea) and CANON TX10 (Canon Co., Japan).
Hematological and biochemical markers
CBC & diff-count were determined with 2 ml of blood using Coulter cell count (Coulter LH 750, Backman Coulter, USA). Biochemical markers in serum were analyzed by Autohumalyzer 9005 (Human Lab., Germany). Iron indices (iron, TIBC, UIBC, and ferritin) levels in serum were meas- ured by Hitachi 7600-210 (Hitachi Co., Japan) with Lqdia Fe (Asan Co., Korea) and Elecsys 2010 (Roche, Germany) with Ferritin kit.
Statistical analysis
Data are presented as mean±SD (standard deviation). All variables were statistically analyzed by unpaired t-test (SAS program). Statistical significance was accepted with p≤0.05.
Results and Discussion
Characteristics and body indices of study population
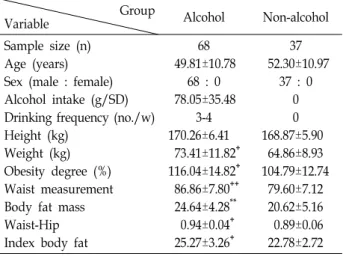
Table 1 shows the characteristics and body indices of the study population. The single alcohol amount of the Alcohol
Table 1. Demographic characteristics in the study population Group
Variable Alcohol Non-alcohol
Sample size (n) Age (years) Sex (male : female) Alcohol intake (g/SD) Drinking frequency (no./w) Height (kg)
Weight (kg) Obesity degree (%) Waist measurement Body fat mass Waist-Hip Index body fat
68 49.81±10.78
68 : 0 78.05±35.48
3-4 170.26±6.41 73.41±11.82+ 116.04±14.82+ 86.86±7.80++
24.64±4.28**
0.94±0.04+ 25.27±3.26+
37 52.30±10.97
37 : 0 0 0 168.87±5.90 64.86±8.93 104.79±12.74 79.60±7.12 20.62±5.16 0.89±0.06 22.78±2.72 Data are expressed as mean±SD.
**, p<0.01 (compared with Non-alcohol group).
+, p<0.001 (compared with Non-alcohol group).
++, p<0.000 (compared with Non-alcohol group).
Abbreviation: SD, single dose; no., number; w, a week.
group was 78.05±35.47 g and they had been drinking 3-4 times per week. There were no differences in age and height between the two groups (p>0.05). However, weight, obesity degree, waist size, body fat mass, waist-hip ratio, and index body fat in the Alcohol group were significantly higher than those in the Non-alcohol group (p<0.01 or p<0.000). It is well known that being overweight and having high body indices cause adult diseases or metabolic syndrome. As shown in these results, alcohol may lead to obesity and to high body indices. Previous studies demonstrated that alcohol drinking causes an increase in body weight [34].
BP and IP
As shown in Table 2, SBP, DBP, RIP and LIP in the
Table 2. Blood pressure and intraocular pressure in the two groups
Group
Variable Alcohol Non-alcohol
SBP (mmHg) DBP (mmHg) L-IP
R-IP
125.84±11.34**
77.76±7.60+ 15.46±3.80**
15.42±2.53**
118.30±10.05 70.40±5.82 13.90±2.38 13.70±2.47 Data are expressed as mean±SD.
**, p<0.01 (compared with Non-alcohol group).
+, p<0.001 (compared with Non-alcohol group).
Abbreviations: SBP, systemic blood pressure; DBP, diastolic blood pressure; R-IP, right intraocular pressure; L-IP, light in- traocular pressure.
Alcohol group were higher than those in the Non-alcohol group (p<0.01 or p<0.000) although their levels were within normal ranges. Moderate alcohol drinking improves endo- thelial function and gives protection against cardiovascular diseases [14]. Nevertheless, regular alcohol intake is asso- ciated with higher blood pressure [41]. The BP response seems to be proportional to the alcohol dose ingested.
Alcohol induced a biphasic effect on SBP and DBP [20].
Bau et al. [4] demonstrated that alcohol significantly de- creased BP 4 hrs after drinking, but increased it compared with that of non-drinking group after 13 hrs. The decline in BP induced by alcohol is considered to be a response to vasculation [1], but up to now no known pharmacological mechanism convincingly explains the hemodynamic re- sponses to alcohol [8]. Several authors have explained the late increase in BP following alcohol intake [27]. Alcohol-in- duced initial vasodilution might trigger a compensatory al- cohol-induced sodium retention which might participate in the subsequent BP elevation [16]. Clearly, moderate or heavy alcohol consumption may induce hypertension, causing car- diovascular and/or cerebrovascular diseases. Some studies suggest that the intake of even 2 drinks per day may increase the risk of hypertension, atrial fibrillation, and ischemic stroke [21].
Alcohol may cause an increase of intraocular pressure as well as an increase of blood pressure. Elevated intraocular pressure may contribute to glaucoma. Thus, alcoholic fatty liver might adversely affect the cardiovascular system.
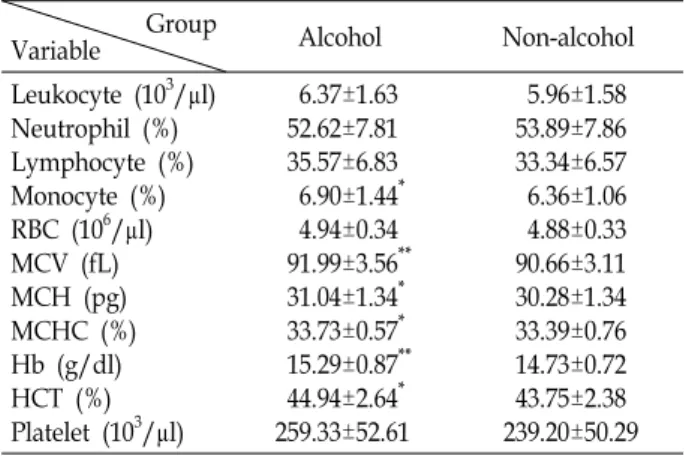
Hematological markers
Hemoglobin, hematocrit, mean corpuscular hemoglobin (MCH), mean corpuscular hemoglobin concentration (MCHC), and monocyte counts were higher in the Alcohol group than in the Non-alcohol group (p<0.05 or p<0.01, Table 3). These results are attributed to the alcohol-induced elevation of iron in alcoholic fatty liver.
Biochemical markers
The results of biochemical markers in the two groups are displayed in Table 4 and the normal ranges are presented in Table 5. In the liver function markers, AST (asparate ami- notransferase), ALP (alkaline phosphatase), total bilirubin, total protein, and albumin levels were not different between the two groups (p>0.05). However, ALT (alanine amino- transferase) and γ-GTP (γ-glutamyltranspeptidase) were greater in the Alcohol group than in the Non-alcohol group
Table 3. Hematological aspect in the two groups Group
Variable Alcohol Non-alcohol
Leukocyte (103/μl) Neutrophil (%) Lymphocyte (%) Monocyte (%) RBC (106/μl) MCV (fL) MCH (pg) MCHC (%) Hb (g/dl) HCT (%) Platelet (103/μl)
6.37±1.63 52.62±7.81 35.57±6.83 6.90±1.44* 4.94±0.34 91.99±3.56**
31.04±1.34* 33.73±0.57* 15.29±0.87**
44.94±2.64* 259.33±52.61
5.96±1.58 53.89±7.86 33.34±6.57 6.36±1.06 4.88±0.33 90.66±3.11 30.28±1.34 33.39±0.76 14.73±0.72 43.75±2.38 239.20±50.29 Data are expressed as mean±SD.
*, p<0.05 (compared with Non-alcohol group).
**, p<0.01 (compared with Non-alcohol group).
Abbreviations: RBC, red blood cell; MCV, mean corpuscular volume; MCH, mean corpuscular hemoglobin; MCH, mean corpuscular hemoglobin concentration; Hb, hemoglobin; HCT, hematocrit.
Table 4. Biochemistry in the two groups Group
Variable Alcohol Non-alcohol
AST (IU/l) ALT (IU/l) ALP (IU/l) γ-GTP (IU/l) T-bilirubin (mg/dl) T-protein (g/dl) Albumin (g/dl) Glucose (mg/dl) T-cholesterol (mg/dl) Triglyceride (mg/dl) HDL (mg/dl) LDL (mg/dl) BUN (mg/dl) Creatinine (mg/dl) Uric acid
Urine pH
31.37±10.27 33.54±22.46* 174.15±48.37 52.59±40.15++
0.81±0.27 7.86±0.28 4.56±0.19 108.64±31.17**
191.86±34.03++
161.41±54.98++
48.11±8.70 112.17±29.65* 15.03±3.41 1.04±0.27* 6.46±1.49++
6.32±0.58
36.90±10.71 23.90±17.22 168.00±46.53 18.40±15.84 0.84±0.48 7.76±0.34 4.50±0.20 95.90±13.61 161.85±28.04 63.55±23.51 47.60±9.75 101.55±21.80 15.39±4.26 0.95±0.15 5.19±0.87 6.05±0.43 Data are expressed as mean±SD.
*, p<0.05 (compared with Non-alcohol group).
**, p<0.01 (compared with Non-alcohol group).
++, p<0.000 (compared with Non-alcohol group).
Abbreviations: AST, asparate aminotransferase; ALT, alanine aminotransferase; ALP, alkaline phosphatase; γ-GTP, γ- glutamyltranspeptidase; T-bilirubin, total-bilirubin; T-protein, total-protein; T-cholesterol, total-cholesterol; HDL, high-den- sity lipoprotein.
(p<0.05 or p<0.000). These data suggest that alcohol intake resulted in the elevation in liver enzymes due to hep- atocytic damage, indicating that severity of damage is
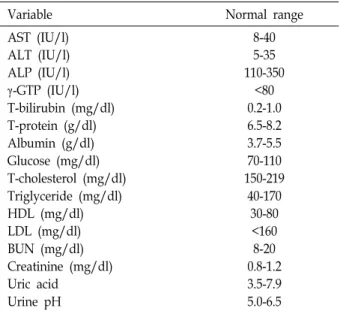
Table 5. Normal ranges of biochemical markers
Variable Normal range
AST (IU/l) ALT (IU/l) ALP (IU/l) γ-GTP (IU/l) T-bilirubin (mg/dl) T-protein (g/dl) Albumin (g/dl) Glucose (mg/dl) T-cholesterol (mg/dl) Triglyceride (mg/dl) HDL (mg/dl) LDL (mg/dl) BUN (mg/dl) Creatinine (mg/dl) Uric acid
Urine pH
8-40 5-35 110-350
<80 0.2-1.0 6.5-8.2 3.7-5.5 70-110 150-219
40-170 30-80
<160 8-20 0.8-1.2 3.5-7.9 5.0-6.5
higher in alcoholic than in non-alcoholic fatty liver. In par- ticular, the alcoholic fatty liver-induced increase of γ-GTP shows clinical significance. Even though the serum γ-GTP is a marker, which indicates disorders in the liver and gall bladder, recent studies demonstrated that the serum γ-GTP level within normal range was strongly associated with most cardiovascular disease risk factors and predicted the development of heart disease, hypertension, stroke, and type 2 diabetes [23,24]. Serum γ-GTP level has showed a strong graded relationship with incident diabetes, suggest- ing a role in the pathogenesis of diabetes [18]. Therefore, as the γ-GTP level of the Alcohol group is about three-folds as high as that of the Non-alcohol group, the Alcohol group may encourage the development of hyper- tension, cardiovascular disease, stroke, or diabetes. In the present study, the individuals with alcoholic fatty liver al- so had higher glucose, total cholesterol, triglyceride, LDL (low-density lipoprotein cholesterol), creatinine, and uric acid levels compared with the Non-alcohol group (p<0.05 or p<0.000). These findings indicate that alcohol-induced fatty liver may be associated with the development of dia- betes, dyslipidemia, liver and renal dysfunction, and gout.
Higher triglyceride levels were found more often with greater levels of alcohol intake in African-Americans than in Whites [32]. Choudhury et al. [5], Wakabayashi [33], and Wannamethee et al. [35] demonstrated that alcohol drink- ers had higher HDL and lower LDL levels. Onat et al. [23]
found that drinkers had a higher HDL, LDL, and total cho- lesterol levels than non-drinkers. However, we found that
Table 6. Iron indices in the two groups Group
Variable Alcohol Non-alcohol
Iron (μg/dl) (Normal) Ferritin (ng/ml) (Normal) TIBC (μg/dl) (Normal) UIBC (μg/dl) (Normal)
133.14±28.61* (60-120) 190.23±12.86++
(255-360) 366.92±28.61**
(260-430) 232.85±22.98
(140-330)
113.45±33.21 (60-120) 99.17±52.99
(255-360) 346.35±26.76
(260-430) 232.90±26.77
(140-330) Data are expressed as mean±SD.
*, p<0.0 (compared with Non-alcohol group).
**, p<0.01 (compared with Non-alcohol group).
++, p<0.000 (compared with Non-alcohol group).
Abbreviations: TIBC, total iron binding capacity; UIBC, un- saturated iron binding capacity.
HDL level in the Alcohol group was similar to that of the Non-alcohol group. Wannamethee and Shaper [34] showed that heavy drinkers had a higher triglyceride level. Our findings are partly consistent with opinions reported by Onat et al. [23] and Wannamethee [34]. Finally, alcoholic fatty liver may lead to higher concentration than non-alco- holic fatty liver in lipid markers.
Iron indices
As shown in Table 6, the Alcohol group had higher iron, TIBC, and ferritin levels than the Non-alcohol group (p<0.05 or p<0.000).
Iron is essential for an array of key biological processes including erythrocyte generation, cellular respiration and DNA synthesis [2,3]. The normal iron content in an adult man is 35 to 45 mg of iron/kg of body weight [3].
Parenchymal cells of the liver and reticuloendothelial macro- phages serve as depots for excess iron storage [3].
However, due to its potential to take part in the Fenton reaction as a transitional metal, iron can also be toxic to the cells [39]. In vivo whole-body retention studies have demon- strated a two-fold increase in intestinal iron absorption in chronic alcoholics [7].
In our study population, most of the participants in the Alcohol group were chronic alcohol drinkers and thus this is a reason for higher iron indices in the Alcohol group.
A central factor in the regulation of iron metabolism is hepcidin, which inhibits intestinal iron transport and re- leases iron from macrophages [9,22]. Alcohol is implicated in the regulation of hepcidin expression in the liver. Indeed,
alcohol was found to down-regulate hepcidin expression both in vitro with alcohol metabolizing hepatoma cell, and in vivo with mice subjected to short-term alcohol exposure [12]. Hence, alcohol-induced iron overload enhances the pro- duction of free radicals and primary cytokines, thereby lead- ing to liver injury [28,30]. Interestingly, in this study, the level of ferritin was about twice as high in the Alcohol group compared with the Non-alcohol group. Elevated serum ferri- tin levels independently predicted incident type 2 diabetes in prospective studies in apparently healthy men and wom- en [14]. In cross-sectional studies, increased ferritin levels have been associated with hypertension [24], dyslipidemia [37], elevated fasting insulin and blood glucose [29], and cen- tral adiposity [10]. Jehn et al. [14] reported that elevated iron stores were positively associated with the prevalence of the metabolic syndrome and insulin resistance.
Other has suggested that iron may catalyze the formation of hydroxyl radicals, which contribute to the development of insulin resistance [40].
Iron deposition in pancreatic β-cells may also impair in- sulin secretion in more advanced states of iron overload [38].
Ferritin is an acute-phase reactant and may reflect in- flammatory activity. Our data also represented that the Alcohol group with higher ferritin level had higher glucose, total and LDL-cholesterol, and triglyceride, suggesting meta- bolic syndrome. This finding suggests that elevated ferritin may relate to the development of adult diseases including hypertension. Many studies have indicated a link between abnormal iron storage and the development of athero- sclerotic coronary artery disease (CAD) [6,31]. As mentioned above, iron donates electrons to promote the formation of reactive oxygen species (ROS) such as the hydroxyl radical
(.OH) from H2O2 via the Fenton reaction. Excessive iron in tissues may catalyze the formation of highly reactive forms of oxygen free radicals. Unstable free radicals such as the .OH, singlet oxygen or H2O2 can cause oxidation of LDL, which is a trigger for the development of athero- sclerotic CAD [26]. Moreover, recent studies have reported association between ferritin and C-reactive protein (CRP) [25]. CRP is a risk factor for future cardiac events even in healthy individuals [19]. Though its level is within normal range, the Alcohol group had apparently higher LDL and ferritin levels, indicating that the Alcohol group may have a high possibility of formation of free radical and oxidation.
In conclusion, individuals with alcoholic fatty liver may have higher serum iron, cardiac, and biochemical indices,
suggesting that they may have potential of exposure to adult disease or metabolic syndrome such as obesity, hyper- tension, liver disease, diabetes, cardiovascular disease, or hy- perlipidemia compared with them having non-alcoholic fat- ty liver.
References
1. Abe, H., Y. Kawano, S. Kojima, T. Ashida, M. Kuramochi, H. Matsuoka, and T. Omae. 1994. Biphasic effects of re- peated alcohol intake on 24-hour blood pressure in hyper- tensive patients. Circulation 89, 2626-2633.
2. Aisen, P., M. Wessling-Resnick, and E. A. Leibold. Iron metabolism. 1999. Curr. Opin. Chem. Biol. 3, 200-206.
3. Andrews, N. C. 1999. Disorders of iron metabolism. N. Engl.
J. Med. 341, 1986-1995.
4. Bau, P. F. D., C. H. D. Bau, A. A. Naujorks, and G. A. Rosito.
2005. Early and late effects of alcohol ingestion on blood pressure and endothelial function. Alcohol 37, 53-58.
5. Choudhury, S. R., H. Ueshima, Y. Kita, K. M. Kobayashi, A. Okayama, M. Yamakawa, Y. Hirao, M. Ishikawa, and Y. Miyoshi. 1994. Alcohol intake and serum lipids in a Japanese population. Int. J. Epidemiol. 23, 940-947.
6. Day, S. M., D. Duquaine, L. V. Mundada, R. G. Menon, B. V. Khan, and S. Rajagopalan. 2003. Chronic iron admin- istration increase vascular oxidative stress and accelerates arterial thrombosis. Circulation 107, 2601-2606.
7. Duane, P., K .B. Raja, R. J. Simpson, and T. J. Peters. 1992.
Intestinal iron absorption in chronic alcoholics. Alcohol &
Alcohol 27, 281-289.
8. Fazio, M., M. Bardelli, B. Fabris, L. Macaluso, F.
Fiammengo, F. Vran, M. Bossi, R. Candido, R. Gerloni, and R. Carretta. 2004. Large artery hemodynamics after acute alcohol administration in young, healthy volunteers.
Angiology 55, 139-145.
9. Ganz, T. 2004. Hepcidin in iron metabolism. Curr. Opin.
Hematol. 11, 251-254.
10. Gillum, R. F. 2001. Association of serum ferritin and indices of body fat distribution and obesity in Mexican American men: the third national health and nutrition examination survey. Int. J. Obes. Relat. Metab. Disord. 25, 639-645.
11. Happel, K. I. and S. Nelson. 2005. Alcohol, im- munosuppression and the lung. Proc. Am. Thorac. Soc. 5, 428-432.
12. Harrison-Findik, D. D., D. Schafer, E. Klein, and N. A.
Timchenko, H. Kulaksiz and D. Clemens. 2006. Alcohol me- tabolism-mediated oxidative stress down-regulates hepci- din transcription and leads to increased duodenal iron transporter expression. J. Biol. Chem. 281, 22974-22982.
13. Ioannou, G. N., J. A. Dominitz, N. S. Weiss, P. J. Heagerty, and K. V. Kowdley. 2004. The effect of alcohol consumption on the prevalence of iron overload, iron deficiency, and iron deficiency anemia. Gastroenterology 126, 1293-1301.
14. Jehn, M., J. M. Clark, and E. Huallar. 2004. Serum ferritin
and risk of the metabolic syndrome in U.S. adults. Diabetes Care 27, 2422-2428.
15. Jiang, R., J. E. Manson, J. B. Meigs, J. Ma, N. Rifai, and F. B. Hu. 2004. Body Iron stores in relation to risk of type 2 diabetes in apparently healthy women. JAMA 291, 711-717.
16. Kawano, Y., H. Abe, S. Kojima, S. Takishita, and H.
Matsuoka. 2004. Effects of repeated alcohol intake on blood pressure and sodium balance in Japanese males with hypertension. Hypertens. Res. 27, 167-172.
17. Knutson, M. and M. Wessling-Resnick. 2003. Iron metabo- lism in the reticuloendothelial system. Crit. Rev. Biochem.
Mol. Biol. 38, 61-88.
18. Lee, D. H., D. R. Jacobs, and M. Gross M. 2003. Gamma glutamyltransgerase is a predictor of incident diabetes and hypertension Cardia. Study Clini. Chem. 49, 1358-1366.
19. Luc, G, J., M. Bard, I. Juhan-vague, J. Ferrieres, A. Evans, and P. Amouyel. 2003. PPIME Study Group, C-reactive pro- tein, interleukin-6 and fibrinogen as predictors of coronary heart disease: the PRIME study. Arterioscler. Thrombo. Avsc.
Bia.l. 23, 1255-1261.
20. McFadden, C. B., C. M. Brensinger, J. A. Berlin, and R. R.
Townsed. 2005. Systematic review of the effects of daily al- cohol intake on blood pressure. Am. J. Hypertens. 18, 276-286.
21. Mukamal, K. J., H. Chung, N. S. Jenny, L. H. Kuller, W.
T. Longstreth, M. A. Mittleman, G. L. Buke, M. Cushman, N. J. Beauchamp, and D. S. Beauchamp. 2008. Alcohol use and risk of ischemic stroke among oler adults the car- diovascular health study. Alcohol and Ischemic Stroke 10, 1830-1834..
22. Nicolas, G., L. Viatte, M. Bennoun, C. Beaumont, A. Kahn, and S. Vaulont. 2002. Hepcidin, a new iron regulatory peptide. Blood Cells Mol. Dis. 29, 327-335.
23. Onat, A., G. Hergenc, D. Duesunoglu, S. Ordu, G. Can, S.
Bulur, and H. Yuksel. 2008. Associations of alcohol con- sumption with blood pressure, lipoproteins, and subclinical inflammation among turks. Alcohol 42, 593-601.
24. Piperno, A., P. Trombini, M. Gelosa, V. Mauri, V. Pecci V, and A. Vergani. 2002. Increased serum ferritin is common in men with essential hypertension. J. Hypertens. 20, 1513-1518.
25. Roselle, G., C. L. Mendenhall, and C. J. Grossman. Effects of alcohol on immunity and cancer. In Alcohol, Immunity and Cancer. Yirmiya, R. and A. N. Taylor (eds.), pp. 3-21.
RC Press, Boca Raton, FL.
26. Ryan, T. P. and S. D. Aust. 1992. The role of iron in oxy- gen-mediated toxicities. Crit. Rev. Toxicol. 22, 119-141.
27. Tawakol, A., T. Omland, and M. A. Creager. 2004. Direct effect of ethanol on human vascular function. Am. J. Physiol.
Heart Circ. Physiol. 286, 2468-2473.
28. Tsukamoto, H. and S. C. Lu. 2001. Current concepts in the
pathogenesis of alcoholic liver injury. F.A.S.E.B. J. 15, 1335-1349.
29. Tuomainen, T. P., K. Nyyssonene, R. Salonen, A.
Tervahauta, H. Korpela, and T. Lakka. 1997. Body iron stores are associated with serum insulin and blood glucose concentrations: population study in 1013 eastern finnish men. Diabetes Care 20, 426-428.
30. Valerio, L. G. T. Jr, Parks and D. R. Petersen. 1996. alcohol mediates increases in hepatic and serum nonheme iron stores in a rat model for alcohol-induced liver injury. Alcohol Clin. Exp. Res. 20, 1352-1361.
31. van Hallest, P. L., D. J. J. van, F. W. Asselbers, R. A. M.
van, N. J. Veeger, and M. M. Hennenman. 2003. Correlates of endothelial function and their relationship with in- flammation in patients with familial hypercholesterolaemia.
Clin. Sci. Lond. 104, 627-632.
32. Volcik, K. A., C. M. Ballantine, F. D. Fuchs, A. R. Sharrett, and E. Boerwinkle. 2008. Relationship of alcohol con- sumption and type of alcohol beverage consumed with plasma lipid levels: differences between Whites and African Americans of the ARIC study. Ann. Epidemiol. 18, 101-107.
33. Wakabayashi, I. 2008. Association of alcohol drinking and cigarette smoking with serum lipid levels in healthy mid- dle-aged men. Alcohol & Alcoholism 43, 274-280.
34. Wannamethee, G. and A. G. Shaper. 1992. Blood: the rela- tionship with alcohol intake, smoking, and body weight.
J. Epidemiol. Comm. 146, 197-202.
35. Wannamethee, S. G, G. D. O. Lowe, G. Shaper, P. H.
Whincup, A. Rumlry, M. Waker, and L. Lennon. 2003. The effects of different alcohol drinks on lipids , insulin and haemostatic and inflammatory markers in older men.
Thromb. Haemost. 90, 1080-1087.
36. Whitfield, J. B., G. Zhu, A. C. Heath, L. W. Powell And, and N. G. Martin. 2001. Effects of alcohol consumption on indices of iron stores and of iron stores on alcohol intake markers. Alcohol. Clin. Exp. Res. 25, 1037-1045.
37. Williams, M. J. A., R. Poulton, and S. Williams. 2002.
Relationship of serum ferritin with cardiovascular risk fac- tors and inflammation in young men and women.
Atherosclerosis 165, 179-184.
38. Wilson, J. G., J. H. Lindquist, S. C. Grambow, E. D. Crook, and J. F. Maher. 2003. Potential role of increased iron stores in diabetes. Am. J. Med. Sci. 325, 332-339.
39. Winterbourn, C. C. 1995. Toxicity iron and hydrogen per- oxide: the Fenton reaction. Toxico. Lett. 82, 969-974.
40. Wolff, S. P. 1993. Diabetes millitus and free radicals: free radicals, transitional metals and oxidative stress in the aeti- ology of diabetes millitus and complications. Br. Med. Bull.
49, 642-652
41. Zilkens, R. R., V. Burke, J. M. Hodgson, A. Barden, and L. J. Beilin. 2005. Red wine and beer elevate blood pressure in normotensive men. Hypertension 45, 874-879.
초록:알코올성 지방간과 비알코올성 지방간 성인에 있어 혈청 철 표지자, 심장 표지자, 생화학적 표지 자의 차이
김철유․문성민1․현경예1․김대식2․최석철3*
(양산시 웅상보건지소, 1인제대학교 식의학생명공학대학 임상병리학과, 2동남보건대학 임상병리과, 3부산가
톨릭대학교 보건과학대학 임상병리학과)
비록 음주가 간손상을 일으키는 지방간의 원인이 되긴 하나 다른 인자들 역시 지방간의 원인이 된다. 우리는 알코올성 지방간(알코올군) 및 비알코올성 지방간 남성(비알코올군)에 있어 철 표지자, 심장표지자, 그리고 생화 학적 표지자의 변화와 차이를 연구하였다. 알코올군이 비알코올군 보다 신체지수, 수축기 및 확장기 혈압, 좌우 안압이 유의하게 더 높았다. 또한 혈색소 농도, 적혈구 용적률, 평균 적혈구 혈색소량, 평균 적혈구혈색소 농도, 단구 수 역시 알코올군이 비알코올군 보다 유의하게 더 높았다. 생화학적 지수인 alanine aminotransferase, γ- glutamyltranspeptidase, 총콜레스테롤, 중성지방, 저밀도콜레스테롤, 혈당, 크레아티닌, 요산 등도 알코올군이 비 알코올군 보다 유의하게 높았고, 철 지수인 철, 총철결합능, 페리틴 농도 역시 알코올군이 의미있게 더 높았다.
이러한 결과들은 장기적인 알코올 기인성 지방간이 비음주 지방간에 비해 혈청 철농도, 심혈관 표지자, 그리고 생화학적 표지자들을 더 상승시키며, 이는 심혈관 질환 및 대사성 증후군과 같은 성인병에 노출될 가능성이 보다 높을 수 있음을 시사하고 있다.