Non‑alcoholic fatty liver disease
in polycystic ovary syndrome
women
Young Bin Won
1,2, Seok Kyo Seo
1,2, Bo Hyon Yun
1,2*, SiHyun Cho
2,3, Young Sik Choi
1,2&
Byung Seok Lee
1To evaluate risk factors leading to non‑alcoholic fatty liver disease (NAFLD) occurrence in polycystic ovarian syndrome (PCOS) women. A retrospective cohort study of a total of 586 women diagnosed with PCOS aged 13–35 years at the gynecology department at a university hospital was done to evaluate PCOS phenotype, metabolic syndrome (MetS) diagnosis, body composition, insulin sensitivity, sex hormones, lipid profile, liver function, and transient elastography (TE). In PCOS women with NAFLD compared to those without, MetS diagnosis (Hazard ratio [HR] 5.6, 95% Confidence interval [CI] 2.2–14.4, p < 0.01) and hyperandrogenism (HA) (HR 4.4, 95% CI 1.4–13.4,
p = 0.01) were risk factors significantly associated with subsequent NAFLD occurrence, whereas 2‑h
insulin level in 75 g glucose tolerance test (GTT) (HR 1.2, 95% CI 0.5–2.5, p = 0.70) and body mass index (BMI) > 25 kg/m2 (HR 2.2, 95% CI 0.6–8.0, p = 0.24) was not. Among NAFLD patients who underwent TE, a higher number of MetS components indicated a worse degree of fibrosis and steatosis. MetS diagnosis and HA at PCOS diagnosis were risk factors associated with NAFLD, while 2‑h insulin level in 75 g GTT and obesity were not. Although elevated aspartate aminotransferase levels were significant for NAFLD risk, liver enzyme elevations may not be present until late liver damage. Further prospective studies of PCOS women with MetS or HA are warranted to determine whether patients without liver enzyme elevations should undergo preemptive liver examinations.
Polycystic ovary syndrome (PCOS) is a common endocrine disorder in reproductive age women and is char-acterized by irregular menstruation, clinical or biochemical hyperandrogenism (HA), and polycystic ovarian morphology on ultrasonography1–3. It is an endocrine disorder whose association with metabolic problems is
notable. There are numerous studies that demonstrate the relationship with type II diabetes mellitus (DM) and metabolic syndrome with PCOS4,5. In particular, the increase in insulin resistance promotes androgen production
in ovarian theca cells leading to aggravation of HA6,7. Metabolic disturbances such as DM and obesity threaten
the health of PCOS women and preventing this at an early stage is crucial from a public healthcare standpoint. Metabolic disturbances in the relatively young reproductive age women may also result in complications during pregnancy and delivery8. Being exposed to the hyperandrogenic environment of PCOS for a longer time could
in effect be associated with a higher chance of metabolic complications later on.
Non-alcoholic fatty liver disease (NAFLD) encompasses an extensive range of liver diseases, including liver steatosis, non-alcoholic steatohepatitis, liver fibrosis, and liver cirrhosis, which may develop into liver failure and even hepatocellular carcinoma9. Androgens such as testosterone, dihydrotestosterone, and
dehydroepiandros-terone (DHEA) are recognized as pro-apoptotic agents that act on peripheral cells such as hepatocytes10. The
overproduction of these androgens promotes an androgen-dependent pro-apoptotic PCOS environment that may directly contribute to liver disease progression. The emphasis between the risk factors leading to NAFLD such as insulin resistance, central obesity, hypertension, and dyslipidemia and their involvement with PCOS is being highlighted in recent times6. Studies investigating the relationship between NAFLD and PCOS have
revealed that NAFLD was more prevalent in girls with PCOS than in those without, with a prevalence of 36% up to a high of 70% PCOS patients with concurring NAFLD11–15.
Although the association of PCOS and NAFLD has been presented in several studies, their pathophysiology and risk factors are not clear16–19. It is unclear which features of PCOS increase the risk of NAFLD, particularly
OPEN
1Department of Obstetrics and Gynecology, Severance Hospital, Yonsei University College of Medicine, 50
Yonsei-ro, Seodaemun-gu, Seoul 03722, Republic of Korea. 2Institute of Women’s Life Science, Yonsei University
College of Medicine, Seoul, Korea. 3Department of Obstetrics and Gynecology, Gangnam Severance Hospital,
if the risk of NAFLD is higher in all PCOS patients. Thus, this study was conducted to evaluate risk factors asso-ciated with NAFLD occurrence to determine better identifiers in screening for metabolic abnormalities at the time of PCOS diagnosis and consider its underlying cause.
Materials and methods
Study population.
In this retrospective cohort study, 586 women diagnosed with PCOS aged 13–35 years from January 2010 to April 2018 at the Department of Obstetrics and Gynecology in Severance Hospital, Seoul, Korea, were evaluated. Patients were included if they were diagnosed with PCOS. PCOS for adults was defined according to the 2003 Rotterdam ESHRE/ASRM-sponsored PCOS consensus workshop criteria1 as endorsedby the most recent international evidence-based guideline20. In adolescents, PCOS was defined according to the
diagnosis criteria suggested by Androgen excess and PCOS society in 20093, which specified oligomenorrhea
and HA as a prerequisite for PCOS diagnosis21. Adolescent was defined as those aged between 10 to 19 years
old, and adult was defined as those above 20 years old22. NAFLD was defined as simple fatty liver, nonalcoholic
steatohepatitis, and/or liver fibrosis23 after excluding other—viral, alcoholic, iatrogenic by medication—causes
of liver diseases.
Patients were excluded from the analysis if they had any of following exclusion criteria: other causes of irregu-lar menstrual cycles or androgen excess including hyperprolactinemia, uncontrolled thyroid disease, congenital adrenal hyperplasia, Cushing’s disease, androgen secreting tumor, or pregnancy; who were diagnosed with PCOS at a department apart from the Department of Obstetrics and Gynecology; anyone with health conditions that could influence liver function; a history of hormonal contraception or metformin use within 3 months preced-ing the diagnosis of PCOS or NAFLD; and those with inadequate data or no follow-up (Fig. 1). Unfortunately, patients diagnosed with PCOS at another department usually did not undergo gynecologic ultrasound or other studies regarding this diagnosis and bias from this exclusion was unavoidable.
Measures.
Demographic and physical characteristics such as age, body mass index (BMI), hypertension diagnosis, NAFLD diagnosis, MetS diagnosis, and PCOS phenotype were investigated. Laboratory examina-tion results including aspartate aminotransferase (AST, reference: normal ≤ 43 U/L), alanine aminotransferase (ALT, reference: normal ≤ 45 U/L), total cholesterol, triglyceride, high-density lipoprotein (HDL), low-density lipoprotein (LDL), dehydroepiandrosterone sulfate (DHEA-S), total testosterone, sex hormone binding globu-lin (SHBG), and anti-Mullerian hormone (AMH) levels; 75 g oral glucose tolerance test (fasting and 2-h glu-cose and insulin); homeostasis model assessment of insulin resistance (HOMA-IR); fasting gluglu-cose insulin ratio (FGIR); and free androgen index (FAI) were examined. The standard values were determined by the laboratory references of our institution.The 75 g oral glucose tolerance testing (GTT) was routinely performed in all patients diagnosed with PCOS to evaluate insulin resistance. HOMA-IR was calculated as [fasting glucose (mg/dL) × basal insulin (µUI/mL)]/405. Patients were considered to have MetS if ≥ 3 of the following criteria, based on the criteria presented by the National Cholesterol Education Program/Adult Treatment Panel III (NCEP/ATP III) and adapted for patients with PCOS by the 2003 Rotterdam ESHRE/ASRM-sponsored PCOS consensus workshop, were satisfied: (1) abdominal obesity as waist circumference of > 88 cm, (2) elevated triglyceride level of ≥ 150 mg/dL, (3) low HDL cholesterol level of < 50 mg/dL, (4) elevated blood pressure of ≥ 130/ ≥ 85 mmHg, and (5) impaired fasting glucose level of 110–126 mg/dL and/or 2-h postprandial glucose level of 140–199 mg/dL1. Regrettably, because
waist circumference was not routinely checked in our study, BMI was used as an alternative24. The cut-off for
obesity in an Asian population was defined as BMI of ≥ 25 kg/m225. Those with BMI ≤ 20 kg/m2 was defined as Figure 1. Flow chart of patient inclusion.
lean, 20 < BMI < 25 kg/m2 as normal, BMI ≥ 25 kg/m2 as obese. Diagnosis of NAFLD was made by hepatologist:
after referral if indicated by an abnormal AST or ALT level or incidentally found during other evaluation-for example, computed tomography or abdominal sonography performed at emergency room or health check-up. NAFLD was diagnosed using at least 2 non-invasive screening methods such as abdominal sonography, transient elastography (TE; FibroScan, Echosens, Paris, France), and magnetic resonance imaging26. Controlled
attenu-ation parameter was used as a parameter for liver steatosis in those undergone TE. TE showed liver stiffness measurements for fibrosis in stage 0 < 5.5 kPa, stage 1 5.5–7.4 kPa, stage 2 7.5–9.4 kPa, stage 3 9.5–10.9 kPa, and stage 4 > 11 kPa. The parameters for liver steatosis was stage 0 < 238 dB/m, stage 1 238–259 dB/m, stage 2 260–292 dB/m, and stage 3 > 293 dB/m.
Statistical analysis.
All statistical analyses were performed using SPSS ver. 23 (SPSS Inc., Chicago, IL, USA). Baseline patient characteristic data were analyzed using Student’s t-test or chi-squared test. Continuous variables are presented as mean (standard deviation), and categorical variables are presented as numbers (per-centage). Cox regression analysis was performed to determine risk factors according to the diagnosis of NAFLD. Univariate analysis was performed to assess the relationship between each variable and NAFLD. Data were cor-rected through multivariate analysis. A p value of < 0.05 was considered statistically significant.Ethics approval.
This study was approved by the Yonsei University Health System, Severance Hospital’s Institutional Review Board (4-2018-0786). All procedures performed in the study were done in accordance with the ethical standards of the institutional review board and with the 1964 Helsinki declaration and its later amendments, or comparable ethical standards. Informed consent was exempted by the Institutional Review Board for it’s nature of retrospective study.Results
NAFLD occurrence and PCOS patient characteristics.
Of the 1528 women diagnosed with PCOS during the study duration, 586 were finally included. 12 adolescents (11.8%) and 39 adults (8.1%) were diagnosed with NAFLD (total 51 patients, 8.7%) during their follow up. All data results were obtained when the diagnosis of PCOS was made, exception of liver sonography and TE results, which were obtained during NAFLD diagno-sis. TE was performed in only 28 patients, all of whom presented with elevated AST/ALT levels. The remaining 23 patients diagnosed with NAFLD underwent abdominal ultrasonography, which is the gold standard for non-invasive diagnosis of NAFLD. 1 patient who underwent abdominal ultrasonography additionally received MRI for confirmation. The average follow-up period for the total PCOS population was 36.8 months. The median follow-up length of NAFLD patients was 37 (range 0–143) months and that for non-NAFLD patients was 26 (range 0–118) months. 17 patients (total 51 patients with NAFLD, 33.3%) were diagnosed with NAFLD before the diagnosis of PCOS was made. Excluding these patients, an average of 15.1 months elapsed from the point of PCOS diagnosis to the occurrence of NAFLD.Characteristics of NAFLD occurrence in PCOS patients.
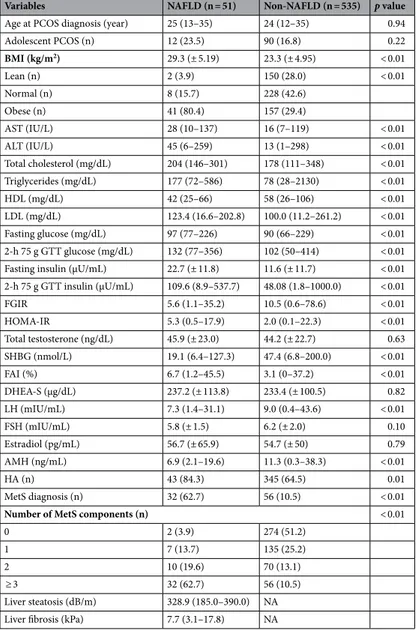
Baseline characteristics comparing PCOS women with and without NAFLD are shown in Table 1. MetS diagnosis rate was significantly higher in women with NAFLD than in those without NAFLD. AST and ALT level elevation was also significantly correlated with NAFLD. Indices reflecting insulin resistance including 2-h 75 g GTT insulin, FGIR, HOMA-IR were markedly higher in NAFLD group. Of the 51 NAFLD patients, 43 (84.3%) had HA as opposed to 345 of 535 patients (64.5%) without NAFLD, which was significant (p = 0.01). Total testosterone and DHEA-S levels were not sta-tistically significant. Mean BMI of our study population was 23.83 kg/m2, showing higher proportion ofnon-obese PCOS patients (n = 387, 66%) compared to non-obese PCOS patients (n = 199, 34%) with significant difference (p < 0.001). Proportion of obese PCOS was significantly higher in NAFLD compared to the non-NAFLD group (p < 0.001).
Baseline characteristics according to the age of PCOS diagnosis.
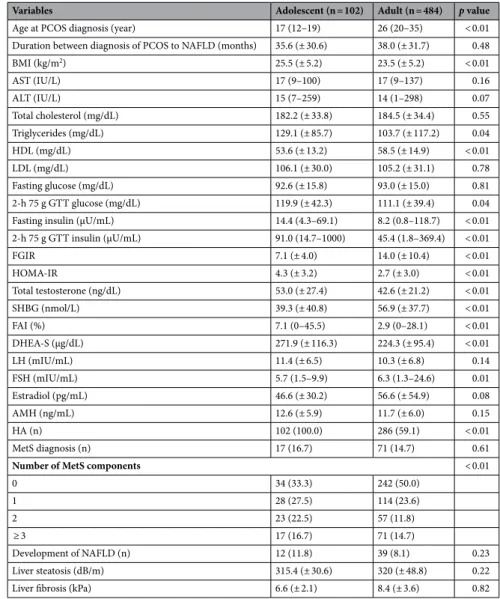
Comparing adolescent and adult PCOS patients (Table 2), BMI was significantly higher in adolescents than in adults. Lipid profile was in the nor-mal range for both groups. Indices reflecting insulin resistance seemed to be higher in the adolescent group. 2-h 75 g GTT insulin was more elevated in adolescents. HOMA-IR was 4.3 in adolescents and 2.7 in adults (p < 0.01). Establishing insulin resistance as HOMA-IR > 3.16 for adolescents27 or > 2.5 for adults28,29 and 2-h 75 g GTTinsulin > 41 μU/mL30, both parameters showed a greater insulin resistance in adolescents compared to adults.
FGIR showed conflicting results with 14.0 in adults which was higher than the 7.1 for adolescents (p < 0.01), with FGIR < 7 as abnormal for adolescents31 and < 4.5 as abnormal for adults32. Both were not indicative of insulin
resistance, although it was borderline for adolescents. The duration of time that lapsed after PCOS diagnosis to NAFLD diagnosis in adolescents compared to adults was not significant (35.6 months vs. 38.0 months, p = 0.48).
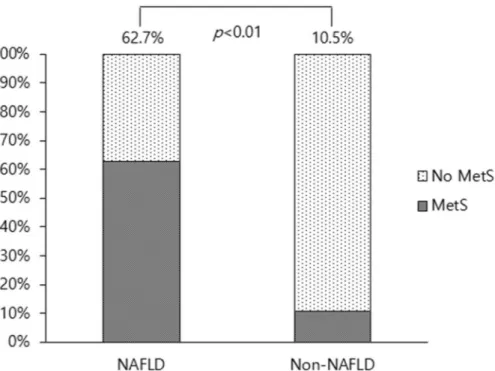
Relationship between MetS diagnosis and liver steatosis.
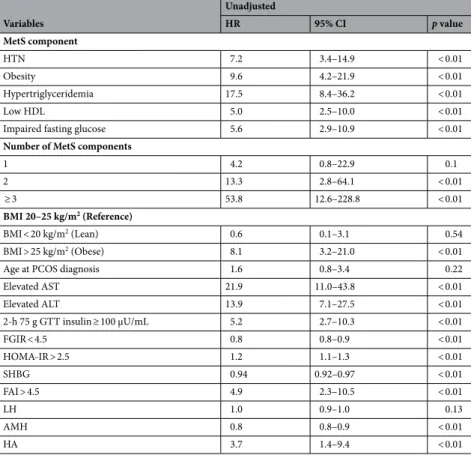
MetS diagnosis at the time of PCOS diag-nosis was 62.7% in NAFLD patients and 10.5% in non-NAFLD patients (p < 0.01, Fig. 2). The proportion of NAFLD patients increased as the number of MetS components increased, which was not true for non-NAFLD patients (Table 1). Among NAFLD patients who underwent TE, the greater the number of MetS components, the worse was the degree of fibrosis and steatosis (Fig. 3). The mean stiffness scores on liver fibroscan were 328.9 dB/m, which suggests severe liver steatosis, and 7.7 kPa, which suggests significant liver fibrosis (Table 1).Univariate cox analysis was performed for risk factors associated with NAFLD occurrence in our PCOS popu-lation (Table 3). It showed that all MetS components; hypertension, obesity, hypertriglyceridemia, low HDL level,
and impaired fasting glucose level, were statistically significant. As the number of MetS components increased from 1 to ≥ 3, the hazard ratio (HR) also increased from 4.2 to 53.8. Elevated AST and ALT levels were both linked to NAFLD. Insulin resistance, portrayed as 2-h 75 g GTT insulin ≥ 100 μU/mL, FGIR < 4.5, and HOMA-IR > 2.5 were all statistically significant. HA was significant, while age at PCOS diagnosis was not. Obesity, specified as BMI > 25, compared to the normal was significant compared to lean group which was not significant.
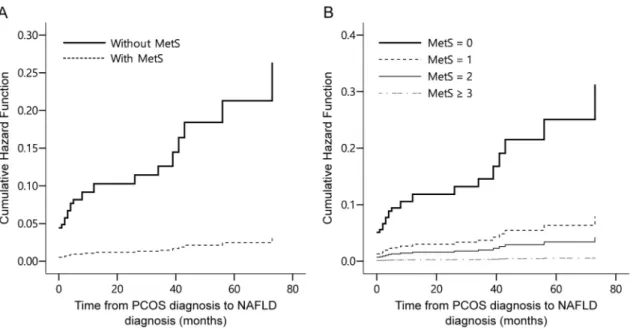
Multivariate cox analyses of variables associated with NAFLD were presented in two models (Table 4). The first model was according to MetS diagnosis, and the second model was according to the number of MetS com-ponents, which was not significant for a single component, but was significant for ≥ 3 components. AST level was significant in both models, while ALT level was not. Insulin resistance, represented as 2-h 75 g GTT insulin ≥ 100 μU/mL, was not significant in both models. Significance of HA also concurred in both models. BMI, both lean and obese groups were not significant compared to a reference BMI of 20–25 in both models. COX regression analysis of time from NAFLD diagnosis following PCOS diagnosis in months is shown in Fig. 4. The cumulative hazard function of NAFLD diagnosis following PCOS diagnosis was significantly higher when patients were diag-nosed with MetS (Fig. 4a). It was also sequentially higher as the number of MetS components increased (Fig. 4b).
Table 1. Baseline characteristics of PCOS women according to subsequent NAFLD occurrence. Values
are shown as median (minimum–maximum), mean (± standard deviation), or number (%). ALT alanine aminotransferase, AMH anti-Müllerian hormone, AST aspartate transaminase, BMI body mass index, DHEA-S dehydroepiandrosterone sulfate, FGIR fasting glucose insulin ratio, FSH follicle stimulating hormone, GTT glucose tolerance test, HA hyperandrogenism, HDL high-density lipoprotein, HOMA-IR homeostasis model assessment of insulin resistance, LDL low-density lipoprotein, LH luteinizing hormone, MetS metabolic syndrome, PCOS polycystic ovary syndrome, SHBG sex hormone binding globulin.
Variables NAFLD (n = 51) Non-NAFLD (n = 535) p value
Age at PCOS diagnosis (year) 25 (13–35) 24 (12–35) 0.94
Adolescent PCOS (n) 12 (23.5) 90 (16.8) 0.22 BMI (kg/m2) 29.3 (± 5.19) 23.3 (± 4.95) < 0.01 Lean (n) 2 (3.9) 150 (28.0) < 0.01 Normal (n) 8 (15.7) 228 (42.6) Obese (n) 41 (80.4) 157 (29.4) AST (IU/L) 28 (10–137) 16 (7–119) < 0.01 ALT (IU/L) 45 (6–259) 13 (1–298) < 0.01 Total cholesterol (mg/dL) 204 (146–301) 178 (111–348) < 0.01 Triglycerides (mg/dL) 177 (72–586) 78 (28–2130) < 0.01 HDL (mg/dL) 42 (25–66) 58 (26–106) < 0.01 LDL (mg/dL) 123.4 (16.6–202.8) 100.0 (11.2–261.2) < 0.01 Fasting glucose (mg/dL) 97 (77–226) 90 (66–229) < 0.01 2-h 75 g GTT glucose (mg/dL) 132 (77–356) 102 (50–414) < 0.01
Fasting insulin (μU/mL) 22.7 (± 11.8) 11.6 (± 11.7) < 0.01
2-h 75 g GTT insulin (μU/mL) 109.6 (8.9–537.7) 48.08 (1.8–1000.0) < 0.01 FGIR 5.6 (1.1–35.2) 10.5 (0.6–78.6) < 0.01 HOMA-IR 5.3 (0.5–17.9) 2.0 (0.1–22.3) < 0.01 Total testosterone (ng/dL) 45.9 (± 23.0) 44.2 (± 22.7) 0.63 SHBG (nmol/L) 19.1 (6.4–127.3) 47.4 (6.8–200.0) < 0.01 FAI (%) 6.7 (1.2–45.5) 3.1 (0–37.2) < 0.01 DHEA-S (μg/dL) 237.2 (± 113.8) 233.4 (± 100.5) 0.82 LH (mIU/mL) 7.3 (1.4–31.1) 9.0 (0.4–43.6) < 0.01 FSH (mIU/mL) 5.8 (± 1.5) 6.2 (± 2.0) 0.10 Estradiol (pg/mL) 56.7 (± 65.9) 54.7 (± 50) 0.79 AMH (ng/mL) 6.9 (2.1–19.6) 11.3 (0.3–38.3) < 0.01 HA (n) 43 (84.3) 345 (64.5) 0.01 MetS diagnosis (n) 32 (62.7) 56 (10.5) < 0.01
Number of MetS components (n) < 0.01
0 2 (3.9) 274 (51.2)
1 7 (13.7) 135 (25.2)
2 10 (19.6) 70 (13.1)
≥ 3 32 (62.7) 56 (10.5)
Liver steatosis (dB/m) 328.9 (185.0–390.0) NA
Relationship between MetS diagnosis and liver steatosis according to age.
Additional multivar-iate cox analyses of variables assocmultivar-iated with NAFLD was done according to age at PCOS diagnosis (Table 5). The cox models showed that MetS diagnosis was a significant factor in consequent NAFLD development for adults, but not in adolescents. For elevated AST and ALT, there was contrasting results for the adolescent and adult group. In adolescents, both elevated AST and ALT was significant. In adults, only elevated AST was significant. 2-h 75 g GTT insulin ≥ 100 μU/mL was not a significant variable associated with NAFLD in both adolescents and adults. HA was significant in the adult group. It was not checked in the adolescent group as 100% of patients had HA. BMI was not significant for both adolescents and adults.Discussion
Our study suggests that metabolic disturbances are intimately related to the pathophysiology and development of liver disease in women with PCOS. While the separate components of MetS were not critically connected to NAFLD, the greater the number of MetS components, the higher the prevalence of NAFLD diagnosis and more severe was the liver fibrosis and steatosis. In previous studies determining the relationship between NAFLD and MetS, features of metabolic disturbances were frequently detected in NAFLD, leading to the theory that NAFLD is the hepatic expression of MetS6. Even though MetS diagnosis and the number of MetS components showed
significant risk increase of developing NAFLD, obesity and insulin resistance itself did not turn out to be a direct
Table 2. Baseline characteristics according to the age of PCOS diagnosis. Values are shown as median
(minimum–maximum), mean (± standard deviation), or number (%). ALT alanine aminotransferase,
AMH anti-Müllerian hormone, AST aspartate transaminase, BMI body mass index, DHEA-S
dehydroepiandrosterone sulfate, FGIR fasting glucose insulin ratio, FSH follicle stimulating hormone, GTT glucose tolerance test, HA hyperandrogenism, HDL high-density lipoprotein, HOMA-IR homeostasis model assessment of insulin resistance, LDL low-density lipoprotein, LH luteinizing hormone, MetS metabolic syndrome, PCOS polycystic ovary syndrome, SHBG sex hormone binding globulin.
Variables Adolescent (n = 102) Adult (n = 484) p value
Age at PCOS diagnosis (year) 17 (12–19) 26 (20–35) < 0.01
Duration between diagnosis of PCOS to NAFLD (months) 35.6 (± 30.6) 38.0 (± 31.7) 0.48
BMI (kg/m2) 25.5 (± 5.2) 23.5 (± 5.2) < 0.01 AST (IU/L) 17 (9–100) 17 (9–137) 0.16 ALT (IU/L) 15 (7–259) 14 (1–298) 0.07 Total cholesterol (mg/dL) 182.2 (± 33.8) 184.5 (± 34.4) 0.55 Triglycerides (mg/dL) 129.1 (± 85.7) 103.7 (± 117.2) 0.04 HDL (mg/dL) 53.6 (± 13.2) 58.5 (± 14.9) < 0.01 LDL (mg/dL) 106.1 (± 30.0) 105.2 (± 31.1) 0.78 Fasting glucose (mg/dL) 92.6 (± 15.8) 93.0 (± 15.0) 0.81 2-h 75 g GTT glucose (mg/dL) 119.9 (± 42.3) 111.1 (± 39.4) 0.04
Fasting insulin (μU/mL) 14.4 (4.3–69.1) 8.2 (0.8–118.7) < 0.01
2-h 75 g GTT insulin (μU/mL) 91.0 (14.7–1000) 45.4 (1.8–369.4) < 0.01 FGIR 7.1 (± 4.0) 14.0 (± 10.4) < 0.01 HOMA-IR 4.3 (± 3.2) 2.7 (± 3.0) < 0.01 Total testosterone (ng/dL) 53.0 (± 27.4) 42.6 (± 21.2) < 0.01 SHBG (nmol/L) 39.3 (± 40.8) 56.9 (± 37.7) < 0.01 FAI (%) 7.1 (0–45.5) 2.9 (0–28.1) < 0.01 DHEA-S (μg/dL) 271.9 (± 116.3) 224.3 (± 95.4) < 0.01 LH (mIU/mL) 11.4 (± 6.5) 10.3 (± 6.8) 0.14 FSH (mIU/mL) 5.7 (1.5–9.9) 6.3 (1.3–24.6) 0.01 Estradiol (pg/mL) 46.6 (± 30.2) 56.6 (± 54.9) 0.08 AMH (ng/mL) 12.6 (± 5.9) 11.7 (± 6.0) 0.15 HA (n) 102 (100.0) 286 (59.1) < 0.01 MetS diagnosis (n) 17 (16.7) 71 (14.7) 0.61
Number of MetS components < 0.01
0 34 (33.3) 242 (50.0) 1 28 (27.5) 114 (23.6) 2 23 (22.5) 57 (11.8) ≥ 3 17 (16.7) 71 (14.7) Development of NAFLD (n) 12 (11.8) 39 (8.1) 0.23 Liver steatosis (dB/m) 315.4 (± 30.6) 320 (± 48.8) 0.22
risk factor in our results. Our cohort was composed of ethnically homogenous northeast Asian population with lean body mass33. Although obese cases were dominant in the NAFLD group compared to the non-NAFLD group,
still the BMI was relatively lower than other studies’ population25. Generally, PCOS and NAFLD are representative
metabolic diseases associated with insulin resistance6. The cut-offs of indices for insulin resistance and insulin
sensitivity are controversial, especially in the non-diabetic population5. In the current study, we included 2-h 75 g
GTT insulin, FGIR, and HOMA-IR. 2-h 75 g GTT insulin was the only index that may be applied commonly
Figure 2. Metabolic syndrome at the time of polycystic ovary syndrome (PCOS) diagnosis in non-alcoholic
fatty liver disease (NAFLD) and non-NAFLD Korean women.
Figure 3. Number of metabolic syndrome components at the time of polycystic ovary syndrome diagnosis and
in both adolescent and adult. Although traditional references suggest a cut-off of 100 μU/mL as grading severe insulin resistance, a few studies questioned whether ethnicity, race may affect insulin sensitivity and end organ response34. Therefore, our study presents similar results to suggest that MetS is associated with NAFLD in PCOS
women, rather than obesity itself, especially in the lean BMI population.
As HA was a prerequisite in diagnosing PCOS in adolescents as opposed to being one of three requirements in young adults, it could be the decisive factor associated with NAFLD in lieu of age. Previously, liver fat accumula-tion was associated with increasing age35. This was not found to be true in our investigation. Because NAFLD can
arise regardless of age, instead of waiting for outward manifestations of liver injury to present, identification of risk factors at the time of PCOS diagnosis can lead to preventative actions. We found that HA, independent of insulin resistance and obesity, was significantly associated with NAFLD occurrence in accordance with previous studies4,36. This was consistent with a meta-analysis which showed that HA, was an independent factor associated
with NAFLD in PCOS patients18.
In previous studies on women with PCOS, the prevalence of elevated liver enzyme levels was higher in women with PCOS than in controls13. The proportion of subjects with elevated ALT levels, which is more hepatocyte
spe-cific, was higher than that with elevated AST levels13,15. Interestingly, although both AST and ALT level elevations
were associated with NAFLD in our univariate analysis, only AST was significant in our multivariate analysis. Up to 80% of all NAFLD patients have normal range ALT levels and it also decreases as liver fibrosis progresses to liver cirrhosis37, so the results of our study may actually be on par with the progression of NAFLD. Although
elevated AST was significant in adolescents and elevated ALT was significant in adults, the actual serum AST/ ALT levels were not very divergent. The number of adolescent PCOS patients was very small, so this conflicting result may not have any clinical significance. Liver enzyme levels are not always elevated and can be normal in NAFLD patients38–41. Liver fat accumulation evaluation through TE or abdominal ultrasonography was not
done if there were no elevations in serum AST/ALT levels. Because this is not a defining feature of liver injury in patients with PCOS, patients presenting with MetS and HA should consider liver evaluation. Most current PCOS
Table 3. Univariate analysis of variables associated with NAFLD development in PCOS patients. The
categorical variables were MetS component (reference: none), number of MetS components (reference: number 0), Age at PCOS diagnosis (reference: adolescent), Elevated AST (reference: normal AST level at PCOS diagnosis), Elevated ALT (reference: normal ALT level at PCOS diagnosis), 2-h 75 g GTT insulin (reference: < 100 µU/mL), FAI (reference < 4.5), HA (reference: none). ALT alanine aminotransferase, AMH anti-Müllerian hormone, AST aspartate transaminase, CI confidence interval, FAI free androgen index, FGIR fasting glucose insulin ratio, HA hyperandrogenism, HDL high-density lipoprotein, HOMA-IR homeostasis model assessment of insulin resistance, HR hazard ratio, HTN hypertension, GTT glucose tolerance test, LH luteinizing hormone, MetS metabolic syndrome, NAFLD non-alcoholic fatty liver disease, PCOS polycystic ovary syndrome, SHBG sex hormone binding globulin.
Variables Unadjusted HR 95% CI p value MetS component HTN 7.2 3.4–14.9 < 0.01 Obesity 9.6 4.2–21.9 < 0.01 Hypertriglyceridemia 17.5 8.4–36.2 < 0.01 Low HDL 5.0 2.5–10.0 < 0.01
Impaired fasting glucose 5.6 2.9–10.9 < 0.01
Number of MetS components
1 4.2 0.8–22.9 0.1 2 13.3 2.8–64.1 < 0.01 ≥ 3 53.8 12.6–228.8 < 0.01 BMI 20–25 kg/m2 (Reference) BMI < 20 kg/m2 (Lean) 0.6 0.1–3.1 0.54 BMI > 25 kg/m2 (Obese) 8.1 3.2–21.0 < 0.01
Age at PCOS diagnosis 1.6 0.8–3.4 0.22
Elevated AST 21.9 11.0–43.8 < 0.01 Elevated ALT 13.9 7.1–27.5 < 0.01 2-h 75 g GTT insulin ≥ 100 µU/mL 5.2 2.7–10.3 < 0.01 FGIR < 4.5 0.8 0.8–0.9 < 0.01 HOMA-IR > 2.5 1.2 1.1–1.3 < 0.01 SHBG 0.94 0.92–0.97 < 0.01 FAI > 4.5 4.9 2.3–10.5 < 0.01 LH 1.0 0.9–1.0 0.13 AMH 0.8 0.8–0.9 < 0.01 HA 3.7 1.4–9.4 < 0.01
Table 4. Multivariate analysis of variables associated with NAFLD. (a) Model 1: according to MetS diagnosis.
(b) Model 2: according to the number of MetS components. The categorical variables were MetS component (reference: none), number of MetS components (reference: number 0), Elevated AST (reference: normal AST level at PCOS diagnosis), Elevated ALT (reference: normal ALT level at PCOS diagnosis), 2-h 75 g GTT insulin (reference: < 100 µU/mL), HA (reference: none), BMI (reference: 20–25). ALT alanine aminotransferase,
AST aspartate transaminase, BMI body mass index, CI confidence interval, GTT glucose tolerance test, HA
hyperandrogenism, MetS metabolic syndrome, PCOS polycystic ovary syndrome, SHBG sex hormone binding globulin, NAFLD non-alcoholic fatty liver disease.
Variables HR 95% CI p value Model 1 MetS diagnosis 5.6 2.2–14.4 < 0.01 Elevated AST 8.5 2.8–25.6 < 0.01 Elevated ALT 1.4 0.5–4.3 0.52 2-h 75 g GTT insulin ≥ 100 µU/mL 1.2 0.5–2.5 0.70 HA 4.4 1.4–13.4 0.01 BMI 20–25 kg/m2 (Reference) BMI < 20 kg/m2 (Lean) 0.5 0.1–4.6 0.55 BMI > 25 kg/m2 (Obese) 2.2 0.6–8.0 0.24 Model 2
Number of MetS components
1 6.4 0.7–61.3 0.11 2 12.0 1.0–141.5 0.05 ≥ 3 50.8 4.5–576.7 < 0.01 Elevated AST 7.8 2.7–22.5 < 0.01 Elevated ALT 1.6 0.5–4.6 0.42 2-h 75 g GTT insulin ≥ 100 µU/mL 1.1 0.5–2.3 0.89 HA 4.2 1.4–13.0 0.01 BMI 20–25 kg/m2 (Reference) BMI < 20 kg/m2 (Lean) 0.7 0.1–6.5 0.75 BMI > 25 kg/m2 (Obese) 0.9 0.2–3.5 0.82
Figure 4. Cox regression analysis of non-alcoholic fatty liver disease diagnosis since polycystic ovary syndrome
diagnosis (a) according to metabolic syndrome (MetS) diagnosis and (b) according to the number of MetS components in Korean women.
guidelines do not recommend for the screening of NAFLD21,42, but the duration of time that lapsed between
the time of PCOS diagnosis to NAFLD diagnosis is approximately 3 years for both adolescents and adults. If adolescent PCOS patients are not routinely monitored, by the time the patient revisits a gynecologist to check up on their irregular menstruation, liver damage or other metabolic disturbances may have already progressed.
This study investigated NAFLD incidence in PCOS women and comprehensively examined all MetS com-ponents in relation to NAFLD. As liver biopsy was not performed in our study, the true prevalence of NAFLD and steatosis and fibrosis severity remain unknown. The limitations of this study stem from its retrospective design. Because not all patients had values available for all data items, the extent of potential relationships with NAFLD may have been diluted. A significantly higher number of adults were included in the study compared to adolescents, which could underestimate risk factors in the adolescent group. Except for incidentally found NAFLD, most of the patients were referred to the hepatology department for further examination due to liver enzyme abnormalities, and accordingly, there may have been selective bias in the diagnostic flow of NAFLD. Mild expressions of NAFLD without liver enzyme abnormality were not included, which contributes to the low prevalence of NAFLD in this study group. Waist circumference was not checked in most patients, so central obesity was not properly established. BMI was used as a substitute because studies published in Northeast Asian countries25,43,44 and even a large cross-sectional study of U.S. and Spanish populations45 showed BMI was
cor-related with metabolic impairment in lean PCOS patients. Further prospective studies of patients with MetS irregularities are warranted to determine whether patients without liver enzyme level elevations should undergo liver examinations.
In summary, our study results demonstrated that the diagnosis of MetS and HA were significant variables associated with NAFLD in women with PCOS. In light of the fact that MetS factors have a high correlation to NAFLD, patients presenting with metabolic disturbances at the time of PCOS diagnosis should be counseled to consider liver evaluation even if there are no outward manifestations of liver disease. Adding a cursory transabdominal ultrasound examination of the liver could be considered while doing a gynecologic ultrasound. PCOS manifests in women at reproductive age and evolves into metabolic problems with time. In the long run, NAFLD can have catastrophic liver-related mortalities if left untreated46. Earlier diagnosis can lead to more
timely treatment. Although previous studies have shown the association between HA and MetS with NAFLD, we demonstrated in our study that adolescent PCOS patients, all of whom had HA, were susceptible to NAFLD when compounded with the diagnosis of MetS. Regardless of the age at which PCOS diagnosis was made, comorbidities can lead to an increased metabolic risk; thus, systematized investigation of NAFLD may be helpful.
Received: 7 December 2020; Accepted: 18 March 2021
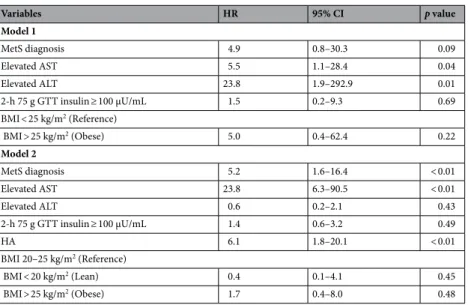
Table 5. Multivariate analysis of variables associated with NAFLD in adolescents and adults. (a) Model 1:
Adolescent group. (b) Model 2: Adult group. The categorical variables were MetS component (reference: none), number of MetS components (reference: number 0), Elevated AST (reference: normal AST level at PCOS diagnosis), Elevated ALT (reference: normal ALT level at PCOS diagnosis), 2-h 75 g GTT insulin (reference: < 100 µU/mL, HA (reference: none), BMI (reference: < 25 kg/m2 in model 1, reference 20–25 kg/m2
in model 2). ALT alanine aminotransferase, AST aspartate transaminase, CI confidence interval, GTT glucose tolerance test, HR hazard ratio, MetS metabolic syndrome, NAFLD non-alcoholic fatty liver disease, PCOS polycystic ovary syndrome, HA hyperandrogenism.
Variables HR 95% CI p value Model 1 MetS diagnosis 4.9 0.8–30.3 0.09 Elevated AST 5.5 1.1–28.4 0.04 Elevated ALT 23.8 1.9–292.9 0.01 2-h 75 g GTT insulin ≥ 100 µU/mL 1.5 0.2–9.3 0.69 BMI < 25 kg/m2 (Reference) BMI > 25 kg/m2 (Obese) 5.0 0.4–62.4 0.22 Model 2 MetS diagnosis 5.2 1.6–16.4 < 0.01 Elevated AST 23.8 6.3–90.5 < 0.01 Elevated ALT 0.6 0.2–2.1 0.43 2-h 75 g GTT insulin ≥ 100 µU/mL 1.4 0.6–3.2 0.49 HA 6.1 1.8–20.1 < 0.01 BMI 20–25 kg/m2 (Reference) BMI < 20 kg/m2 (Lean) 0.4 0.1–4.1 0.45 BMI > 25 kg/m2 (Obese) 1.7 0.4–8.0 0.48
References
1. Fr, D. D. & Tarlatzis, R. J. F. Revised 2003 consensus on diagnostic criteria and long-term health risks related to polycystic ovary syndrome. Fertil. Steril. 81, 19–25 (2004).
2. Goodarzi, M. O., Dumesic, D. A., Chazenbalk, G. & Azziz, R. Polycystic ovary syndrome: Etiology, pathogenesis and diagnosis. Nat. Rev. Endocrinol. 7, 219–231 (2011).
3. Azziz, R. et al. The androgen excess and PCOS Society criteria for the polycystic ovary syndrome: The complete task force report. Fertil. Steril. 91, 456–488 (2009).
4. Jones, H. et al. Polycystic ovary syndrome with hyperandrogenism is characterized by an increased risk of hepatic steatosis compared to nonhyperandrogenic PCOS phenotypes and healthy controls, independent of obesity and insulin resistance. J. Clin. Endocrinol. Metab. 97, 3709–3716 (2012).
5. Diamanti-Kandarakis, E. & Dunaif, A. Insulin resistance and the polycystic ovary syndrome revisited: An update on mechanisms and implications. Endocr. Rev. 33, 981–1030 (2012).
6. Baranova, A., Tran, T. P., Birerdinc, A. & Younossi, Z. M. Systematic review: Association of polycystic ovary syndrome with meta-bolic syndrome and non-alcoholic fatty liver disease. Aliment Pharmacol. Ther. 33, 801–814 (2011).
7. Rosenfield, R. L. & Ehrmann, D. A. The pathogenesis of polycystic ovary syndrome (PCOS): The hypothesis of PCOS as functional ovarian hyperandrogenism revisited. Endocr. Rev. 37, 467–520 (2016).
8. Grieger, J. A. et al. Metabolic syndrome in pregnancy and risk for adverse pregnancy outcomes: A prospective cohort of nulliparous women. PLoS Med. 15, e1002710 (2018).
9. Chalasani, N. et al. The diagnosis and management of nonalcoholic fatty liver disease: practice guidance from the American Association for the Study of Liver Diseases. Hepatalogy 67, 328–357 (2018).
10. Baranova, A. et al. Molecular signature of adipose tissue in patients with both non-alcoholic fatty liver disease (NAFLD) and polycystic ovarian syndrome (PCOS). J. Transl. Med. 11, 133 (2013).
11. Ayonrinde, O. T. et al. Adverse metabolic phenotype of adolescent girls with non-alcoholic fatty liver disease plus polycystic ovary syndrome compared with other girls and boys. J. Gastroenterol. Hepatol. 31, 980–987 (2016).
12. Vassilatou, E. et al. Increased androgen bioavailability is associated with non-alcoholic fatty liver disease in women with polycystic ovary syndrome. Hum. Reprod. 25, 212–220 (2010).
13. Schwimmer, J. B., Khorram, O., Chiu, V. & Schwimmer, W. B. Abnormal aminotransferase activity in women with polycystic ovary syndrome. Fertil. Steril. 83, 494–497 (2005).
14. Cerda, C. et al. Nonalcoholic fatty liver disease in women with polycystic ovary syndrome. J. Hepatol. 47, 412–417 (2007). 15. Lerchbaum, E. et al. Fatty liver index in polycystic ovary syndrome. Eur. J. Endocrinol. 165, 935–943 (2011).
16. Vassilatou, E. et al. Visceral adiposity index for the diagnosis of nonalcoholic fatty liver disease in premenopausal women with and without polycystic ovary syndrome. Maturitas 116, 1–7 (2018).
17. Minato, S. et al. Prevalence and risk factors of elevated liver enzymes in Japanese women with polycystic ovary syndrome. J. Clin. Med. Res. 10, 904–910 (2018).
18. Wu, J., Yao, X. Y., Shi, R. X., Liu, S. F. & Wang, X. Y. A potential link between polycystic ovary syndrome and non-alcoholic fatty liver disease: An update meta-analysis. Reprod. Health 15, 77 (2018).
19. Kumarendran, B. et al. Polycystic ovary syndrome, androgen excess, and the risk of nonalcoholic fatty liver disease in women: A longitudinal study based on a United Kingdom primary care database. PLoS Med. 15, e1002542 (2018).
20. Teede, H. J. et al. Recommendations from the international evidence-based guideline for the assessment and management of polycystic ovary syndrome. Hum. Reprod. 33, 1602–1618 (2018).
21. Ibáñez, L. et al. An international consortium update: pathophysiology, diagnosis, and treatment of polycystic ovarian syndrome in adolescence. Hormone Res. Paediatr. 88, 371–395 (2017).
22. Department of Child and Adolescent Health Development, W. H. O. Orientation Programme on Adolescent Health for Health Care Providers B5–B8 (World Health Organization, 2019).
23. Piazzolla, V. A. & Mangia, A. Noninvasive diagnosis of NAFLD and NASH. Cells 9, 1005 (2020).
24. Grundy, S. M., Brewer, H. B. Jr., Cleeman, J. I., Smith, S. C. Jr. & Lenfant, C. J. C. Definition of metabolic syndrome: Report of the National Heart. Lung Blood Inst. 109, 433–438 (2004).
25. WHO Expert Consultation. Appropriate body-mass index for Asian populations and its implications for policy and intervention strategies. Lancet 363, 157 (2004).
26. Festi, D. et al. Review article: The diagnosis of non-alcoholic fatty liver disease—Availability and accuracy of non-invasive methods. Aliment Pharmacol. Ther. 37, 392–400 (2013).
27. Keskin, M., Kurtoglu, S., Kendirci, M., Atabek, M. E. & Yazici, C. J. P. Homeostasis model assessment is more reliable than the fasting glucose/insulin ratio and quantitative insulin sensitivity check index for assessing insulin resistance among obese children and adolescents. Pediatrics 115, e500–e503 (2005).
28. Owei, I. et al. Insulin-sensitive and insulin-resistant obese and non-obese phenotypes: Role in prediction of incident pre-diabetes in a longitudinal biracial cohort. BMJ Open Diabetes Res. Care 5, e000415 (2017).
29. Yun, K.-J. et al. Insulin resistance distribution and cut-off value in Koreans from the 2008–2010 Korean National Health and Nutrition Examination Survey. PLoS ONE 11, e0154593 (2016).
30. Saxena, P., Prakash, A. & Nigam, A. J. Efficacy of 2-hour post glucose insulin levels in predicting insulin resistance in polycystic ovarian syndrome with infertility. J. Hum. Reprod. Sci. 4, 20 (2011).
31. Vuguin, P., Saenger, P. & Dimartino-Nardi, J. J. T. Fasting glucose insulin ratio: A useful measure of insulin resistance in girls with premature adrenarche. J. Clin. Endocrinol. Metab. 86, 4618–4621 (2001).
32. Legro, R. S., Finegood, D. & Dunaif, A. J. T. A fasting glucose to insulin ratio is a useful measure of insulin sensitivity in women with polycystic ovary syndrome. J. Clin. Endocrinol. Metab. 83, 2694–2698 (1998).
33. Kim, S. & Kim, D. I. Association of regular walking and body mass index on metabolic syndrome among an elderly Korean popula-tion. Exp. Gerontol. 106, 178–182 (2018).
34. Kodama, K., Tojjar, D. & Yamada, S. Ethinic differences in the relationship between insulin sensitivity and insulin response. Diabetes Care 36, 1789 (2013).
35. Michaliszyn, S. F., Lee, S., Tfayli, H. & Arslanian, S. Polycystic ovary syndrome and nonalcoholic fatty liver in obese adolescents: Association with metabolic risk profile. Fertil. Steril. 100, 1745–1751 (2013).
36. Cai, J. et al. High-free androgen index is associated with increased risk of non-alcoholic fatty liver disease in women with polycystic ovary syndrome, independent of obesity and insulin resistance. Int. J. Obes. (Lond.) 41, 1341–1347 (2017).
37. Dyson, J. K., Anstee, Q. M. & McPherson, S. J. Non-alcoholic fatty liver disease: A practical approach to diagnosis and staging. Frontline Gastroenterol. 5, 211–218 (2014).
38. Chen, M. J. & Ho, H. N. Hepatic manifestations of women with polycystic ovary syndrome. Best Pract. Res. Clin. Obstet. Gynaecol.
37, 119–128 (2016).
39. Gambarin-Gelwan, M. et al. Prevalence of nonalcoholic fatty liver disease in women with polycystic ovary syndrome. Clin. Gas-troenterol. Hepatol. 5, 496–501 (2007).
40. Mofrad, P. et al. Clinical and histologic spectrum of nonalcoholic fatty liver disease associated with normal ALT values. Hepatalogy
41. Byrne, C. D., Patel, J., Scorletti, E. & Targher, G. Tests for diagnosing and monitoring non-alcoholic fatty liver disease in adults. BMJ 362, k2734 (2018).
42. Legro, R. S. et al. Diagnosis and treatment of polycystic ovary syndrome: An Endocrine Society clinical practice guideline. J. Clin. Endocrinol. Metab. 98, 4565–4592 (2013).
43. Sakurai, M., Takamura, T., Miura, K., Kaneko, S. & Nakagawa, H. BMI may be better than waist circumference for defining meta-bolic syndrome in Japanese women. Diabetes Care 31, e12 (2008).
44. Takahashi, M. et al. A proposal of combined evaluation of waist circumference and BMI for the diagnosis of metabolic syndrome. Endocr. J. 56, 1079–1082 (2009).
45. Laclaustra, M. et al. LDL Cholesterol rises with BMI only in lean individuals: Cross-sectional U.S. and Spanish representative data. Diabetes Care 41, 2195–2201 (2018).
46. Stepanova, M., Rafiq, N. & Younossi, Z. M. J. G. Components of metabolic syndrome are independent predictors of mortality in patients with chronic liver disease: A population-based study. Gut 59, 1410 (2010).
Acknowledgements
The authors thank MID (Medical Illustration & Design), a part of the Medical Research Support Services of Yonsei University College of Medicine, for all artistic support related to this work.
Author contributions
Y.B.W. wrote the manuscript, prepared the tables, interpreted data; S.K.S. contributed interpretation of data and preparing figures; B.H.Y. developed the idea for the paper, designed the study, analyzed the data, critical revi-sion; S.C. provided expert advice and critical revirevi-sion; Y.S.C. provided patients of the study and handling the data; B.S.L formulated the study design and contributed critical revision. All authors reviewed the manuscript.
Competing interests
The authors declare no competing interests.
Additional information
Correspondence and requests for materials should be addressed to B.H.Y. Reprints and permissions information is available at www.nature.com/reprints.
Publisher’s note Springer Nature remains neutral with regard to jurisdictional claims in published maps and
institutional affiliations.
Open Access This article is licensed under a Creative Commons Attribution 4.0 International
License, which permits use, sharing, adaptation, distribution and reproduction in any medium or format, as long as you give appropriate credit to the original author(s) and the source, provide a link to the Creative Commons licence, and indicate if changes were made. The images or other third party material in this article are included in the article’s Creative Commons licence, unless indicated otherwise in a credit line to the material. If material is not included in the article’s Creative Commons licence and your intended use is not permitted by statutory regulation or exceeds the permitted use, you will need to obtain permission directly from the copyright holder. To view a copy of this licence, visit http:// creat iveco mmons. org/ licen ses/ by/4. 0/.