Original Article
Inter-Device Agreement of Retinal Nerve Fiber Layer Thickness Measurements Using Spectral Domain Cirrus HD OCT
Samin Hong, Yeongjun Kim, Jongwoo Shim, Chan Yun Kim, Gong Je Seong
Institute of Vision Research, Department of Ophthalmology, Yonsei University College of Medicine, Seoul, Korea
Purpose: To assess the inter-device agreement of peripapillary retinal nerve fiber layer (RNFL) thickness measure- ments by 2 spectral domain Cirrus HD optical coherence tomography (OCT) devices in healthy Korean subjects.
Methods: Eleven eyes of 11 healthy volunteers were enrolled in the present study. Each eye was scanned with the Optic Disc Cube 200 × 200 scan of 2 Cirrus HD OCT devices for peripapillary RNFL thickness calculation. The in- ter-device agreements of the 2 Cirrus HD OCTs for average, quadrant, and clock-hour RNFL thickness values were determined with Wilcoxon signed rank test, Friedman test, Cronbach’s alpha (α), intraclass correlation co- efficient (ICC), coefficient of variation (COV), and Bland-Altman plot.
Results: The mean age of the participants was 25.82 ± 3.28 years and all had a 0.00 logarithm of the minimum angle of resolution of best-corrected visual acuity. The signal strengths of scans from the 2 Cirrus HD OCT were not sig- nificantly different (p = 0.317). The inter-device agreement of average RNFL thickness was excellent (α, 0.940;
ICC, 0.945; COV, 2.45 ± 1.52%). However, the agreement of nasal quadrant RNFL thickness was not very good (α, 0.715; ICC, 0.716; COV, 5.72 ± 4.64%). Additionally, on the Bland-Atman plot, the extent of agreement of the 2 Cirrus HD OCTs for RNFL thickness was variable according to scanned sectors.
Conclusions: The inter-device agreement of 2 spectral domain Cirrus HD OCT devices for peripapillary RNFL thick- ness measurements was generally excellent but variable according to the scanned area. Thus, physicians should consider this fact before judging a change of RNFL thicknesses if they were measured by different OCT devices.
Key Words:Inter-device agreement, Optical coherence tomography, Retinal nerve fiber layer thickness
ⓒ2011 The Korean Ophthalmological Society
This is an Open Access article distributed under the terms of the Creative Commons Attribution Non-Commercial License (http://creativecommons.org/licenses /by-nc/3.0/) which permits unrestricted non-commercial use, distribution, and reproduction in any medium, provided the original work is properly cited.
Received: June 19, 2009 Accepted: August 18, 2010
Corresponding Author: Gong Je Seong, MD, PhD. Department of Ophthalmology, Institute of Vision Research, Yonsei University College of Medicine, #712 Eonjuro, Gangnam-gu, Seoul 135-720, Korea. Tel:
82-2-2019-3441, Fax: 82-2-3463-1049, E-mail: [email protected]
* Presented as a poster at the 101st Korean Ophthalmological Society Meeting on April 18-19, 2009, Daejeon, Korea.
Since the optical coherence tomography (OCT) was in- troduced for use in glaucoma [1,2], the measurement of peri- papillary retinal nerve fiber layer (RNFL) thickness has played a crucial role for diagnosis of glaucoma and judgment of the disease progression [3,4]. Recently, a spectral domain OCT was newly developed and commercialized. Compared to the time domain OCT, the spectral domain OCT takes a re- al-time cube scan with ultrahigh axial resolution (approximately 5 μm) and may be more useful for peripapillary RNFL thick-
ness measurement [5-7].
Inter-device agreement is very important for any type of medical instrument. Ideally, all machines of the same OCT model with the same version of software should produce the same measurement values when consecutively measuring the same eye at the same place by the same operator. For any new ophthalmologic instrument, its inter-device agreement should be confirmed before being widely used.
Regarding time domain OCT, there are several reports dealing with the inter-device agreement for peripapillary RNFL thickness measurement [8,9]. However, regarding spectral domain OCT, no report currently exists in the literature. Therefore, in the present study, the inter-device agreements of 2 spectral domain Cirrus HD OCT (Carl Zeiss Meditec, Dublin, CA, USA) devices were assessed for peri- papillary RNFL thickness measurements in healthy Korean eyes.
Table 1. Characteristics of participants
Characteristics Data
Age (yr) 25.8 ± 3.3 (range, 21 to 34)
Gender (male:female) 8:3
BCVA (logMAR) 0.00 ± 0.00 (all 0.00)
IOP (mmHg) 12.55 ± 3.08 (range, 9 to 19)
Spherical RE (diopters) -3.34 ± 1.58 (range, -0.75 to -5.00)
Cylinderical RE (diopters) -1.16 ± 0.74 (range, -0.25 to -2.25) Mean keratometer (diopters) 43.72 ± 1.84 (range, 40.38 to 46.00)
BCVA = best-corrected visual acuity; logMAR = logarithm of the minimum angle of resolution; IOP = intraocular pressure; RE = refractive error.
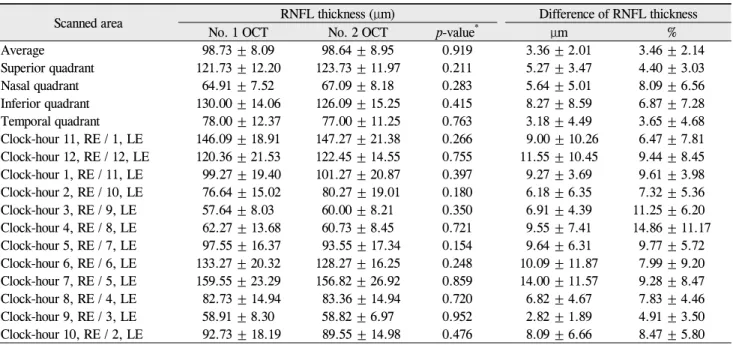
Table 2. Peripapillary RNFL thickness measurements by the 2 Cirrus HD OCT instruments in healthy Korean eyes
Scanned area RNFL thickness (μm) Difference of RNFL thickness
No. 1 OCT No. 2 OCT p-value* μm %
Average 98.73 ± 8.09 98.64 ± 8.95 0.919 3.36 ± 2.01 3.46 ± 2.14
Superior quadrant 121.73 ± 12.20 123.73 ± 11.97 0.211 5.27 ± 3.47 4.40 ± 3.03
Nasal quadrant 64.91 ± 7.52 67.09 ± 8.18 0.283 5.64 ± 5.01 8.09 ± 6.56
Inferior quadrant 130.00 ± 14.06 126.09 ± 15.25 0.415 8.27 ± 8.59 6.87 ± 7.28
Temporal quadrant 78.00 ± 12.37 77.00 ± 11.25 0.763 3.18 ± 4.49 3.65 ± 4.68
Clock-hour 11, RE / 1, LE 146.09 ± 18.91 147.27 ± 21.38 0.266 9.00 ± 10.26 6.47 ± 7.81 Clock-hour 12, RE / 12, LE 120.36 ± 21.53 122.45 ± 14.55 0.755 11.55 ± 10.45 9.44 ± 8.45 Clock-hour 1, RE / 11, LE 99.27 ± 19.40 101.27 ± 20.87 0.397 9.27 ± 3.69 9.61 ± 3.98 Clock-hour 2, RE / 10, LE 76.64 ± 15.02 80.27 ± 19.01 0.180 6.18 ± 6.35 7.32 ± 5.36 Clock-hour 3, RE / 9, LE 57.64 ± 8.03 60.00 ± 8.21 0.350 6.91 ± 4.39 11.25 ± 6.20 Clock-hour 4, RE / 8, LE 62.27 ± 13.68 60.73 ± 8.45 0.721 9.55 ± 7.41 14.86 ± 11.17 Clock-hour 5, RE / 7, LE 97.55 ± 16.37 93.55 ± 17.34 0.154 9.64 ± 6.31 9.77 ± 5.72 Clock-hour 6, RE / 6, LE 133.27 ± 20.32 128.27 ± 16.25 0.248 10.09 ± 11.87 7.99 ± 9.20 Clock-hour 7, RE / 5, LE 159.55 ± 23.29 156.82 ± 26.92 0.859 14.00 ± 11.57 9.28 ± 8.47 Clock-hour 8, RE / 4, LE 82.73 ± 14.94 83.36 ± 14.94 0.720 6.82 ± 4.67 7.83 ± 4.46
Clock-hour 9, RE / 3, LE 58.91 ± 8.30 58.82 ± 6.97 0.952 2.82 ± 1.89 4.91 ± 3.50
Clock-hour 10, RE / 2, LE 92.73 ± 18.19 89.55 ± 14.98 0.476 8.09 ± 6.66 8.47 ± 5.80 RNFL = retinal nerve fiber layer; OCT = optical coherence tomography; LE = left eye; RE= right eye.
*Wilcoxon signed rank test.
Materials and Methods
Subjects
The study protocol adhered to the tenets of the Declaration of Helsinki and obtained the approval of the Institutional Review Board. A total of 11 healthy Korean volunteers were enrolled in the present study. After comprehensive ophthalmologic examination, only 1 eye of each subject was randomly selected if both eyes satisfied entry criteria.
The inclusion criteria were as follows: 1) age between 20 and 40 years, 2) intraocular pressure less than 21 mmHg, 3) best-corrected visual acuity of 20 / 25 or better, 4) spherical refractive errors between -5 and +5 diopters and cylindrical refractive errors between -3 and +3 diopters, 5) no distinctive changes of optic nerve head and RNFL appearance, 6) no vis- ual field loss on standard automated perimetry, and 7) no his- tory of ocular disease or trauma.
Measurements
Each studied eye was scanned with Optic Disc Cube 200 × 200 scan of 2 different Cirrus HD OCT devices (Model 4000, software version 3.0.0.64) without pupil dilation. The OCT devices were accurately calibrated by the manufacturer. All measurements were consecutively taken by the same oper- ator within 5 minutes. Average, quadrant, and clock-hour peripapillary RNFL thicknesses were obtained from the 2 OCT devices and compared. Scans with blinks or with low signal strength less than 6 were excluded from the analysis.
Statistical analysis
The inter-device agreement of the 2 Cirrus HD OCTs for the peripapillary RNFL thickness measurement was determined with Wilcoxon signed rank test, Friedman test, Cronbach’s alpha (α), intraclass correlation coefficient (ICC), coefficient of variation (COV), and Bland-Altman plot. Bland-Altman
Table 3. Agreement of peripapillary RNFL thickness measurements by the 2 Cirrus HD OCT instruments in healthy Korean eyes
Scanned area α* ICC (p-value) 95% CI of ICC COV† (%)
Average 0.940 0.945 (<0.001) 0.793-0.985 2.45 ± 1.52
Superior quadrant 0.930 0.929 (<0.001) 0.751-0.981 3.11 ± 2.14
Nasal quadrant 0.715 0.716 (0.030) -0.001-0.923 5.72 ± 4.64
Inferior quadrant 0.818 0.815 (0.006) 0.354-0.949 4.86 ± 5.15
Temporal quadrant 0.943 0.946 (<0.001) 0.804-0.985 2.58 ± 3.31
Clock-hour 11, RE / 1, LE 0.866 0.876 (0.002) 0.527-0.967 4.58 ± 5.52
Clock-hour 12, RE / 12, LE 0.772 0.785 (0.014) 0.175-0.943 6.67 ± 5.98
Clock-hour 1, RE / 11, LE 0.669 0.670 (0.048) -0.178-0.910 6.80 ± 2.81
Clock-hour 2, RE / 10, LE 0.939 0.933 (<0.001) 0.758-0.982 5.18 ± 3.79
Clock-hour 3, RE / 9, LE 0.669 0.670 (0.048) -0.178-0.910 7.95 ± 4.38
Clock-hour 4, RE / 8, LE 0.582 0.601 (0.093) -0.607-0.895 10.50 ± 7.90
Clock-hour 5, RE / 7, LE 0.877 0.873 (0.001) 0.557-0.965 6.91 ± 4.04
Clock-hour 6, RE / 6, LE 0.800 0.797 (0.009) 0.292-0.944 5.65 ± 6.51
Clock-hour 7, RE / 5, LE 0.844 0.854 (0.003) 0.451-0.961 6.56 ± 5.99
Clock-hour 8, RE / 4, LE 0.912 0.919 (<0.001) 0.693-0.978 5.53 ± 3.15
Clock-hour 9, RE / 3, LE 0.945 0.950 (<0.001) 0.810-0.986 3.47 ± 2.48
Clock-hour 10, RE / 2, LE 0.895 0.895 (0.001) 0.630-0.971 5.99 ± 4.10
RNFL = retinal nerve fiber layer; OCT = optical coherence tomography; ICC = intraclass correlation coefficient; CI = confidence interval;
COV = coefficient of variation; RE = right eye; LE = left eye.
*Cronbach’s alpha; †Calculated as the square root of the variance divided by the mean thickness measurements of the 2 different OCT devices.
plots were constructed using the MedCalc ver. 9.6.4.0 (MedCalc Software, Mariakerke, Belgium) and other statistics were performed using the SPSS ver. 12.0.1 (SPSS Inc., Chicago, IL, USA).
Results
Characteristics of all 11 participants are demonstrated in Table 1. The mean age was 25.82 ± 3.28 years (range, 21 to 34 years), mean intraocular pressure was 12.55 ± 3.08 mmHg (range, 9 to 19 mmHg), and all subjects had 0.00 logarithm of the minimum angle of resolution of best-corrected visual acuity.
Average, quadrant and clock-hour peripapillary RNFL thicknesses measured by the 2 Cirrus HD OCT devices are shown in Table 2. The average RNFL thickness of the 2 OCTs was very similar (p = 0.919). However, the quadrant and clock-hour RNFL thicknesses appeared to be somewhat different although the extent of difference was not statisti- cally significant. Regarding signal strengths, the scans by the 2 OCTs were not different (p = 0.317, Wilcoxon signed rank test).
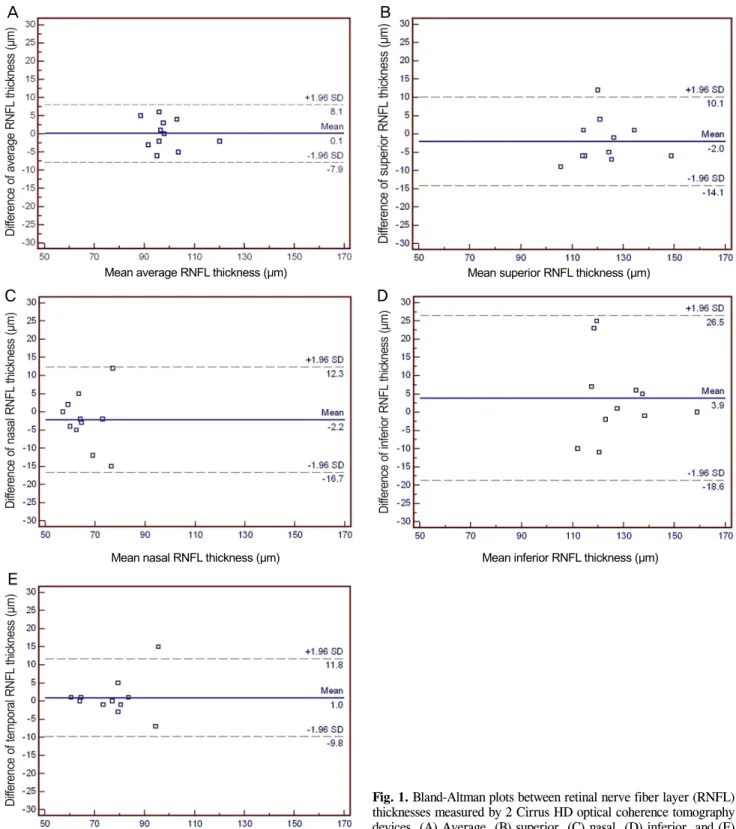
Data regarding the agreement analyses are shown in Table 3 and Fig. 1. For average RNFL thickness, the inter-device agreement of the 2 Cirrus HD OCT was excellent; the α -value was 0.940, the ICC was 0.945, and the COV was 2.45
± 1.52%. Even on the Bland-Atman plot, the mean difference was only 0.1 μm (Fig. 1A). However, for quadrant and clock-hour RNFL thicknesses, the agreement was variable according to scanned sectors. For example, for the 4 o’clock
area of the right eye / 8 o’clock area of left eye, the α-value was 0.582, the ICC was 0.601, and the COV reached 10.50 ± 7.90%.
Discussion
Selective loss of retinal ganglion cells and progressive thinning of RNFL thickness are characteristics of glaucoma.
After development of various ocular imaging devices such as OCT and scanning laser polarimetry, the measurement of peripapillary RNFL thickness has become helpful for diag- nosis of glaucoma and judgment of the disease progression [3,4].
Because glaucoma is a life-long disease, the longitudinal data of any test is very important for each patient. Thus, before generally using any new instrument, the physicians should confirm its inter-device agreement as well as reproducibility.
In the present study, the inter-device agreement of 2 spectral domain OCT devices with the same model and software for peripapillary RNFL thickness measurements was assessed.
Two Cirrus HD OCTs of the same model with the same ver- sion of software were used. The same eyes were consec- utively scanned at the same place by the same examiner.
However, as a result, the RNFL thickness values showed some variability according to scanned sectors.
Cronbach’s α is generally used as a measure of the con- sistency of items and increases when the correlations be- tween the items increase. The α-value has basically a similar meaning with ICC, but is influenced by the number of items due to its definition [10]. Because the present study included
Mean average RNFL thickness (μm) Mean superior RNFL thickness (μm)
Mean nasal RNFL thickness (μm) Mean inferior RNFL thickness (μm)
Mean temporal RNFL thickness (μm)
Fig. 1. Bland-Altman plots between retinal nerve fiber layer (RNFL) thicknesses measured by 2 Cirrus HD optical coherence tomography devices. (A) Average, (B) superior, (C) nasal, (D) inferior, and (E) temporal quadrants.
a small number of subjects and only 2 different devices, the au- thors attempted to confirm the inter-device agreement not on- ly with ICC but also with the α value. As a result, the α-values and ICCs were not too different and the present small pilot study may have significant relevance.
Even though the inter-device agreement data of spectral
domain OCT was not directly compared with the time do- main OCT, the tendency of the present study’s data appears to be similar with previous reports [8,9]. The inter-device agreement for average RNFL thickness was excellent, but was variable according to detailed scanned sectors, and espe- cially poor in the nasal area.
A B
C D
E
In summary, because the inter-device agreement of spec- tral domain OCT for peripapillary RNFL thickness measure- ment was variable according to scanned areas, physicians should consider this fact before directly comparing the RNFL thickness values measured by different OCTs.
Conflict of Interest
No potential conflict of interest relevant to this article was reported.
References
1. Schuman JS, Hee MR, Puliafito CA, et al. Quantification of nerve fiber layer thickness in normal and glaucomatous eyes using optical coherence tomography. Arch Ophthalmol 1995;
113:586-96.
2. Pieroth L, Schuman JS, Hertzmark E, et al. Evaluation of focal defects of the nerve fiber layer using optical coherence tomography. Ophthalmology 1999;106:570-9.
3. Sehi M, Greenfield DS. Assessment of retinal nerve fiber lay- er using optical coherence tomography and scanning laser po- larimetry in progressive glaucomatous optic neuropathy. Am J
Ophthalmol 2006;142:1056-9.
4. Leung CK, Cheung CY, Lin D, et al. Longitudinal variability of optic disc and retinal nerve fiber layer measurements.
Invest Ophthalmol Vis Sci 2008;49:4886-92.
5. Wojtkowski M, Bajraszewski T, Gorczy ska I, et al. Ophthalmic imaging by spectral optical coherence tomography. Am J Ophthalmol 2004;138:412-9.
6. Chen TC, Cense B, Pierce MC, et al. Spectral domain optical coherence tomography: ultra-high speed, ultra-high resolution ophthalmic imaging. Arch Ophthalmol 2005;123:1715-20.
7. Vizzeri G, Balasubramanian M, Bowd C, et al. Spectral do- main-optical coherence tomography to detect localized retinal nerve fiber layer defects in glaucomatous eyes. Opt Express 2009;17:4004-18.
8. Sehi M, Guaqueta DC, Feuer WJ, Greenfield DS. A compar- ison of structural measurements using 2 Stratus optical coher- ence tomography instruments. J Glaucoma 2007;16:287-92.
9. Barkana Y, Burgansky-Eliash Z, Gerber Y, et al. Inter-device variability of the Stratus optical coherence tomography. Am J Ophthalmol 2009;147:260-6.
10. Bravo G, Potvin L. Estimating the reliability of continuous measures with Cronbach’s alpha or the intraclass correlation coefficient: toward the integration of two traditions. J Clin Epidemiol 1991;44:381-90.