© 2018 The Korean Ophthalmological Society
This is an Open Access article distributed under the terms of the Creative Commons Attribution Non-Commercial License (http://creativecommons.org/licenses /by-nc/3.0/) which permits unrestricted non-commercial use, distribution, and reproduction in any medium, provided the original work is properly cited.
Original Article
Macular holes, which are characterized by defects of the neurosensory retina and cystic changes in the macula, cause central visual disturbances [1]. Knapp [2] reported the first macular hole in 1869. More than 100 years later,
Received: March 13, 2018 Accepted: May 15, 2018
Corresponding Author: Jung-Yeul Kim, MD. Department of Ophthalmolo- gy, Chungnam National University Hospital, #282 Munhwa-ro, Jung-gu, Daejeon 35015, Korea. Tel: 82-42-280-8433, Fax: 82-42-255-3745, E-mail:
Thickness of the Macula, Retinal Nerve Fiber Layer, and Ganglion Cell-inner Plexiform Layer in the Macular Hole: The Repeatability
Study of Spectral-domain Optical Coherence Tomography
Woo Hyuk Lee, Young Joon Jo, Jung Yeul Kim
Department of Ophthalmology, Chungnam National University College of Medicine, Daejeon, Korea
Purpose: We measured the thicknesses of the ganglion cell and inner plexiform layer (GCIPL), the macula, and the retinal nerve fiber layer (RNFL) using spectral-domain optical coherence tomography in patients with idio- pathic macula holes to analyze the repeatability of these measurements and compare them with those of the fellow eye.
Methods: We evaluated 85 patients who visited our retinal clinic. The patients were divided into two groups ac- cording to their macular hole size: group A had a size of <400 µm, while group B had a size of ≥400 µm. Re- peatability was determined by comparing the thicknesses of the GCIPL, macula, and RNFL with those of the normal fellow eye.
Results: The average central macular thickness in patients with macular holes was significantly thicker than that in the normal fellow eye (343.8 ± 78.6 vs. 252.6 ± 62.3 µm, p < 0.001). The average thickness of the GCI- PL in patients with macular holes was significantly thinner than that in the normal fellow eye (56.1 ± 23.4 vs.
77.1 ± 12.8 µm, p < 0.001). There was no significant difference in the average RNFL thickness between eyes with macular holes and fellow eyes (92.4 ± 10.0 vs. 95.5 ± 10.7 µm, p = 0.070). There were also no significant differences in the thicknesses of the GCIPL and RNFL among the two groups (p = 0.786 and p = 0.516). The intraclass correlation coefficients for the macula and RNFL were 0.994 and 0.974, respectively, in patients with macular holes, while that for the GCIPL was 0.700.
Conclusions: Macular contour change with macular hole results in low repeatability and a tendency of thinner measurement regarding GCIPL thickness determined via spectral-domain optical coherence tomography. The impact of changes in the macular shape caused by macular holes should be taken into consideration when measuring the GCIPL thickness in patients with various eye diseases such as glaucoma and in those with neu- ro-ophthalmic disorders.
Key Words: Macular holes, Repeatability, Retina, Spectral-domain optical coherence tomography
Gass [3] revealed that the cause of idiopathic macular holes is vitreomacular traction on the fovea in a tangential direc- tion. Gaudric et al. [4] and Hee et al. [5] proposed the use of vitrectomy, which removes vitreomacular traction, as a successful treatment of macular holes.
Optical coherence tomography (OCT) is widely used to study macular disease because it displays the cross-section- al image of the retina at a high resolution and enables the quantitative evaluation of macular thickness. OCT recently evolved from the time domain to the spectral domain.
Spectral-domain OCT (SD-OCT) results in images using Fourier transformation after the spectrum of the light through the interferometer is accepted by the spectrometer.
This procedure can obtain more images in a shorter time as compared with time-domain OCT. In addition, with ad- vanced image processing techniques, accurate analysis has been made possible by autosegmentation of each layer of the macula. According to the results of some investigations completed using autosegmentation, macular hole geometry and the extent of ellipsoid zone band defects are associated with postoperative visual acuity [6,7].
SD-OCT exhibits high repeatability and reproducibility in measuring the thickness of macular and peripapillary retinal nerve fiber layers (RNFLs) [8]. Quantitative mea- surement of the macular ganglion cell and inner plexiform layer (GCIPL) was recently made possible. The measure- ment of GCIPL autosegmentation is broadly used in vari- ous fields of ophthalmology. Mwanza et al. [9] and Mwanza et al. [10] found that the thickness of the GCIPL is useful for the evaluation of structural changes in the retina and provides critical information for the early diagnosis of glaucoma. In addition, Moon et al. [11] evaluated changes in the thickness of the GCIPL caused by various types of brain lesion in patients with visual impairment.
Mwanza et al. [10] and Francoz et al. [12] reported that automated measurement of the thickness of the GCIPL in normal and glaucomatous eyes exhibits a high level of re- peatability; thus, the thickness of the GCIPL is useful for examining the progress of glaucoma. Furthermore, retinal changes can affect measurement repeatability; in particu- lar, the thickness of the GCIPL as measured through the segmentations of the retina may be measured inaccurately.
Some studies have shown that autosegmented measure- ments exhibit a high tendency to be erroneous in non- healthy patients [6,7,13].
However, to our knowledge, no studies to date have ex-
amined the measurement repeatability of the GCIPL thick- ness in eyes with macular hole. Since macular hole shows structural abnormality only in the macula, it is thought to be adequate for studies on the effects of macular disease on GCIPL measurement. We assumed that GCIPL measure- ment would be different according to macular defect by hole size.
Therefore, using SD-OCT, we evaluated the measure- ment repeatability of the central macular thickness, peri- papillary RNFL thickness, and GCIPL thickness in pa- tients with idiopathic full-thickness macular holes. We compared these findings with those of normal eyes.
Materials and Methods
This prospective cohort study was approved by the insti- tutional review board of Chungnam National University Hospital. The procedures used adhered to the tenets of the Declaration of Helsinki. The institutional review board of Chungnam National University Hospital also approved the prospective collection of data from the medical charts of patients with and without retinal diseases (2012-05-007).
Prior to macular hole surgery, written informed consent was obtained not only for the surgery but also for the use of patients’ data for future research studies.
Materials
The present study was carried out from June 2012 to Oc- tober 2014. Patients who visited the retina clinic of Chun- gnam National University Hospital and who were diag- nosed with unilateral idiopathic macular holes without participating ophthalmic history were included in this study.
A detailed medical history as well as uncorrected visual acuity, best-corrected visual acuity, intraocular pressure us- ing noncontact tonometry, funduscopy, fundus photogra- phy, and OCT findings were obtained from all of the pa- tients (85 patients). Patients with axial lengths shorter than 23.60 mm and longer than 25.55 mm were excluded because these patients require the adjustment of measurements by SD-OCT [14]. Patients with a history of intraocular surgery, ocular trauma, diagnosis of other ophthalmic diseases in addition to macular holes (including retinal disease, glauco- ma, and optic nerve disease), and those with OCT signal strength under 5 were excluded from this study [15].
OCT measurement
A macular cube 512 × 128 combination scan mode and an optic disc cube 200 × 200 scan mode were performed by an experienced examiner using SD-OCT (Cirrus HD- OCT; Carl Zeiss Meditec, Jena, Germany). Full-thickness and GCIPL were analyzed in the macular cube scans, while RNFL was analyzed in the optic disk cube scans.
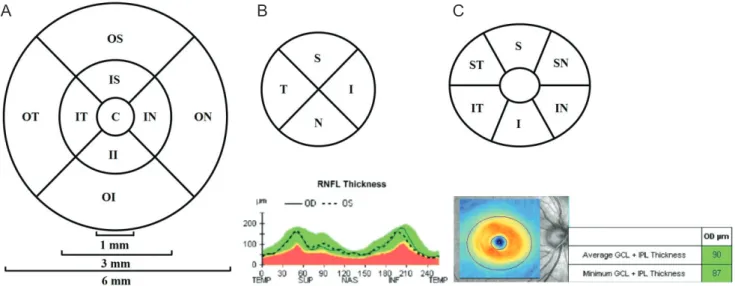
The measurement was repeated twice in five-minute inter- vals to examine the measurement repeatability. The macu- lar cube 512 × 128 combination scan mode was analyzed after dividing it into a central circle, inner ring, and outer ring with diameters of 1, 3, and 6 mm, respectively, based on the center of the macula using a retinal map automated analysis system from the Cirrus HD-OCT software ver.
6.0.1. The scan was divided into the nine Early Treatment Diabetic Retinopathy Study subfields—specifically, the central macular subfield and the inner and outer superior, temporal, inferior, and nasal subfields (Fig. 1A) [16]. The RNFL was analyzed with respect to its average thickness and four areas obtained from the optic disc cube 200 × 200 scan mode (i.e., superior, temporal, inferior, nasal) (Fig.
1B).
The thickness of the GCIPL was measured using a gan- glion cell analysis algorithm, which is a software system within the Cirrus HD-OCT ver. 6.0.1. Based on the three-di-
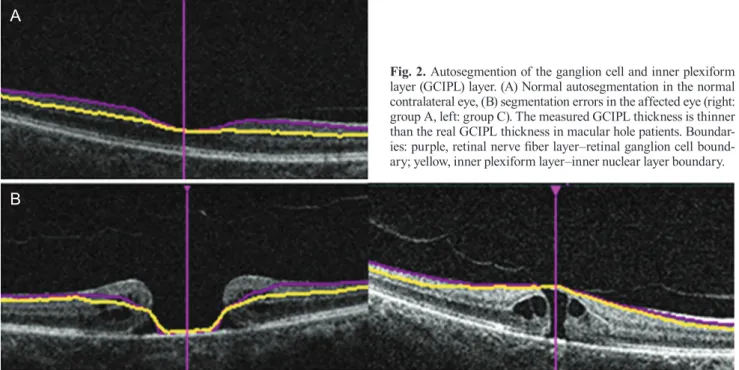
mensional information obtained from the macular cube scan, the thickness of the GCIPL was measured by detect- ing the boundaries of the outer boundary of the nerve fiber layer and the outer boundary of the inner plexiform layer (Fig. 1C, 2A, 2B). All measurements were determined auto- matically on a pixel-by-pixel basis for all of the SD-OCT images using an intraretinal layer automated segmentation method. Focusing on the fovea and after excluding internal ovals with a horizontal diameter of 1.2 mm and a vertical diameter of 1.0 mm, the average, minimum value, and six sectors (i.e., the superior, superotemporal, superonasal, infe- rior, inferonasal, and inferotemporal areas) were measured in the annulus with a horizontal diameter of 4.8 mm and a vertical diameter of 4.0 mm (Fig. 1C).
Each patient’s affected eye was compared with their op- posite normal eye. The affected eyes were divided into two groups according to the size of the macular hole. The areas with macular hole measuring <400 and ≥400 µm were classified into groups A and B, respectively, to analyze the influence of hole size on measurement. The size of the macular hole was defined as the base diameter from the retinal pigment epithelium, and the measurement was per- formed on both vertical and horizontal tomography, cross- ing the center of the macular hole on SD-OCT. The average measurements of the maximum horizontal and vertical di- ameters were used for analysis.
Fig. 1. Macular and optic disc analysis of the right eye. (A) A macular cube 512 × 128 combination scan mode, (B) an optic disc cube 200 × 200 scan mode, and (C) ganglion cell and inner plexiform layer analysis. OS = outer superior; OT = outer temporal; OI = outer inferior = ON
= outer nasal; IS = inner superior; IT = inner temporal; II = inner inferior; IN = inner nasal; C = central; S = superior; T = temporal; I = in- ferior; N = nasal; RNFL = retinal nerve fiber layer; TEMP = temporal; SUP = superior; NAS = nasal; INF = inferior; ST = superotemporal;
IT = inferotemporal; IN = inferonasal; SN = superonasal; GCL = ganglion cell layer; IPL = inner plexiform layer.
A B C
Statistical analysis
Analyses were performed with the PASW Statistics ver.
18.0 (SPSS Inc., Chicago, IL, USA). When comparing the affected eye and the normal fellow eye, Student’s t-tests were used. In the comparison between groups A and B, Pearson’s chi-squared test and Student’s t-test were used.
We employed the average measurement in the comparison.
The intraclass correlation coefficient (ICC), coefficient of variation (COV), and test-retest variability (TRV) were cal- culated to determine the repeatability of consecutively measured thicknesses of the central macula, RNFL, and GCIPL. ICC is the correlation between two variables mea- sured at different time points (t) with values ranging from 0 to 1. As the ICC value approaches 1, the repeatability of the measurement increases proportionally [17]. COV is the ratio of the standard deviation and the mean expressed as a percentage; the closer the value is to 0, the higher the re- peatability is. TRV (µm), as indicated by the coefficient of repeatability, was calculated by multiplying the standard deviation of the difference between the measurements by 2.
High repeatability was indicated by the existence of TRV values close to 0. The agreement between the two measure- ments was assessed using Bland-Altman plots, and p-val- ues of <0.05 were deemed to indicate statistical significance [18].
Results
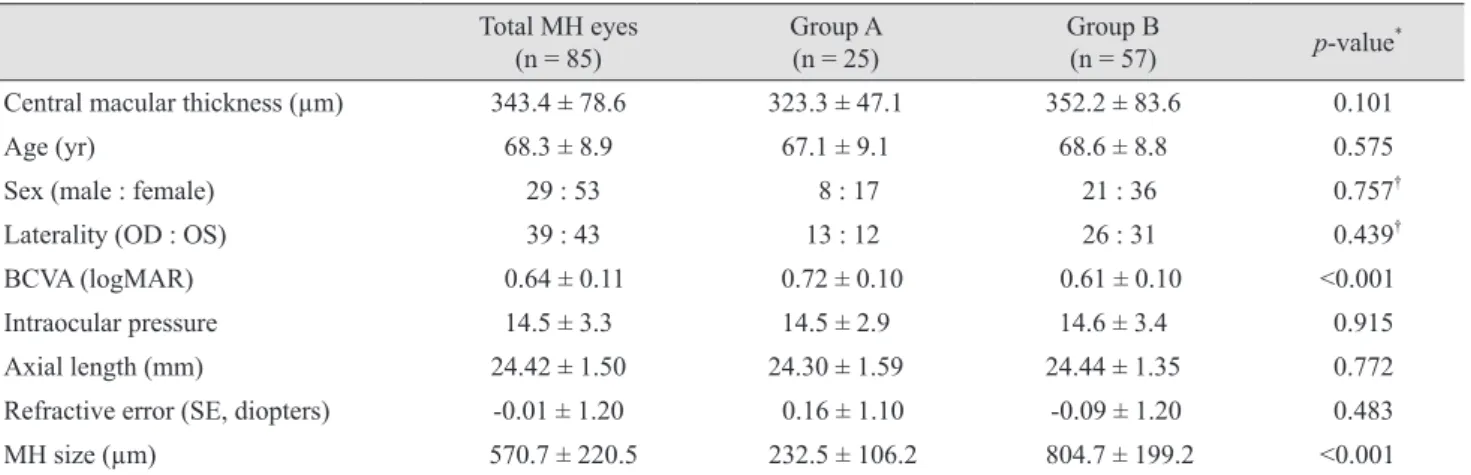
This study included 85 patients (29 males and 53 fe- males). Groups A and B included 25 eyes and 57 eyes, re- spectively. There were no significant differences in terms of age, sex, laterality, best-corrected visual acuity, intraoc- ular pressure, or refractive power among the two groups (Table 1).
OCT measurement with automated analysis
The thickness of the central macula, average thickness of the RNFL, and average thickness of the GCIPL among all patients were 252.6 ± 62.3, 92.4 ± 10.0, and 77.1 ± 12.8 µm, respectively, in normal fellow eyes and 343.8 ± 78.6, 95.5 ± 10.7, and 56.1 ± 23.4 µm, respectively, in eyes with macular holes. The thickness of the central macula was significantly thicker in affected eyes than in normal eyes (p < 0.001), while the thickness of the average GCLIPL was thinner in affected eyes than in normal eyes; it was also low in each sector (p < 0.001). There was no significant difference in the thickness of the RNFL (p = 0.070) (Table 2).
The analysis according to macular hole size showed that the average thicknesses of the central macula, RNFL, and GCIPL were 323.3 ± 47.1, 94.8 ± 12.1, and 53.7 ± 22.5 µm, respectively, in group A and 352.2 ± 83.6, 95.8 ± 10.5, and
A
B
Fig. 2. Autosegmention of the ganglion cell and inner plexiform layer (GCIPL) layer. (A) Normal autosegmentation in the normal contralateral eye, (B) segmentation errors in the affected eye (right:
group A, left: group C). The measured GCIPL thickness is thinner than the real GCIPL thickness in macular hole patients. Boundar- ies: purple, retinal nerve fiber layer–retinal ganglion cell bound- ary; yellow, inner plexiform layer–inner nuclear layer boundary.
Table 2. Comparison of measurement values between eyes with macular holes and fellow eyes
Fellow eye Macular hole p-value*
Macular thickness (μm) Central 252.6 ± 62.3 343.8 ± 78.6 <0.001
Inner superior 318.3 ± 34.1 345.1 ± 35.5 <0.001
Inner temporal 313.0 ± 47.3 336.1 ± 35.2 <0.001
Inner inferior 316.6 ± 38.1 343.3 ± 36.5 <0.001
Inner nasal 320.1 ± 34.7 361.0 ± 44.0 <0.001
Outer superior 278.6 ± 24.3 282.3 ± 25.6 0.791
Outer temporal 270.5 ± 47.9 270.5 ± 31.3 0.950
Outer inferior 264.7 ± 22.1 266.8 ± 26.0 0.857
Outer nasal 296.1 ± 18.1 299.5 ± 29.0 0.527
RNFL thickness (μm) Average 92.4 ± 10.0 95.5 ± 10.7 0.070
Superior 115.3 ± 23.8 123.5 ± 37.5 0.041
Temporal 70.5 ± 14.0 71.6 ± 14.8 0.582
Inferior 119.7 ± 21.5 111.0 ± 37.4 0.154
Nasal 68.5 ± 11.5 70.9 ± 15.6 0.415
GCIPL thickness (μm) Average 77.1 ± 12.8 56.1 ± 23.4 <0.001
Minimum 68.8 ± 19.4 35.8 ± 22.9 <0.001
Superior 78.2 ± 13.2 58.5 ± 26.6 <0.001
Superotemporal 78.3 ± 14.8 64.0 ± 25.2 <0.001
Inferotemporal 79.1 ± 17.2 62.0 ± 25.1 <0.001
Inferior 74.2 ± 18.2 49.5 ± 25.8 <0.001
Inferonasal 76.8 ± 14.8 53.8 ± 26.0 <0.001
Superonasal 79.5 ± 15.9 58.0 ± 27.5 <0.001
Values are presented as mean ± standard deviation.
RNFL = retinal nerve fiber layer; GCIPL = ganglion cell and inner plexiform layer.
*Student’s t-test.
Table 1. Patient demographics
Total MH eyes
(n = 85) Group A
(n = 25) Group B
(n = 57) p-value*
Central macular thickness (µm) 343.4 ± 78.6 323.3 ± 47.1 352.2 ± 83.6 0.101
Age (yr) 68.3 ± 8.9 67.1 ± 9.1 68.6 ± 8.8 0.575
Sex (male : female) 29 : 53 8 : 17 21 : 36 0.757†
Laterality (OD : OS) 39 : 43 13 : 12 26 : 31 0.439†
BCVA (logMAR) 0.64 ± 0.11 0.72 ± 0.10 0.61 ± 0.10 <0.001
Intraocular pressure 14.5 ± 3.3 14.5 ± 2.9 14.6 ± 3.4 0.915
Axial length (mm) 24.42 ± 1.50 24.30 ± 1.59 24.44 ± 1.35 0.772
Refractive error (SE, diopters) -0.01 ± 1.20 0.16 ± 1.10 -0.09 ± 1.20 0.483
MH size (µm) 570.7 ± 220.5 232.5 ± 106.2 804.7 ± 199.2 <0.001
MH = macular hole;OD = right eye; OS = left eye; BCVA: best-corrected visual acuity; logMAR = logarithm of the minimum angle of resolu- tion; SE = spherical equivalent.
*Student’s t-test, if not indicated; †Pearson’s chi-squared test.
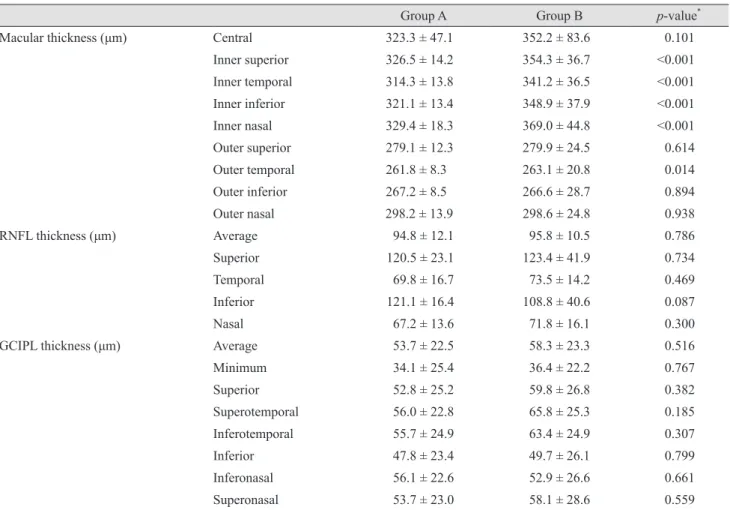
58.3 ± 23.3 µm, respectively, in group B. The thickness of the central macula, RNFL, and GCIPL were not signifi- cantly different among the two groups (Table 1, 3).
Measurement repeatability
The ICCs of the thicknesses of the central macula, RNFL, and GCIPL for healthy fellow eyes were 0.995, 0.966, and 0.998, respectively, whereas those for affected eyes were 0.994, 0.974, and 0.700. Both eye types exhibited an ICC of ≥0.950 for the central macula and RNFL, and they showed similar results to the measurements of each area of the central macula and RNFL. The ICC for the GCIPL of the affected eye was 0.700, which was lower than that for the RNFL and central macula; it was also low in each sector. The other markers of repeatability (i.e., COV
and TRV) yielded similar results (Table 4, 5). We assessed the same data using Bland-Altman plots (Fig. 3A-3C).
Discussion
The vitreoretinal interface is a complex structure of con- nective tissue that connects the vitreous cortex and inner retina. The posterior vitreous contains a high concentration of collagen fibers; laminin, fibronectin, and chondroitin are attached to the surface of the limiting membrane of the ret- ina [19]. The close relationship between the vitreous cortex and the retina can lead to various vitreoretinal interface disorders, including idiopathic macular holes. Gass [3] re- ported the mechanism of macular holes as involving tan- gential traction around the fovea. Studies using OCT have
Table 3. Comparison of measurement values among the two groups
Group A Group B p-value*
Macular thickness (μm) Central 323.3 ± 47.1 352.2 ± 83.6 0.101
Inner superior 326.5 ± 14.2 354.3 ± 36.7 <0.001
Inner temporal 314.3 ± 13.8 341.2 ± 36.5 <0.001
Inner inferior 321.1 ± 13.4 348.9 ± 37.9 <0.001
Inner nasal 329.4 ± 18.3 369.0 ± 44.8 <0.001
Outer superior 279.1 ± 12.3 279.9 ± 24.5 0.614
Outer temporal 261.8 ± 8.3 263.1 ± 20.8 0.014
Outer inferior 267.2 ± 8.5 266.6 ± 28.7 0.894
Outer nasal 298.2 ± 13.9 298.6 ± 24.8 0.938
RNFL thickness (μm) Average 94.8 ± 12.1 95.8 ± 10.5 0.786
Superior 120.5 ± 23.1 123.4 ± 41.9 0.734
Temporal 69.8 ± 16.7 73.5 ± 14.2 0.469
Inferior 121.1 ± 16.4 108.8 ± 40.6 0.087
Nasal 67.2 ± 13.6 71.8 ± 16.1 0.300
GCIPL thickness (μm) Average 53.7 ± 22.5 58.3 ± 23.3 0.516
Minimum 34.1 ± 25.4 36.4 ± 22.2 0.767
Superior 52.8 ± 25.2 59.8 ± 26.8 0.382
Superotemporal 56.0 ± 22.8 65.8 ± 25.3 0.185
Inferotemporal 55.7 ± 24.9 63.4 ± 24.9 0.307
Inferior 47.8 ± 23.4 49.7 ± 26.1 0.799
Inferonasal 56.1 ± 22.6 52.9 ± 26.6 0.661
Superonasal 53.7 ± 23.0 58.1 ± 28.6 0.559
Values are presented as mean ± standard deviation.
RNFL = retinal nerve fiber layer; GCIPL = ganglion cell and inner plexiform layer.
*Student’s t-test.
revealed that foveal cysts are created in the sensory retina by vitreous traction and develop into full-thickness macu- lar holes as the internal and external walls are disrupted [3,20]. de Sisternes et al. [6] stated that the extent of ellip- soid zone band defects in the foveal and parafoveal regions was a good predictor of postoperative visual acuity recov- ery. Xu et al. [7] reported that macular hole geometry was related to pre- and postoperative visual acuity.
Measurements of the thickness of the macula and RNFL using SD-OCT in healthy eyes and glaucoma patients ex- hibit high levels of repeatability and reproducibility [21,22].
Pinilla et al. [23], who included normal fellow eyes in their study, reported that both time-domain OCT and SD-OCT showed highly reliable repeatability in the measurement of macular thickness.
Many studies on the thickness of the GCIPL are current-
ly ongoing in various ophthalmic fields. Park et al. [24]
stated that the GCIPL of amblyopic eyes is thinner than that of normal eyes, while Kim et al. [25] highlighted an increased thickness of the GCIPL in patients with nonpro- liferative diabetic retinopathy after panretinal photocoagu- lation. In addition, some studies have reported a high re- producibility of GCIPL measurements using SD-OCT in patients with glaucoma [24,26]. Conversely, other studies have shown that autosegmented measurements demon- strate a high tendency to be erroneous in nonhealthy pa- tients. Lee et al. [13] reported that macular contour change with epiretinal membrane results in low repeatability and a tendency to measure thinner GCIPL values using SD-OCT.
Xu et al. [7] stated that errors in segmentation occurred predominantly at the edge of the macular hole boundary, where there was greater irregularity of the shape of the Table 4. Comparison of measurement values in fellow eye
First measured
value (µm) Second measured
value (µm) ICC COV
(%) TRV
(µm)
Macular thickness (μm) Central 251.1 ± 33.8 251.7 ± 31.4 0.995 1.2 2.4
Inner superior 319.5 ± 23.3 320.9 ± 23.7 0.994 0.8 2.1
Inner temporal 312.4 ± 31.1 314.2 ± 23.3 0.956 1.0 1.9
Inner inferior 313.6 ± 31.6 317.5 ± 25.3 0.922 1.0 2.9
Inner nasal 319.4 ± 28.6 321.5 ± 25.6 0.981 0.8 2.7
Outer superior 279.0 ± 21.0 276.5 ± 19.8 0.970 0.8 2.8
Outer temporal 270.0 ± 23.1 271.9 ± 22.0 0.962 0.9 1.7
Outer inferior 263.6 ± 18.5 265.3 ± 17.4 0.996 0.6 1.7
Outer nasal 295.4 ± 18.6 296.3 ± 22.3 0.968 0.7 1.8
RNFL thickness (μm) Average 94.1 ± 11.4 93.1 ± 10.0 0.966 1.2 0.9
Superior 110.8 ± 19.5 105.6 ± 17.5 0.883 1.6 1.6
Temporal 70.2 ± 13.0 69.3 ± 12.6 0.982 1.8 1.2
Inferior 118.5 ± 19.5 119.2 ± 15.5 0.845 1.6 2.1
Nasal 68.3 ± 15.9 68.5 ± 12.1 0.978 2.1 1.4
GCIPL thickness (μm) Average 77.5 ± 8.1 77.0 ± 7.9 0.998 1.9 0.7
Minimum 68.9 ± 9.8 69.0 ± 9.3 0.991 2.6 1.3
Superior 79.0 ± 7.3 78.9 ± 8.3 0.981 2.0 1.6
Superotemporal 78.5 ± 7.3 78.3 ± 7.8 0.996 1.8 0.8
Inferotemporal 78.9 ± 11.5 79.0 ± 11.1 0.998 2.0 0.7
Inferior 73.6 ± 7.8 74.0 ± 7.0 0.984 2.1 1.5
Inferonasal 76.0 ± 8.7 76.7 ± 7.3 0.985 2.1 1.8
Superonasal 79.6 ± 8.7 79.7 ± 9.2 0.991 2.2 1.2
Values are presented as mean ± standard deviation.
ICC = intraclass correlation coefficient; COV = coefficient of variation; TRV = test-retest variability; RNFL = retinal nerve fiber layer;
GCIPL = ganglion cell and inner plexiform layer.
segmentation result. However, few studies have evaluated the repeatability of measurement of the GCIPL thickness according to macular defect in patients with retinal disease.
The thicknesses of the GCIPL as measured by automatic segmentation of the retina can be affected by edema or at- rophy of the retina. In particular, automatic segmentation algorithm errors frequently occur in patients with macular site defects such as macular holes as well as in patients with changes in the shape of the macula due to cystic alterations.
In the present study, the macula was thicker in the affect- ed eyes than in the healthy ones. Furthermore, a compari- son of the affected eyes according to the size of the macu- lar hole showed no significant correlations between the size of the macular hole and the thickness of the macula. This is because the macular hole size is mainly determined by tractional force during the development of the macular hole
and because the thickness of the central macula increases as the edge of the macular hole thickens with cystic degen- eration [27,28].
The thickness of the GCIPL in affected eyes was 56.1 ± 23.4 µm, which was significantly thinner than the corre- sponding value in healthy eyes (77.1 ± 12.8 µm). The thick- nesses of the GCIPL in groups A and B were 53.7 ± 22.5 and 58.3 ± 23.3 µm, with no significant differences be- tween them. When analyzing the thickness of the GCIPL using the ganglion cell analysis algorithm, oval areas with a horizontal diameter of 1.0 mm and a vertical diameter of 1.2 mm based on the center of the macular area were ex- cluded. Therefore, if the size of the macular hole exceeds 1.2 mm, then the thickness could decrease due to the mac- ular defect; notably, though, the measurement would not be affected by such a defect for a macular hole of ≤400 µm.
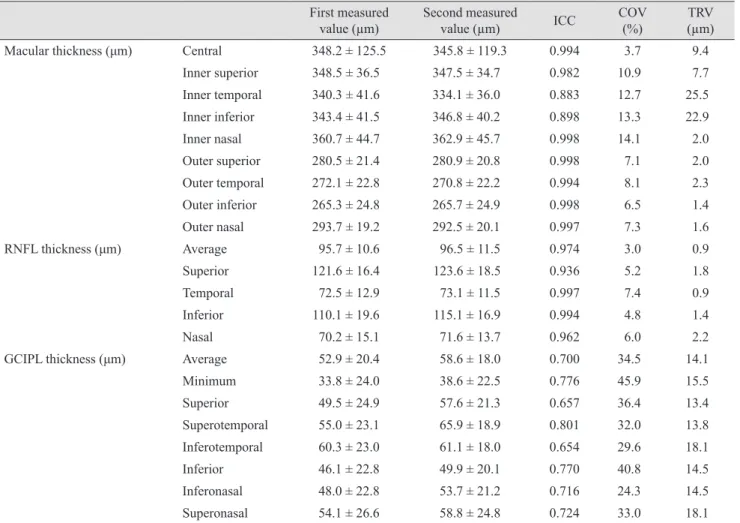
Table 5. Comparison of measurement values in patients with macular holes First measured
value (µm) Second measured
value (µm) ICC COV
(%) TRV
(µm)
Macular thickness (μm) Central 348.2 ± 125.5 345.8 ± 119.3 0.994 3.7 9.4
Inner superior 348.5 ± 36.5 347.5 ± 34.7 0.982 10.9 7.7
Inner temporal 340.3 ± 41.6 334.1 ± 36.0 0.883 12.7 25.5
Inner inferior 343.4 ± 41.5 346.8 ± 40.2 0.898 13.3 22.9
Inner nasal 360.7 ± 44.7 362.9 ± 45.7 0.998 14.1 2.0
Outer superior 280.5 ± 21.4 280.9 ± 20.8 0.998 7.1 2.0
Outer temporal 272.1 ± 22.8 270.8 ± 22.2 0.994 8.1 2.3
Outer inferior 265.3 ± 24.8 265.7 ± 24.9 0.998 6.5 1.4
Outer nasal 293.7 ± 19.2 292.5 ± 20.1 0.997 7.3 1.6
RNFL thickness (μm) Average 95.7 ± 10.6 96.5 ± 11.5 0.974 3.0 0.9
Superior 121.6 ± 16.4 123.6 ± 18.5 0.936 5.2 1.8
Temporal 72.5 ± 12.9 73.1 ± 11.5 0.997 7.4 0.9
Inferior 110.1 ± 19.6 115.1 ± 16.9 0.994 4.8 1.4
Nasal 70.2 ± 15.1 71.6 ± 13.7 0.962 6.0 2.2
GCIPL thickness (μm) Average 52.9 ± 20.4 58.6 ± 18.0 0.700 34.5 14.1
Minimum 33.8 ± 24.0 38.6 ± 22.5 0.776 45.9 15.5
Superior 49.5 ± 24.9 57.6 ± 21.3 0.657 36.4 13.4
Superotemporal 55.0 ± 23.1 65.9 ± 18.9 0.801 32.0 13.8
Inferotemporal 60.3 ± 23.0 61.1 ± 18.0 0.654 29.6 18.1
Inferior 46.1 ± 22.8 49.9 ± 20.1 0.770 40.8 14.5
Inferonasal 48.0 ± 22.8 53.7 ± 21.2 0.716 24.3 14.5
Superonasal 54.1 ± 26.6 58.8 ± 24.8 0.724 33.0 18.1
Values are presented as mean ± standard deviation.
ICC = intraclass correlation coefficient; COV = coefficient of variation; TRV = test-retest variability; RNFL = retinal nerve fiber layer;
GCIPL = ganglion cell and inner plexiform layer.
However, we found no statistically significant differences between them. The degree of GCIPL thinning was consid- ered to be caused by the boundary of the GCIPL, which was erroneously segmented to be thinner than its actual size because of deformation of the macula, rather than sec- ondary to the influence of the macular hole-induced defect (Fig. 2).
The ICCs for the thicknesses of the central macula, RNFL, and GCIPL of the affected eyes were 0.994, 0.974, and 0.700, respectively. Thus, when measuring the thick- ness of the central macula and RNFL, the ICC was >0.950 with high repeatability; however, when measuring the GCIPL, the repeatability was low (Table 5). This finding likely resulted from the measurement errors of automatic segmentation caused by deformation of the macula in the affected eyes. Another contributing factor may have been difficulties in the repeated measurement of the same part
caused by instability of fixation secondary to decreased vi- sual acuity accompanied by the macular hole.
There are several limitations in this study. First, because the purpose of the present study was to evaluate the repeat- ability of OCT measurement by automated analysis with- out manual adjustment, there could be some measurement error in the central macula, RNFL, and GCIPL thickness- es. Second, it is difficult to apply this method to short eyes (axial length <23.6 mm) or long eyes (axial length >25.5 mm). Further investigations are needed in patients with various axial lengths. Third, we did not evaluate the char- acteristics of macular hole morphology and the pattern of autosegmentation error. Additional research should be con- ducted in order to determine the relationship between GCI- PL thickness and the pattern of autosegmentation error.
In conclusion, the central macula, peripapillary RNFL, and GCIPL were thicker, similar, and thinner, respectively,
Difference in CMT
Mean of CMT of M1 and M2 100
Mean 0.71 50
30 10 -10 -30
-50
200 300 400 500 600
Difference in RNEL thickness
Mean of RNFL of M1 and M2 60
Mean 0.23 20
15 10 5 0 -5
-10
70 80 90 100 110 120
Difference in GCIPL thickness
Mean of GCIPL of M1 and M2
Mean -5.15 50
30 10 -10 -30 -50
-70
20 40 60 80
A
Difference in CMT
Mean of CMT of M1 and M2 100
Mean 0.71 50
30 10 -10 -30
-50
200 300 400 500 600
Difference in RNEL thickness
Mean of RNFL of M1 and M2 60
Mean 0.23 20
15 10 5 0 -5
-10
70 80 90 100 110 120
Difference in GCIPL thickness
Mean of GCIPL of M1 and M2
Mean -5.15 50
30 10 -10 -30 -50
-70
20 40 60 80
Fig. 3. Blan-Altman plot showing the repeatability of measure- ments of the central macular thickness (CMT), retinal nerve fiber layer (RNFL), and ganglion cell and inner plexiform layer (GCI- PL). The solid line indicates the average mean difference, while the dotted lines lineate the 95% confidence limits of agreement.
(A) Bland-Altman plot for the measurements of CMT. The mean difference is 0.71. The 95% limits of agreement are -8.05 to 9.47. (B) Bland-Altman plot for the measurements of RNFL average thick- ness. The mean difference is 0.24. The 95% limits of agreement are -1.15 to 1.62. (C) Bland-Altman plot for the measurements of GCIPL thickness. The mean difference is -5.15. The 95% limits of agreement are -21.67 to 11.37. M1 = first measurement; M2 = sec- ond measurement.
C
B
in eyes with macular holes than in the opposite healthy eyes according to SD-OCT evaluation. The repeatability of thickness measurements was lower for the GCIPL than for the central macula and RNFL. Macular contour change with the macular hole results in low repeatability and a tendency to measure thinner GCIPL values using SD-OCT.
This may be attributed to unstable fixation with decreased visual acuity and retinal segmentation error due to macular deformation. The impact of changes in the macular shape caused by the presence of macular holes should be taken into consideration when measuring the GCIPL thickness in patients with various eye diseases such as glaucoma and in those with neuro-ophthalmic disorders.
Conflict of Interest
No potential conflict of interest relevant to this article was reported.
References
1. la Cour M, Friis J. Macular holes: classification, epidemiol- ogy, natural history and treatment. Acta Ophthalmol Scand 2002;80:579-87.
2. Knapp H. About isolated ruptures of the choroid as a result of trauma on the eyeball [Uber isolierte Zerreissungen der Aderhaut in Folge von Traumen auf dem Augapfel]. Arch Augenheilkd 1869;1:6-29.
3. Gass JD. Reappraisal of biomicroscopic classification of stages of development of a macular hole. Am J Ophthalmol 1995;119:752-9.
4. Gaudric A, Haouchine B, Massin P, et al. Macular hole formation: new data provided by optical coherence tomog- raphy. Arch Ophthalmol 1999;117:744-51.
5. Hee MR, Puliafito CA, Wong C, et al. Optical coherence tomography of macular holes. Ophthalmology 1995;102:748- 56.
6. de Sisternes L, Hu J, Rubin DL, Leng T. Visual prognosis of eyes recovering from macular hole surgery through au- tomated quantitative analysis of spectral-domain optical coherence tomography (SD-OCT) scans. Invest Ophthalmol Vis Sci 2015;56:4631-43.
7. Xu D, Yuan A, Kaiser PK, et al. A novel segmentation al- gorithm for volumetric analysis of macular hole boundaries
identified with optical coherence tomography. Invest Oph- thalmol Vis Sci 2013;54:163-9.
8. Krebs I, Hagen S, Brannath W, et al. Repeatability and re- producibility of retinal thickness measurements by optical coherence tomography in age-related macular degeneration.
Ophthalmology 2010;117:1577-84.
9. Mwanza JC, Budenz DL, Godfrey DG, et al. Diagnostic performance of optical coherence tomography ganglion cell: inner plexiform layer thickness measurements in early glaucoma. Ophthalmology 2014;121:849-54.
10. Mwanza JC, Oakley JD, Budenz DL, et al. Macular gan- glion cell-inner plexiform layer: automated detection and thickness reproducibility with spectral domain-optical co- herence tomography in glaucoma. Invest Ophthalmol Vis Sci 2011;52:8323-9.
11. Moon H, Yoon JY, Lim HT, Sung KR. Ganglion cell and inner plexiform layer thickness determined by spectral do- main optical coherence tomography in patients with brain lesions. Br J Ophthalmol 2015;99:329-35.
12. Francoz M, Fenolland JR, Giraud JM, et al. Reproducibili- ty of macular ganglion cell-inner plexiform layer thickness measurement with cirrus HD-OCT in normal, hypertensive and glaucomatous eyes. Br J Ophthalmol 2014;98:322-8.
13. Lee HJ, Kim MS, Jo YJ, Kim JY. Thickness of the macula, retinal nerve fiber layer, and ganglion cell layer in the epiret- inal membrane: the repeatability study of optical coherence tomography. Invest Ophthalmol Vis Sci 2015;56:4554-9.
14. Hirasawa K, Shoji N, Yoshii Y, Haraguchi S. Determination of axial length requiring adjustment of measured circump- apillary retinal nerve fiber layer thickness for ocular magni- fication. PLoS One 2014;9:e107553.
15. Folio LS, Wollstein G, Ishikawa H, et al. Variation in optical coherence tomography signal quality as an indicator of ret- inal nerve fibre layer segmentation error. Br J Ophthalmol 2012;96:514-8.
16. Cantrill HL. The diabetic retinopathy study and the early treatment diabetic retinopathy study. Int Ophthalmol Clin 1984;24:13-29.
17. Muller R, Buttner P. A critical discussion of intraclass cor- relation coefficients. Stat Med 1994;13:2465-76.
18. Bland JM, Altman DG. Statistical methods for assessing agreement between two methods of clinical measurement.
Lancet 1986;1:307-10.
19. Barak Y, Ihnen MA, Schaal S. Spectral domain optical coherence tomography in the diagnosis and manage- ment of vitreoretinal interface pathologies. J Ophthalmol
2012;2012:876472.
20. Takahashi H, Kishi S. Tomographic features of a lamel- lar macular hole formation and a lamellar hole that pro- gressed to a full-thickness macular hole. Am J Ophthalmol 2000;130:677-9.
21. Liu X, Shen M, Huang S, et al. Repeatability and reproduc- ibility of eight macular intra-retinal layer thicknesses deter- mined by an automated segmentation algorithm using two SD-OCT instruments. PLoS One 2014;9:e87996.
22. Budenz DL, Fredette MJ, Feuer WJ, Anderson DR. Re- producibility of peripapillary retinal nerve fiber thickness measurements with stratus OCT in glaucomatous eyes.
Ophthalmology 2008;115:661-6.
23. Pinilla I, Garcia-Martin E, Fernandez-Larripa S, et al. Re- producibility and repeatability of Cirrus and Spectralis Fou- rier-domain optical coherence tomography of healthy and epiretinal membrane eyes. Retina 2013;33:1448-55.
24. Park KA, Park DY, Oh SY. Analysis of spectral-domain op-
tical coherence tomography measurements in amblyopia: a pilot study. Br J Ophthalmol 2011;95:1700-6.
25. Kim JJ, Im JC, Shin JP, et al. One-year follow-up of macular ganglion cell layer and peripapillary retinal nerve fibre layer thickness changes after panretinal photocoagulation. Br J Ophthalmol 2014;98:213-7.
26. Garas A, Vargha P, Hollo G. Reproducibility of retinal nerve fiber layer and macular thickness measurement with the RTVue-100 optical coherence tomograph. Ophthalmolo- gy 2010;117:738-46.
27. Ullrich S, Haritoglou C, Gass C, et al. Macular hole size as a prognostic factor in macular hole surgery. Br J Ophthalmol 2002;86:390-3.
28. Kusuhara S, Teraoka Escano MF, Fujii S, et al. Prediction of postoperative visual outcome based on hole configuration by optical coherence tomography in eyes with idiopathic macular holes. Am J Ophthalmol 2004;138:709-16.