51
Journal of Oral Biology
Mechanism Underlying NaF-Induced Apoptosis in Human Oral Squamous Cell Carcinoma
Young-Joo Hur, Do-Kyun Kim, Seung-Eun Lee, In-Ryoung Kim, Na-Young Jeong
1, Ji-Young Kim
1, and Bong-Soo Park
*Department of Oral Anatomy, School of Dentistry, Pusan National University
1Department of Anatomy, College of Medicine, Dong-A University (received May 6, 2010 ; revised June 3, 2010 ; accepted June 4, 2010)
Few studies have evaluated the apoptosis-inducing efficacy of NaF on cancer cells
in vitrobut there has been no previous investigation of the apoptotic effects of NaF on human oral squamous cell carcinoma cells. In this study, we have investi- gated the mechanisms underlying the apoptotic response to NaF treatment in the YD9 human squamous cell carcinoma cell line. The viability of YD9 cells and their growth inhibition were assessed by MTT and clonogenic assays, respectively.
Hoechst staining, DNA electrophoresis and TUNEL staining were conducted to detect apoptosis. YD9 cells were treated with NaF, and western blotting, immunocytochemistry, confocal microscopy, FACScan flow cytometry, and MMP and proteasome activity assays were performed sequentially.
The NaF treatment resulted in a time- and dose-dependent decrease in YD9 cell viability, a dose-dependent inhibition of cell growth, and the induction of apoptotic cell death. The apoptotic response of these cells was manifested by nuclear condensation, DNA fragmentation, the reduction of MMP and proteasome activity, a decreased DNA content, the re- lease of cytochrome c into the cytosol, the translocation of AIF and DFF40 (CAD) into the nucleus, a significant shift of the Bax/Bcl-2 ratio, and the activation of caspase-9, caspase- 3, PARP, Lamin A/C and DFF45 (ICAD). Furthermore, NaF treatment resulted in the downregulation of G1 cell cycle- related proteins, and upregulation of p53 and the Cdk inhibi- tor p27
KIP1. Taken collectively, our present findings demon- strate that NaF strongly inhibits YD9 cell proliferation by modulating the expression of G1 cell cycle-related proteins
and inducing apoptosis via mitochondrial and caspase pathways.
Key words: NaF (sodium fluoride), apoptosis, YD9 human oral squamous cell carcinoma cell line, cell cycle-related proteins
Introduction
Fluoride is extensively distributed in water, soils, and the atmosphere. Human beings and animals are constantly exposed to fluoride compounds. The principal sources of fluoride ingestion are from the drinking water or beverages produced with fluoride-containing dental products and eating food (WHO, 1994; David, 2001). Fluoride is widely used in dentistry to prevent dental caries, even though the safety of fluoride is controversial. There are no known adverse effects of long-term fluoride ingestion for caries prevention. But an overdose can cause serious acute toxicity (Li, 1993; Lee
et al., 2008). Nevertheless it is accepted as a important material for oral health.
Apoptosis is an essential physiological process required for embryonic development, regulation of immune responses and maintenance of tissue homeostasis. However, apoptosis is also implicated in a wide range of pathological conditions, including immunological diseases, allergy and cancer (Carson and Ribeiro, 1993; Ohta and Yamashita, 1999). The induction of apoptosis leads to specific morphological and biochemical changes, including cell blebbing, exposure of cell surface phosphatidylserine, cell size reduction including cell shrinkage, chromatin condensation and internucleosomal cleavage of genomic DNA (Wyllie
et al., 1980; Williams, 1991).
*Corresponding author: Bong-Soo Park, Department of Oral
Anatomy, School of Dentistry, Pusan National University, Yangsan,
626-870, Korea. Tel: +82-51-510-8242, Fax: +82-51-510-8241,
E-mail: [email protected]
Carcinoma of the oral cavity, especially oral squamous cell carcinoma (OSCC), are one of the most leading causes of cancer related death and affect nearly 500,000 patients annually world-wide. And OSCC is one of the most malignancies that remain incurable with current therapies (Shen
et al., 2007). Treatment of oral SCC (OSCC) primarily relies on classical therapeutic modalities including surgery, radiation, and chemotherapy or a combination of these methods; yet, the outcome of OSCC has not improved significantly. Therefore, new treatment strategies are of interest, especially the gene therapy. Several gene therapy strategies for OSCC are currently under investigation in the preclinical and clinical settings (K saito
et al., 2009).
It was reported that fluoride induced apoptosis in epithelial lung cells, alveolar macrophages (Hirano and Ando, 1996;
Refsnes
et al., 1999) and human gingival fibroblasts, MDPC-23 odontoblast-like cells (Lee
et al., 2008; Karube
etal
., 2009). And it was also reported fluoride induces apoptosis in such cancer cells as osteosarcoma cells (Hirano and Ando, 1997) and human leukemia HL-60 cells (Anuradha
et al., 2000; Song
et al., 2002). These studies are pursued on the targeted induction of apoptosis to control the unlimited cell growth and proliferation. In addition, induction of apoptosis in the activated cancer cells may be an effective strategic approach to cancer therapy (Lee
et al., 2009).
Although few studies elicited the apoptosis-inducing efficacy of NaF on cancer cells
in vitro, yet there is no report about the apoptotic effect of NaF on human oral sqaumous cell carcinoma cells. The present study was conducted in order to examine the effects of cytotoxicity and cell growth inhibition, and the molecular mechanism underlying the expression alterations of cell cycle-related proteins and apoptosis induction in YD9 human oral squamous cell carcinoma cells treated with NaF
in vitro.
Materials and Methods
Reagents
The following reagents were obtained commercially:
Sodium fluoride (NaF), Dimethyl sulfoxide (DMSO), Hoechst 33342, RNase A, proteinase K, aprotinin, leupeptin, phenylmethylsulfonyl fluoride (PMSF), thiazolyl blue tetrazolium bromide, crystal violet and propidium iodide (PI) were from Sigma (St. Louis, MO, USA); TUNEL reaction mixture was from Roche (Mannheim, Germany); Suc-LLVY- AMC was from Calbiochem (Darmstadt, Germany); 5,5', 6,6'-tetrachloro-1,1',3,3-tetraethylbenzimidazol carbocyanine iodide (JC-1) was from Molecular Probes (Eugene, OR, USA);
Dulbecco's Modified Eagle Medium : Nutrient Mixture F- 12 (1 : 1) (DMEM/F12) and fetal bovine serum (FBS) were from Gibco (Gaithersburg, MD, USA); SuperSignal West Pico enhanced chemiluminescence Western blotting detection reagent was from Pierce (Rockford, IL, USA).
Antibodies
Rabbit polyclonal anti-human AIF antibody was from Upstate (NY, USA); Mouse monoclonal anti-human p27
KIP1, caspase-9, caspase-3, Bax, Bcl-2, cytochrome c, Lamin A/C, DFF45 (ICAD), Cyclin D1, Cdk2, Cdk4, poly(ADP-ribose) polymerase (PARP) antibodies, and rabbit polyclonal anti- human
β-actin antibody, and FITC-conjugated goat anti-mouse and anti-rabbit IgGs were from Santa Cruz Biotechnology (Santa Cruz, CA, USA); Mouse monoclonal anti-human Cyclin D3 was from Cell Signaling (Danver, MA, USA);
Rabbit polyclonal anti-human DFF40 (CAD) antibody was from Stressgen (Ann Arbor, MI, USA); Mouse monoclonal anti-human p53 was from BD biosciences (San Diego, CA, USA); HRP-conjugated sheep anti-mouse and anti-rabbit IgGs were from Amersham GE Healthcare (Little Chalfont, UK).
Cell culture and treatment of CGM
Human oral squamous carcinoma cells (YD9 cells) were kindly provided by Professor Jin Kim (Department of Oral Pathology, College of Dentistry, Yonsei University, seoul, Korea). The cells were maintained at 37
oC with 5% CO
2in air atmosphere in Dulbecco's Modified Eagle Medium : Nutrient Mixture F-12 (1 : 1) (DMEM/F12) with 4 mM L- glutamine, 1.5
µg/L sodium bicarbonate, 4.5 g/L glucose and 1.0 mM sodium pyruvate supplemented with 10% fetal bovine serum (FBS). Cells were cultured on culture dishes and/or several type of wells for 24 h. The original medium was removed and washed with phosphate-buffered saline (PBS). It was changed that the fresh medium on the plates.
NaF (100 mM) stock solution was added to the medium to obtain 1, 1.1, 1.2, 1.3, 1.4, 1.5, 1.6, 1.7, 1.8, 1.9, 2 mM con- centrations of the drug.
MTT assay
The cells were cultured in a 96-well plate and incubated for 24 h. The cells were treated with various concentrations and time points of NaF. And then cells were treated with 500
µg/
ml of MTT stock solution. After the cells were incubated at 37
oC with 5% CO
2for 4 h. The medium was aspirated and formed formazan crystals were dissolved in the mixture solution of DMSO and absolute ethanol (1 : 1). Cell viability was monitored on a ELISA reader (Tecan, Männedorf, Switzerland) at 570 nm excitatory emission wavelength.
Since viability assays demonstrated evident induction of YD9 cell death at 1.4 mM NaF for 48 h, this concentration was utilized for further assessment of apoptosis induced by NaF.
Clonogenic (Colony-forming) assay
Cells were seeded at 2.5
×10
2per well (6-well culture plate) and incubated overnight. The cells were treated with NaF 0, 0.1, 0.2, 0.4, 0.6 and 0.8 mM and it was allowed to grow (7 days). The colonies were then fixed with 100%
methanol and were stained with a filtrated solution of 0.5%
(w/v) crystal violet for 10 min. Wells were washed with tap
water and dried at room temperature. The colonies, defined as
groups of
≥50 cells, were scored manually and photographed under an IMT-2 inverted microscope (Olympus, Tokyo, Japan). Clonogenic survival was expressed as the percentage of colonies formed in NaF-treated cells with respect to control cells. Three independent experiments were performed.
Hoechst staining
After NaF treatment, cells were harvested and cytocen- trifuged onto a clean, fat-free glass slide with a cytocentrifuge.
Cells were stained in 4
µg/ml Hoechst 33342 for 10 min at 37
oC in the dark and were washed twice in PBS. The slides were mounted with glycerol. The samples were observed and photographed under an epifluorescence microscope (Carl Zeiss, Göettingen, Germany). The number of cells that showed condensed or fragmented nuclei was determined by a blinded observer from a random sampling of 3
×10
2cells per experiment. Three independent experiments were conducted.
TUNEL technique
To identify apoptotic cells by terminal deoxynucleotidyl transferase (TDT) - mediated dUTP nick and labelling (TUNEL), An
In SituCell Death Detection Kit was used as recommended by the manufacturer. Cells were harvested after treatment of NaF on 60 mm culture dishes. The cell suspension was centrifuged onto a clean fat-free glass slide with a cytocentrifuge. After fixing with 4% paraform- aldehyde for 1 h and washing with PBS and permeabilizing with 0.1% Triton X-100 solution for 2 min on ice, cells were added with reaction mixture for 1 h at 37
oC. Total cell number, at least 300 cells from each group, was counted under DIC optics. The percentage of TUNEL positive cells were calculated and photographed under epifluorescence microscope (Carl Zeiss, German).
DNA electrophoresis
2
×10
6cells were resuspended in 1.5 ml of lysis buffer [10 mM Tris (pH 7.5), 10 mM EDTA (pH 8.0), 10 mM NaCl and 0.5% SDS] into which proteinase K (200
µg/ml) was added. After samples were incubated overnight at 48
oC, 200
µl of ice cold 5 M NaCl was added and the supernatant containing fragmented DNA was collected after centri- fugation. The DNA was then precipitated overnight at -20
oC in 50% isopropanol and RNase A-treated for 1 h at 37
oC.
The DNA from 10
6cells (15
µl) was equally loaded on each lane of 2% agarose gels in Tris-acetic acid/EDTA buffer containing 0.5
µg/ml ethidium bromide at 50 mA for 1.5 h.
Proteasome activity assay
1
×10
6cells were lysed in proteasome buffer [10 mM Tris-HCl, pH 7.5, 1 mM EDTA, 2 mM ATP, 20% glycerol, and 4 mM dithiothreitol (DTT)], sonicated, and then centrifuged at 13,000 g at 4
oC for 10 min. The supernatant (20
µg of protein) were incubated with proteasome activity buffer [0.05 M Tris-HCl, pH 8.0, 0.5 mM EDTA, 50
µM Suc- LLVY-AMC] for 1 h 37
oC. The intensity of fluorescence of
each solution was measured by a modular fluorimetric system (Spex Edison, NJ, USA) at 380 nm excitatory and 460 nm emission wavelengths. All readings were standardized using the fluorescence intensity of an equal volume of free AMC solution (50
µM).
Western blot analysis
Cells were plated at a density of 2
×10
6cells in 100 mm culture dishes. Cells treated with NaF were washed twice with ice-cold PBS and were centrifuged at 2,000 rpm for 10 min. Total cell proteins were lysed with a RIPA buffer [300 mM NaCl, 50 mM Tris-HCl (pH 7.6), 0.5% TritonX- 100, 2 mM PMSF, 2
µg/ml aprotinin and 2
µg/ml leupeptin]
and incubated at 4°C for 1 h. The lysates were centrifuged at 14,000 revolutions per min for 15 min at 4°C, and sodium dodecyl sulfate (SDS) and sodium deoxycholic acid (0.2%
final concentration) were added. Protein concentrations of cell lysates were determined with Bradford protein assay (Bio-Rad, Richmond, CA, USA) and BSA was used as a protein standard. A sample of 50
µg protein in each well was separated and it was loaded onto 7.5-15% SDS/PAGE. The gels were transferred to Nitrocellulose membrane (Amersham GE Healthcare, Little Chalfont, UK) and reacted with each antibody. Immunostaining with antibodies was performed using SuperSignal West Pico enhanced chemiluminescence substrate and detected with Alpha Imager HP (Alpha Innotech, Santa Clara, USA). Equivalent protein loading was confirmed by Ponceau S staining.
Measurement of mitochondrial membrane potential (MMP)
JC-1 was added directly to the cell culture medium (1
µM final concentration) and incubated for 15 min. Flow cytometry to measure MMP was performed on a CYTOMICS FC500 flow cytometry system (Beckman Coulter, Brea, CA, USA).
Data were acquired and analyzed using CXP software version 2.2. The analyzer threshold was adjusted on the FSC channel to exclude noise and most of the subcellular debris.
Immunofluorescent staining
Cells were placed on slides by cytocentrifuge and fixed for 10 min in 4% paraformaldehyde. After blocking nonspecific binding with 3% bovine serum albumin, the cells were incubated with a primary antibody at a dilution of 1 : 100 for 1 h. After the incubation, the cells were washed 3 each for 5 min, and then incubated with FITC-conjugated secondary antibody at a dilution of 1 : 100 for 1 h at room temperature.
Fluorescent images were observed and analyzed under Zeiss LSM 510 laser-scanning confocal microscope (Göettingen, Germany).
Flow cytometry analysis
Cells were seeded into a 6-well plate at 1
×10
6cells/ml
and incubated overnight. Cells treated with NaF were
incubated for various time points. In each time point, the
harvested cells were washed with PBS containing 1% bovine serum albumin and centrifuged at 2,000 rpm for 10 min. The cells were resuspended ice-cold 95% ethanol with 0.5%
Tween 20 to a final concentration of 70% ethanol. Fixed cells were pelleted, and washed in 1% BSA-PBS solution.
Cells were resuspended in 1 ml PBS containing 20
µg/ml RNase A, incubated at 4
oC for 30 min, washed once with BSA-PBS, and resuspended in PI solution (10
µg/ml). After cells were incubated at 4
oC for 5 min in the dark, DNA content were measured on a CYTOMICS FC500 flow cytometry system (Beckman Coulter, FL, CA, USA) and data was analyzed using the Multicycle software which allowed a simultaneous estimation of cell-cycle parameters and apoptosis.
Statistical analysis
Three independent experiments were performed for each experimental group and each experiment was performed in triplicate. The results of the experimental and control groups were cpmpared for statistical significance (p < 0.01 and 0.05) using paired T-test statistical method by SPSS for Win 12.0 for summary data.
Results
Effects of NaF on the viability and proliferation of the YD9 cells
The cytotoxic effect of NaF was performed to measure the
viability of YD9 cells by MTT assay. After NaF treatment on YD9 cells (0 to 2 mM) at 48 h, the cell viability was reduced at the concentrations of 1 mM (96.2%) to 2 mM (33.4%) of NaF (Fig. 1A). After 1.4 mM NaF treatment, the cell viabil- ity was shown in a time-dependent manner (24 h, 94.6%;
48 h, 50.0%; 72 h, 20.2%) (Fig. 1B). Hence, the half maximal inhibitory concentration (IC
50) of NaF was at the 1.4 mM for 48 h. This concentration was utilized for further assessment of apoptosis and alternation of the cell cycle-related proteins.
To investigate whether NaF inhibited the growth of YD9 cells, clonogenic assay was performed. After exposure to NaF concentrations (0 to 0.8 mM) on YD9 cells for 7 days, the inhibition of colony formation was determined and was shown in Fig. 1C and 1D. The growth of NaF-treated group was determined by percentage of control. The values on colony formation were 76.5% (0.1 mM NaF treated cells), 60.7% (0.2 mM NaF treated cells), 42.1% (0.4 mM NaF treated cells), 16.3% (0.6 mM NaF treated cells), 6.8%
(0.8 mM NaF treated cells).
Morphological and biochemical changes in NaF treated YD9 cells
YD9 cells treated with NaF at 1.4 mM resulted in morpho- logical and biochemical changes associated with apoptosis.
Hoechst stain demonstrated that NaF induced a change in nuclear morphology. Compared with the typical round nuclei of the control cells, YD9 cells treated with 1.4 mM NaF over a period of 72 h displayed condensed and fragmented nuclei (Fig. 2A & 2B). DNA fragmentation which is the biochemical
Fig. 1.
Effects of cytotoxicity and growth inhibition in NaF-treated YD9 cells as determined by MTT assay (A and B) and clonogenic assay (C and D). (A) YD9 cells were treated with NaF (0~2 mM) for 48 h. The viability of YD9 cells were decreased in a does-dependent manner (1~2 mM, p < 0.05). (B) MTT assay of YD9 cells treated with 1.4 mM NaF at various time points. YD9 cells showed the remarkable reduc- tion of viability in a time-dependent manner (48 h, p < 0.05; 72 h, p < 0.01). Result is expressed as percentage of the control ± SD of three separate experiments. (C and D) The effect of growth inhibition on YD9 cells was examined by clonogenic assay. YD9 cells were cultured in the presence of the indicated concentrations (0 to 0.8 mM) of NaF for 7 days. (C) The photograph showing colony formation in YD9 cells.
(D) The growth of NaF treated groups is expressed as percentage of the control. Note that NaF at low concentrations significantly inhibited
the growth of YD9 cells (0.1~0.4 mM, p < 0.05; 0.6~0.8 mM, p < 0.01). Values are means ± SD of triplicates of each experiment.
Fig. 2.
Demonstration of apoptosis in YD9 cells treated with 1.4 mM NaF at various time point. (A) Immunofluorescent micrographs after Hoechst staining. Control cells showing round-shape nuclei (upper left panel). Cells treated with NaF over a period 72 h show the production of nuclear condensation (clockwise order). Note many condensed nuclei (arrows). (B) The values are the mean ± SD of the mean of apoptotic cells as determined by Hoechst staining. The results presented are representatives of three independent experiments (48~72 h, p < 0.01). (C and D) TUNEL assay. (C) YD9 cells were treated with 1.4 mM NaF at various time point. TUNEL positive cells in control group (0 h) were not shown. Numerous TUNEL positive cells increased in a time-dependent manner. Scale bar, 10
µm. (D) The values are the mean ± SD of the means of TUNEL positive cells as determined by TUNEL method. The each result was obtained by three times experiments (24~72 h, p < 0.01). (E) DNA fragmentation was demonstrated by DNA electrophoresis. Cells treated with 1.4 mM NaF for 24 h showed no DNA lad- der, but 48 h and 72 h groups showed DNA degradation characteristic of apoptosis with a ladder pattern of DNA fragments.
Fig. 3.
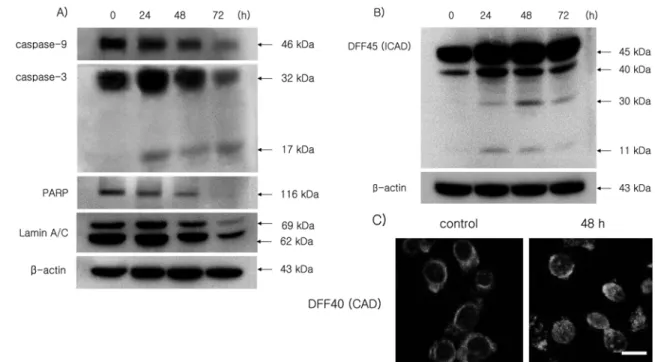
Western blot analyses (A and B) of caspase-9, caspase-3, PARP, Lamin A/C and DFF45, confocal microscopy (C), and proteasome
activity assay in YD9 cells treated with 1.4 mM NaF. (A) NaF treatment induced caspase-9, PARP and Lamin A/C degradation, and produced
caspase-3 17 kDa cleaved products. The levels of
β-actin were used as an internal standard for quantifying caspase-9, caspase-3, PARP and
Lamin A/C expression. (B) NaF treatment induced the activation of DFF45 (ICAD). DFF45 (ICAD) induced cleaved products (30 kDa and
11 kDa). The levels of
β-actin were used as an internal standard for quantifying DFF45 (ICAD) expression. (C) Confocal microscopy show-
ing that DFF40 (CAD) translocated from cytosol into nuclei. Scale bar, 10
µm.
hallmark of apoptosis, was demonstrated by TUNEL technique and DNA electrophoresis. There were no TUNEL positive YD9 cells in the control group but the number of TUNEL positive YD9 cells treated with 1.4 mM NaF increased in a time-dependent manner (Fig. 2C & 2D). And YD9 cells treated with 1.4 mM NaF at various time points showed DNA ladder by DNA electrophoresis (Fig. 2E). The Western blot assay showed that NaF treatment at various time points induced degradation of caspase-9, PARP and lamin A/C, and produced caspase-3 17 kDa, and DFF45 30 kDa and 11 kDa cleaved products (Fig. 3A & 3B). And confocal microscopy showed that NaF led to the trans- location of DFF40 (CAD) from cytosol into nuclei (Fig. 3C).
Proteasome activity in YD9 cells treated with NaF In order to investigate the inhibition effect of proteasome activity at 1.4 mM NaF, proteasome activity assay was employed. In this assay, NaF gradually abolished proteasome activity slightly in a time-dependent manner (data not shown).
Mitochondrial events were closely associated with NaF- induced apoptosis of YD9 cells
Induction of apoptosis is regulated by Bcl-2 family mem-
bers. Bcl-2 has a function of anti-apoptosis, whereas Bax promotes apoptosis. And also, pro-apoptotic Bcl-2 family such as Bax, Bad and Bid induces loss of mitochondrial membrane potential (
∆ψm) and release of cytochrome c and AIF. A Western blot assay was performed in order to examine the role of Bcl-2 family proteins in NaF-induced apoptosis. Up-regulation of Bax and down-regulation of Bcl-2 were shown in a time-dependent manner (Fig. 4A).
The mitochondria were stained with JC-1 dye, and the mitochondrial membrane potential (
∆ψm) was measured by flow cytometry. YD9 cells treated with 1.4 mM NaF showed the loss of mitochondrial membrane potential (
∆ψm) in a time-dependent manner (Fig. 4B). Confocal microscopy was conducted to examine whether AIF and cytochrome c are released in the mitochondria or not, AIF was translocated from mitochondria to nuclei and cytochrome c was released from mitochondria into the cytosol in YD9 cells treated with 1.4 mM NaF (Fig. 4C & 4D).
Quantification of DNA hypoploidy in YD9 cells treated with NaF
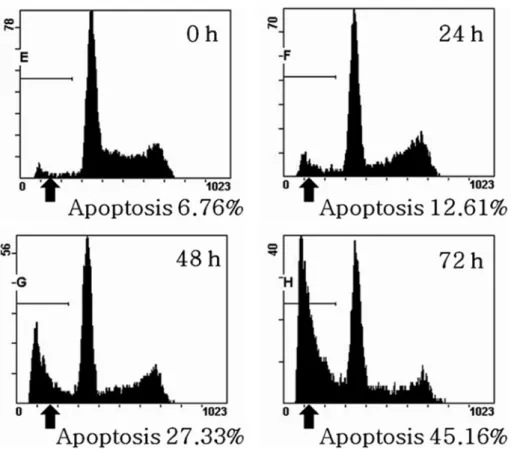
The evaluation of apoptotic percentages was confirmed with flow cytometry analysis. A flow cytometry showed that
Fig. 4.
Demonstration of mitochondrial events in YD9 cells after 1.4 mM NaF treatment. (A) Western blot analysis of Bax and Bcl-2. Pro- apoptotic factor, Bax significantly up-regulated in a time-dependent manner whereas anti-apoptotic factor, Bcl-2 down-regulated. The levels of
β-actin were used as an internal standard for quantifying Bax and Bcl-2 expression. (B) Mitochondrial membrane potential (
∆ψm) at vari- ous time points.
∆ψm was reduced in YD9 cells in a time-dependent manner (24~72 h, p < 0.05).
∆ψm was measured by flow cytometry.
Three independent assays were performed. (C) Confocal microscopy showing that cytochrome c was released from mitochondria into the
cytosol of YD9 cells. Scale bar, 10
µm. (D) Confocal microscopy showing that AIF was released from mitochondria into the cytosol, and that
translocation onto nuclei was evident in YD9 cells. Scale bar, 10
µm.
the treatment of 1.4 mM NaF significantly increased apoptotic cells with DNA hypoploidy compared to the control group (Fig. 5).
Alteration of the cell cycle-related proteins in YD9 cells treated with NaF
To investigate the alteration of cell cycle-related proteins, a Western blot assay was conducted. Western blotting data showed that expression level of Cyclin D1, Cyclin D3, Cdk2 and Cdk4 regulating G0/G1 phase decreased in a time- dependent manner. The expression level of p53 and Cdk inhibitor, p27
KIP1remarkably increased over a period of 72 h (Fig. 6).
Discussion
Human beings and animals are constantly exposed to fluoride compounds. Moreover, the increased use of fluorides in industry, medicine and dentistry exposes human beings to even greater levels of fluoride compounds. Sodium flouride (NaF), one of the most widely used fluoride compounds, revealed no significant cytotoxicity at a lower dose. However, at relatively high doses, NaF induced apoptosis in HL-60 cells. Song
et al. (2002) reported that apoptosis was induced in these cells due to a decrease in Bcl-2 immunoreactivity
levels and a concomitant activation of caspase-3. In addition, fluoride causes cell death in HL-60 cells by activating
Fig. 5.
The kinetic analysis of the effect of 1.4 mM NaF treatment on YD9 cell cycle progression and induction of apoptosis using flow cytometry. Representative DNA histograms are shown. NaF treatment significantly showed the increase of apoptotic cells with DNA hypop- loidy in a time-dependent manner (48 h, p < 0.05; 72 h, p < 0.01). Data shown are representatives of three independent experiments.
Fig. 6.
Western blot analysis of cell cycle-related proteins in YD9
cells treated with 1.4 mM NaF. Cdk2, Cdk4, Cyclin D1, and Cyclin
D3 were down-regulated in a time dependent manner. P53, Cdk
inhibitors, p27
KIP1were remarkably up-regulated in a time-depen-
dent manner. The levels of
β-actin were used as an internal stan-
dard for quantifying p53, p27
KIP1, Cdk2, Cdk4, Cyclin D1 and
Cyclin D3 expression.
caspase-3 which in turn cleaves PARP leading to DNA damage and ultimately to cell death. It was demonstrated that NaF induces apoptosis and that it is mediated by lipid peroxidation. Thus, lipid peroxidation can result in the loss of mitochondrial membrane potential which then leads to the release of cytochrome c from mitochondria, which further initiates the activation of the execution caspases and leads to apoptotic cell death. Furthermore, the down-regulation of Bcl-2 may also lead to the loss of Bcl-2-mediated resistance to apoptosis (Anuradha
et al., 2000; Anuradha
et al., 2001).
The present study investigating the effect of NaF on cell viability in YD9 human oral squamous cell carcinoma cells reveals that NaF produces a dose- and time-dependent reduction on the viability of YD9 cells in MTT assay. In addition, the clonogenic assay (colony forming assay) con- firmed that NaF at 0.1 to 0.8 mM remarkably inhibited the growth of YD9 cells. These data indicate that NaF exerts a specific cytotoxic effect on YD9 cells.
Apoptosis and necrosis are conceptually distinct forms of cell death and can be distinguished by their specific mor- phological changes. During apoptosis, apoptotic cells undergo specific morphological changes such as cell blebbings, reduction in cell size, cell shrinkage, chromatin condensation and DNA fragmentation (Wyllie
et al., 1980; Williams, 1991). In the results of a Hoechst stain, DNA electrophoresis and TUNEL assay, YD9 cells treated with NaF showed apoptotic hallmarks such as the formation of apoptotic bodies, DNA ladder pattern and the increase of TUNEL- positive cells. These results show that NaF induced YD9 cell death via activation of the apoptosis.
Apoptotic stimuli may induce apoptosis by inhibiting the proteasome activity of the target cells (Meng
et al., 1999).
However, other studies have reported that a proteasome inhibitor itself can induce apoptosis in certain cells (Drexler
et al
., 2000). Inhibition of proteasome activity may reduce many types of cancer, so it's pathway is effective in cancer as well as in clinical fields (Lee
et al., 2008). Generally, the proteasome-mediated steps in apoptosis are located at the upstream of mitochondrial changes and caspase activation, and can involve different systems, including various cyclins, p53, NF-
κB, Bax and Bcl-2 (Grimm
et al., 1996; Orlowski, 1999; Li and Dou, 2000). Thus, the possibility existed that NaF may have affected proteasome activity in YD9 cells and induced the mitochondrial pathway of apoptosis. But in this study, the proteasome activity showed the slight reduc- tion in YD9 cells treated with NaF, time-dependently.
Because mitochondria play a crucial role in apoptosis, the induction of the mitochondrial permeability transition plays a key part in the regulation of apoptosis (Kroemer
et al., 1997; Green and Reed, 1998; Susin
et al., 1999; Orrenius, 2004). The mitochondrial pathway can also be triggered by various intracellular and extracellular stress signals, which result in the activation of pro-apoptotic proteins, including Bax and Bak, or inactivation of anti-apoptotic Bcl-2 family members, such as Bcl-2 and Bcl-xL (Orrenius, 2004). As a
result of the activation/inactivation of Bcl-2 family proteins, the changes in mitochondrial membrane lead to the dis- sipation of inner membrane potential and permeabilization of the outer mitochondrial membrane. This, in turn, induces the release of various proapoptotic proteins, such as cyto- chrome c, Smac/Diablo, endonuclease G and AIF (Hengartner, 2000; Barczyk
et al., 2005). The present study showed a significant shift of the ratio of Bax to Bcl-2 in YD9 cells treated with NaF. This result suggests that a shift of the ratio of Bax to Bcl-2 may be the molecular mechanisms by which NaF induces apoptosis of YD9 cells. It has been reported that the pro-apoptotic Bcl-2 family in isolated mitochondria induces cytochrome c release, the loss of mitochondrial membrane potential and results in AIF release (Hunter and Parslow, 1996; Narita
et al., 1998). Cytochrome c release and the disruption of mitochondrial membrane potential (MMP) are known to contribute to apoptosis triggered by proteasome inhibition (Wagenknecht
et al., 2000; Marshansky
et al