• 검색 결과가 없습니다.

Factors Affecting the Stock Price: The Role of Firm Performance

N/A
N/A
Protected

Academic year: 2021

Share "Factors Affecting the Stock Price: The Role of Firm Performance"

Copied!
9
0
0

로드 중.... (전체 텍스트 보기)

전체 글

(1)

Print ISSN: 2288-4637 / Online ISSN 2288-4645 doi:10.13106/jafeb.2021.vol8.no2.0165

Factors Affecting the Stock Price: The Role of Firm Performance

Fatmasari SUKESTI

1

, Imam GHOZALI

2

, Fuad FUAD

3

, Abdul KHARIS ALMASYHARI

4

, Nurcahyono NURCAHYONO

5

Received: November 05, 2020 Revised: December 30, 2020 Accepted: January 08, 2021

Abstract

This study examined the effect of Debt Equity Ratio (DER), Net Profit Margin (NPM), and Size on stock prices with company performance as measured by Return on Assets (ROA) as a mediating variable. The sample used is 136 manufacturing companies listed on the Indonesia Stock Exchange (IDX) in the 2014-2018 period. This research was tested using a Warp PLS statistical test tool to prove the proposed hypothesis. The results showed that DER has a significant negative effect on ROA and a significant positive effect on Stock Price. NPM has a significant positive effect on ROA as well as a significant positive effect on Stock Price. While Size has a significant positive effect on ROA but has no effect on Stock Price. ROA has a significant positive effect on Stock Price. ROA does not act as a mediating variable in the relationship between Size and Stock Price; however, ROA acts as a mediating variable in the DER and Stock Price relationship, as well as, in the relationship between NPM and Stock Price. The implications of the results of this study can be used by investors in making investment decisions, paying attention to the company’s financial aspects, namely DER, NPM, Size, and ROA.

Keywords: Stock Price, Debt Equity Ratio, Net Profit Margin, Size, ROA JEL Classification Code: G30, G32, M41

range of sectors. Indonesia now attracts all eyes of investors interested in grabbing a share of its massive and rapidly growing market. The rapid growth of businesses is directly proportional to the intense business competition in the modern era. Business competition can be fierce, especially in markets with aggressive competitors. Businesses must be able to manage and stand out from competitors which is critical for success. They must redesign business models and seek a greater edge to retain or increase their market positions; this in turn increases performance. Performance affects a company’s value and this value can impact stock prices. The stock price is a relative and proportional value of a company’s worth

Companies that have high value can attract attention and trust from investors. High stock prices reflect the value of the company. According to Laksitaputri (2012), in an efficient capital market, stock prices reflect all relevant information and the market will react if there is a change in the stock price. Stock prices are influenced by fundamental and technical factors. Earnings affect how investors value companies but other indicators are used to predict stock prices. Stock prices are affected by investors’ expectations, attitudes, and sentiments.

1

First Author. [1] Universitas Diponegoro, Indonesia [2] Universitas Muhammadiyah Semarang, Indonesia

2

Universitas Diponegoro, Indonesia

3

Universitas Diponegoro, Indonesia

4

Universitas Muhammadiyah Semarang, Indonesia

5

Corresponding Author. Accounting Department, Universitas Muhammadiyah Semarang, Indonesia [Postal Address: Jl.

Kedungmundu No.18, Kedungmundu, Kec. Tembalang, Kota Semarang, Jawa Tengah 50273, Indonesia]

Email: [email protected]

© Copyright: The Author(s)

This is an Open Access article distributed under the terms of the Creative Commons Attribution Non-Commercial License (https://creativecommons.org/licenses/by-nc/4.0/) which permits unrestricted non-commercial use, distribution, and reproduction in any medium, provided the original work is properly cited.
1. Introduction

The business world has been rapidly developing.

Indonesia Central Statistics Agency in 2016 noted that in the last 10 years the number of businesses has increased by 17.51%, whereas in 2006 there were 22.73 million businesses and in 2016 there were 26.71 million businesses.

As one of the world’s fastest-growing economies, Indonesia

offers significant opportunities for businesses in a wide

(2)

The financials of a particular company are often termed as fundamental factors. Fundamental analysis (FA) is a method of measuring a security’s intrinsic value by examining related economic and financial factors. The financial performance of a company is one of the most important factors affecting stock prices. If the company generates sufficient profits and that is higher than the period before, many investors will be interested in buying shares and this increases stock price (Lee & Zhao, 2014). However, if the company fails to record sufficient profits or incur losses in the period, investors will avoid buying such company’s shares, as well as, investors who have bought the company’s shares before, will sell those shares fearing loss. Investors will often overlook companies with weak financial performance, thereby leading to a downward spiral in the stock price. Thus, investors perform fundamental analysis and based on the outcome would decide whether to invest in the company or not.

One fundamental factor affecting stock prices is Return on Assets (ROA). ROA is an indicator of how profitable a company is relative to its total assets. ROA gives an investor an idea as to how efficient a company’s management is at using its assets to generate earnings. A high ROA shows that the company has a solid performance as far as finance and operation of the company is concerned. A low ROA is not a good sign for the growth of the company. The higher the ROA number, the better, because the company is earning more money on less investment. In addition to ROA, stock prices are also influenced by the company’s debt policy and ability to generate profits which are reflected by Net Profit Margin (NPM). NPM is equal to how much net income or profit is generated as a percentage of revenue. The larger the company, the more it has the ability to make profits and increase the firm value.

Factors affecting stock price have been examined by previous researchers. Companies having high debts can reduce the ability to generate corporate profits because of the high cost of debt. A company with a particularly debt-heavy capital structure makes larger interest payments each year, thereby reducing net profit. This statement was supported by the research from Ullah et al. (2020) who found that debt had a negative and significant effect on ROA. That is, the capital structure debt to equity variable has a negative and significant relationship with financial performance. Capital structure refers to the proportion of debt and equity in the capital configuration of a company. Debt capital can also have a positive effect on profitability. An increase in debt if managed properly by the company would be responded to positively by the market such that changes in capital structure would have a positive effect on the value of the company.

According to Asraf et al. (2017) and Khan et al. (2017), debt policy has a positive effect on financial performance.

The effective use of debt financing results in an increase in revenue that exceeds the expense of interest payments.

Besides, interest payments are tax-deductible, reducing a

company’s overall tax burden. However, Mule et al. (2015) and Chang et al. (2020) stated that capital structure policies negatively affect firm value.

The net profit margin is intended to be a measure of the overall success of a business. The net profit margin is a profitability ratio that expresses the profit from business operations as a percentage of revenue or net sales. Improving the NPM means increasing the amount of profit generated The higher the NPM, the higher the company’s ability to return profits to investors. This information will attract investors to invest in the company. The result of the study by Apsari et al. (2015) showed that NPM had a positive effect on firm value. However, Muliawati and Saifi (2019) stated that NPM had no effect on company value.

Companies that have large assets are considered to have the ability to manage their assets and generate profits by effectively and efficiently managing their assets. The higher the profit, the higher the dividend yield to investors (return on investment). The higher the value of the company will increase the stock price. Mule et al. (2015) and Khan et al. (2017) proved that size had a positive effect on ROA.

Increasing ROA would have a positive effect on firm value (Ng et al., 2020). The results of the above studies differ from a previous study by Eitokpa (2015) who stated that the said company size had a negative effect on ROA. Niresh and Velnampy (2014) said that there was no relationship between company size and ROA. Conflicting research by Awan et al.

(2018) found that company performance had no effect on firm value.

With the existence of inconsistency in the results of previous studies, this study becomes interesting and important. This study will examine the effect of DER, NPM, and Size on the company’s stock price by placing ROA as a mediating variable.

2. Literature Review and Hypothesis Development

2.1. Signaling Theory

The signaling theory developed by Ross (1977) explained how a company should signal potential investors.

This signal gives information about what has been done by

management to realize the owner’s wishes. Signaling theory

assumes that it is necessary to signal investors to how they

perceive the company’s prospects. The announcement of

dividends is predicted to be a signal for investors in the

investment decision-making process. Managers possess

private information about the firm’s attributes not known to

the market. This information is valuable if the investments

in place or opportunities to invest can have a positive

effect on the firm’s future cash flows If the manager can

give a convincing signal, the public will be impressed and

information will be trusted such that this will be reflected in

(3)

the price of the stock. Therefore, it can be concluded because of asymmetric information, giving signals to investors or the public through management decisions becomes very important.

2.2. Stock Price

The stock price is the current price of the share listed/

traded on the stock exchange determined by market participants and by the demand and supply of the relevant shares in the capital market. The stock price of a company reflects the value of the company for the investors so that high stock prices attract the attention of investors to invest capital in the company.

2.3. The Effect of Debt-to-Equity Ratio (DER) on Stock Price

Companies often use debt when constructing their capital structure because it has certain advantages compared to equity financing An advantage of debt financing is tax deductions. Classified as a business expense, the principal and interest payment on that debt may be deducted from the business income taxes. Creditors will get a fixed amount of return, and shareholders do not have to share profits if the company runs well. The firm can choose the optimal capital structure which is the best mix of debt and equity financing that maximizes a company’s market value while minimizing its cost of capital. If the debt cannot be controlled, increasing debt will have an adverse impact on firm value.

The Modigliani and Miller (1963) approach (trade-off theory of leverage) assumes that there are no taxes. This theory recognizes the tax benefits accrued by interest payments.

The interest paid on borrowed funds is tax-deductible. The trade-off theory advocates that a company can capitalize its requirements with debts as long as the cost of distress, that is, the cost of bankruptcy, exceeds the value of the tax benefits.

Therefore, the increased debts, until a given threshold value, will add value to a company. The use of debt is also leverage for the company because it encourages a fixed amount of share capital, while profits increase due to business expansion with debt. Asraf et al. (2017) and Khan et al. (2017) proved that debt policy has a positive effect on firm value. Based on the above explanation, hypothesis 1 is derived below:

H1: DER has a positive effect on Stock Price 2.4. The Effect of Net Profit Margin (NPM) on

Stock Price

High NPM shows that the company’s performance is more productive and is able to effectively control its costs, thereby increasing profits from sales. That is, a higher NPM means that a company is more efficient at converting

sales into actual profit. Increased corporate profits increase investors’ trust to invest in the company, thereby increasing stock prices. Apsari et al. (2014) found evidence that NPM has a positive effect on firm value. Based on the above explanation, hypothesis 2 is derived below:

H2: NPM has a positive effect on Stock Price 2.5. The Effect Size on Stock Price

Big companies that have large amounts of assets tend to be more trusted by investors because they are considered to have the ability to manage the assets efficiently and indicates they are good at converting their investments into profits.

Investors’ confidence in the company can increase the value of the company and the price of the company’s shares. Ha and Minh (2018) stated that there is a positive relationship between company size and firm value. Based on the above explanation hypothesis 3 is derived below:

H3: Size has a positive effect on Stock Price 2.6. The Effect of Return on Assets (ROA) on

Stock Price

ROA shows how effectively the company can make use of its assets to get maximum profit. ROA is measured by the ratio of net income to company assets. A high ROA means the business is able to utilize its resources well in generating income. A higher income means better returns to investors which impacts the stock price. Daeli (2018) and Ng et al.

(2020) showed that the higher ROA influenced company’s performance. Based on the above explanation, hypothesis 4 is derived below:

H4: ROA has a positive effect on stock price

2.7. The Effect of Debt-to-Equity Ratio (DER) on Return on Asset (ROA)

The debt policy of a company will have an impact on its income. While debt does not dilute ownership, interest payments on debt reduce net income and cash flow. Increasing debt causes leverage ratios such as DER to rise. When there is an interruption in revenue, the company’s cash flow will have difficulty meeting its fixed costs, resulting in short-term liquidity risk Debt financing often comes with covenants (clauses), meaning that a firm must meet certain interest coverage and debt-level requirements. The more debt will cause the company’s profit level to decrease and reduce ROA.

Ullah et al. (2020) found that debt negatively affected ROA.

Based on the above explanation, hypothesis 5 is derived below:

H5: DER has a negative effect on ROA

(4)

2.8. The Effect of Net Profit Margin (NPM) on Return on Asset

NPM is a ratio to measures a company’s ability to generate profits at a certain level of sales. ROA is an indicator of how well a company utilizes its assets, by determining how profitable a company is relative to its total assets. The higher the NPM, the higher the company’s financial performance and ROA. Pokharel et al. (2020) proved that NPM had a positive effect on the company’s financial performance. Based on the above explanation, hypothesis 6 is derived below:

H6: NPM has a positive effect on ROA

2.9. The Effect of Size on Return on Asset (ROA) The size of the company is usually described from the assets owned by the company. The bigger the company, the more assets it has which can be used for its operations and generating profits. Ramli et al. (2018) found that firm size had a positive relationship with the company’s performance.

Based on the above explanation, hypothesis 7 is derived below:

H7: Size has a positive effect on ROA

2.10. The Effect of Mediation of Return on Asset (ROA) on the Relationship between Debt-to- Equity Ratio (DER) and Stock Price

The ability of a company to manage its debt well will increase its ability to generate profits. The increase in profits will improve the value of the company, thereby increasing stock price. This is a positive signal in the market that will attract investors. According to Barbosa and Louri (2003), debt is often cheaper than equity, and interest payments are tax-deductible.

Therefore, as the level of debt increases, returns to equity owners also increase, thereby enhancing the company’s value.

This value can impact stock prices. The stock price is a relative and proportional value of a company’s worth. Companies that have high value can attract attention and trust from investors.

Based on the above explanation, hypothesis 8 is derived below:

H8: ROA mediates the relationship between DER and Stock Price

2.11. The Effect of Mediation of Return on Asset (ROA) on the Relationship between Net Profit Margin (NPM) and Stock Price

The ability of a company to generate profits will affect the rate of return to investors. ROA gives investors an idea

of how effective the company is in converting the money it invests into net income. A higher ROA indicates the company is earning more money on less investment. This is a positive signal to investors and affects the company’s stock price. Based on the above explanation, hypothesis 9 is derived below:

H9: ROA mediates the relationship between NPM and Stock Price

2.12. The Effect of Mediation of Return on Asset (ROA) on the Relationship between Size and Stock Price

The size of the company will affect the company’s ability to use its assets to generate profits. Big firms are more effective than small firms since they make use of the scale of the economy. Economies of scale are cost advantages reaped by companies when production becomes efficient. Companies can achieve economies of scale by increasing production and lowering costs, thereby generating more profits. When profit increases, investors get higher returns. Investors may buy more stocks when they get higher returns, thus impacting stock price. Khan et al. (2017) and Vo (2019) proved that size has a positive effect on ROA and enhances the company’s financial performance which affects the firm value and stock price. Based on the above explanation, hypothesis 10 is derived below:

H10: ROA mediates the relationship between Size and Stock Price

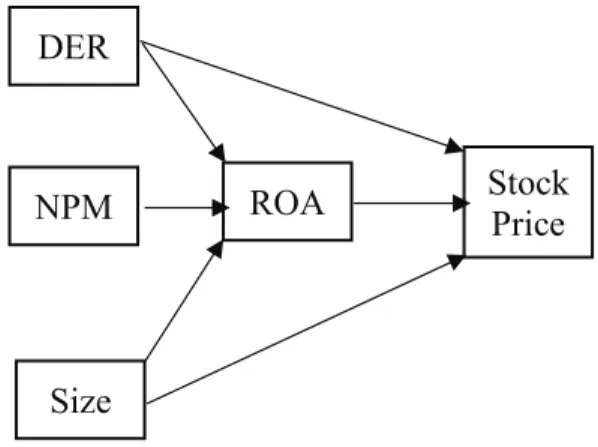
The research model is presented in Figure 1.

DER

NPM

Size

ROA Stock

Price

Figure 1: Research Framework

(5)

3. Research Method

The samples used are 136 manufacturing companies listed on the Indonesia Stock Exchange (IDX) in the 2014- 2018 period. The sampling technique used is purposive sampling, which is a sampling technique that uses certain criteria in determining the sampling unit to be analyzed. The sampling criteria used in this study are:

1. Companies listed on the IDX in the year of observation.

2. Companies that issued financial statements in the year of observation.

3.1. Variable Measurement

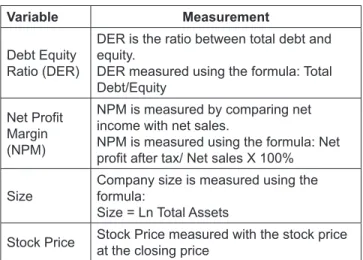
Measurement of research variables was presented in Table 1.

3.2. Data Analysis

Data collected from the annual report companies on the website www.idx.co.id. This research data analysis method uses Partial Last Square (PLS). According to Hair et al. (2010), PLS is appropriate to reduce data, namely by determining the minimum number of factors needed to calculate the maximum proportion of the total variance represented. Data analysis using SEM-PLS according to Sholihin and Ratmono (2013) begins with (1) conceptualization of the model, (2) determining the algorithmic analysis model, (3) determining the resampling method, (4) drawing a path diagram, (5) evaluating the model. This research model can be formulated as follows:

ROA = β1 DER + β2 NPM + β3 Size + ε

Stock Price = β4 DER + β5 NPM + β6 Size + β7 ROA + ε

Information:

DER : Debt Equity Ratio NPM : Net Profit Margin Size : LnAssets

ROA : Return on Assets Stock Price : Stock price

Factor loading is the correlation coefficient for the variable and factor. Factor loading shows the variance explained by the variable on that particular factor. The average variance extracted (AVE) is a measure of the amount of variance that is captured by a construct in relation to the amount of variance due to measurement error. Variance inflation factor (VIF) is a measure of the amount of multicollinearity in a set of multiple regression variables. Cronbach’s alpha is a measure of internal consistency, that is, how closely related a set of items are as a group. It is considered to be a measure of scale reliability. Composite reliability is a measure of internal consistency in scale items, much like Cronbach’s alpha

Evaluation of models based on SEM-PLS is carried out in two stages: one, evaluation of the measurement model (outer model), and two, evaluation of the structural model (inner model). The measurement model is carried out to test the validity and reliability of the instruments in the research model. An instrument is said to be valid if it has a loading factor value above 0.70 and AVE above 0.05 for reflective constructs and has a p-value below 0.05 and a VIF value below 3.3 for formative constructs (Ghozali & Latan, 2015).

An instrument is said to be reliable if it has Composite Reliability (CR) and Cronbach’s Alpha values above 0.7 (Ghozali & Latan, 2015).

Statistical significance is often referred to as the p-value (“probability value”). A p-value less than 0.05 (typically ≤ 0.05) is statistically significant. It indicates strong evidence against the null hypothesis, as there is less than a 5% probability the null is correct. Therefore, we reject the null hypothesis and accept the alternative hypothesis.

Inner model testing is done to test the relationship between latent variables. The hypothesis is accepted if it has a path coefficient (β)> 0 and p-value <0.05. Mediation hypothesis testing is done by looking at the total effect value> 0 and p-value <0.05 for the total effect.

4. Results and Discussion 4.1. Descriptive Statistic

The results of the descriptive statistical analysis include the range of minimum and maximum values, the mean, and the standard deviation for each variable are shown in Table 2.

Table 1: Measurement of research variables

Variable Measurement

Debt Equity Ratio (DER)

DER is the ratio between total debt and equity.

DER measured using the formula: Total Debt/Equity

Net Profit Margin (NPM)

NPM is measured by comparing net income with net sales.

NPM is measured using the formula: Net profit after tax/ Net sales X 100%

Size Company size is measured using the formula:

Size = Ln Total Assets

Stock Price Stock Price measured with the stock price

at the closing price

(6)

The results of the descriptive analysis shown in Table 2 generally reveal the value of share prices in companies listed on the Indonesia Stock Exchange (IDX). Companies listed on the IDX have high stock price growth - this can be seen from the standard deviation values of all variables, which are above 1. The standard deviation of the stock price is 1.65101, with a standard deviation value below the average value, indicating that it does not have many deviations between the minimum value and the maximum value. DER shows a positive average value (3,9149), which indicates that companies listed on the IDX will benefit from the existence of a debt policy to finance company activities. NPM shows a positive average value (4,6337), which indicates that the performance of companies listed on the IDX is productive and efficient. Size shows a positive average value (7,6497), which indicates that companies listed on the IDX continue to experience an increase in their business capacity. ROA shows a positive average value (5.503), which indicates that companies listed on the Indonesia Stock Exchange generally benefit.

4.2. Evaluation of Research Models

4.2.1. Measurement Model Analysis (Outer Model) Evaluation of the measurement model is used to see the validity and reliability of a research model. This research uses the type of reflective variable. Endogenous constructs

are stock prices (dependent variable) using the type of a reflective variable and all exogenous constructs (independent variables) and mediating variables use this type of reflective variable. The validity and reliability of the study are shown in the following table 3:

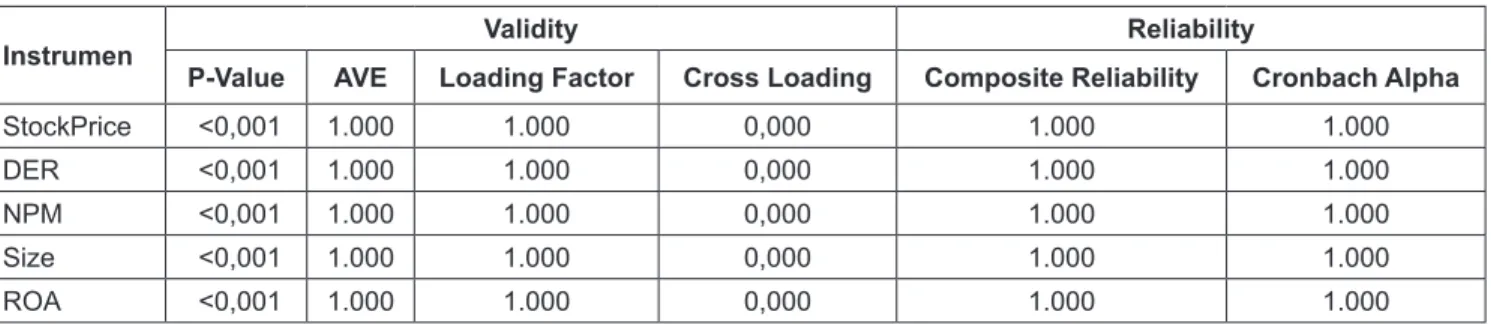
Table 3 showed the results of testing the validity (convergent and discriminant) and reliability for each research construct. The p-value for all research constructs is below 0.05, outer loading value for all research constructs is above 0.7, and the AVE value for all research constructs is above 0.5; therefore, it can be concluded that all research constructs have fulfilled the convergent validity test. The results also show the cross-loading value of all research constructs below the outer loading value and the AVE square value above the correlation value between the variables;

therefore, it can be concluded that all research constructs have met the discriminant validity test. Discriminant validity determines whether the constructs in the model are highly correlated among them or not. It compares the square root of AVE of a particular construct with the correlation between that construct with other constructs. The value of Square Roof of AVE should be higher than the correlation.

In addition to testing validity, while evaluating the measurement model, we must also look at reliability for the research construct. The test results shown in Table 3 indicate that the composite reliability value (CR) and Cronbach alpha value above 0.7 (> 0.7); therefore, it can be concluded that all research constructs have met the reliability test.

Table 2: Descriptive Statistics

Variable Min Max Mean Std. Dev

Stock Price 3,91 12,87 6,5867 1,65101

DER 3,1 1019 3,9149 2,99175

NPM 2,1 9,98 4,6337 2,06305

Size 2,08 12,75 7,6497 1,59841

ROA -54,3 11,30 5,503 4,47465

Table 3: Analysis of Reliability Validity

Instrumen Validity Reliability

P-Value AVE Loading Factor Cross Loading Composite Reliability Cronbach Alpha

StockPrice <0,001 1.000 1.000 0,000 1.000 1.000

DER <0,001 1.000 1.000 0,000 1.000 1.000

NPM <0,001 1.000 1.000 0,000 1.000 1.000

Size <0,001 1.000 1.000 0,000 1.000 1.000

ROA <0,001 1.000 1.000 0,000 1.000 1.000

(7)

4.2.2. Structural Model Analysis (Inner Model)

The structural model validity or inner model is used to predict the relationship between latent variables. The result of testing the structural model (inner model) can be seen in the value of R-Square (R

2

) for exogenous constructs and path coefficient values for endogenous constructs. The coefficient of determination or R

2

is used to analyze how differences in one variable can be explained by a difference in a second variable. The result of testing the structural model using PLS are shown in Table 4.

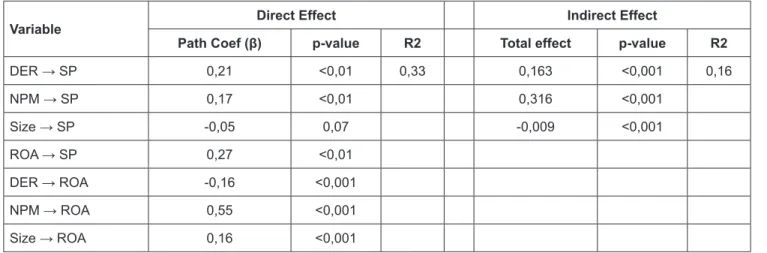
DER is the company’s ability to finance its capital using debt. As shown in Table 4, DER has a positive effect on stock prices, which can be seen from the value of the path coefficient (β) = 0.21 and a p-value of 0.01 <0.05.

Therefore, it can be concluded the higher the DER value of a company will increase the company’s stock price, so H1 is accepted. The result of this study is in line with the study conducted by Asraf et al. (2017) and Khan et al. (2017), who proved that DER has a positive effect on firm value

NPM is the net profit margin which is the percentage of net profit after tax deduction compared to sales. The higher the value of NPM, the higher the returns to shareholders.

As shown in Table 4, NPM has a positive path coefficient (β) = 0.17 and a p-value of 0.01<0.05 which indicates that NPM has a positive effect on stock prices, so H2 is accepted. The result is in line with the research conducted by Apsari et al. (2015) who found that NPM has a positive effect on stock prices.

Table 4: Direct and Indirect Test Results

Variable Direct Effect Indirect Effect

Path Coef (β) p-value R2 Total effect p-value R2

DER → SP 0,21 <0,01 0,33 0,163 <0,001 0,16

NPM → SP 0,17 <0,01 0,316 <0,001

Size → SP -0,05 0,07 -0,009 <0,001

ROA → SP 0,27 <0,01

DER → ROA -0,16 <0,001

NPM → ROA 0,55 <0,001

Size → ROA 0,16 <0,001

SP: Stock Price

Table 5: Hypothesis Testing Result

Hypothesis Hypothesis Testing Results Conclusion

DER has a negative effect on ROA Negative significant Accepted

DER has a positive effect on Stock Price Positive significant Accepted

NPM has a positive effect on ROA Positive significant Accepted

NPM has a positive effect on stock price Positive significant Accepted

Size has a positive effect on ROA Positive significant Accepted

Size has a positive effect on Stock Price Negative significant Rejected

ROA has a positive effect on Stock Price Positive significant Accepted

There is an effect of ROA mediation on the

relationship between DER and Stock Price Positive significant Accepted

There is an effect of ROA mediation on the

relationship between NPM and Stock Price Positive significant Accepted

There is an effect of ROA mediation on the

relationship between Size and Stock Price Positive significant Accepted

(8)

The size of the company does not affect the stock price as seen from the p-value of 0.07> 0.05 (Table 4), so H3 was rejected. The result is in line with the research conducted by Niresh and Velnampy (2014) and Eitokpa (2015), who found that company size had no effect on stock prices.

Profitability is one of the ratios used to measure a company’s ability to generate profits. Profitability in this study is measured using ROA, so the higher the value of ROA, the higher the company’s ability to increase profits.

When profits increase, the value of the company will also increase. Investors will be attracted by the high value of the company and will invest in the capital of the company in the hope of getting a high return. As shown in Table 4, ROA has a positive path coefficient (β) = 0.27 and a p-value of 0.01 <0.05), which indicates that ROA has a positive effect on stock prices, so H4 is accepted. The result is in line with the research conducted by Mule et al.

(2015), Daeli (2018), Vo (2019), and Ng et al. (2020), who proved that when companies have high profits, the share price will rise.

As shown in Table 4, DER had a negative significant effect on ROA (p-value = 0.001<0.05, path coefficient (β)

= -0.16). It explains that a higher DER will reduce the net profit and ROA, so H5 is accepted. The result is in line with the research conducted by Ullah et al. (2020) was proved that debt had a negative and significant effect on ROA.

As shown in Table 4, NPM has a significant positive effect on ROA (p-value = 0.001 <0.05 and path coefficient (β) = 0.55). It can be concluded that NPM has a positive effect on ROA, so H6 is accepted. High NPM will have an impact on company performance. The result is in line with the research conducted by Pokharel et al. (2020).

The size of the company is an important factor in determining its profits. Large companies that are considered to have reached the stage of maturity indicates that the company is relatively more stable and more capable of generating profits than small companies. Big firms are more effective than small firms since they make use of the scale of the economy. Economies of scale are cost advantages reaped by companies when production becomes efficient.

Companies can achieve economies of scale by increasing production and lowering costs, thereby generating more profits. So, H7 is accepted. The result is in line with the research conducted by Mule et al. (2015) and Khan et al.

(2017) who proved size had a positive effect on ROA.

As shown in Table 4, ROA is a good mediating variable, it can be seen from the p-value 0.001 <0.05, DER through ROA has a path coefficient (β) value of 0.163, NPM mediated by ROA has a path coefficient (β) value of 0.316. A higher DER must be balanced with a higher level of profitability which will reduce the stock price. This shows that the debt policy of a company will succeed if it is accompanied by a high

level of corporate profits so that it will indirectly increase the value of the company. So, H8 is accepted. The result is in line with the research conducted by Khan et al. (2017) who found that ROA can act as a mediator for the relationship between variables.

ROA is a good mediator in the effect NPM on stock prices, that it can be seen from the value of the positive path coefficient (β) value of 0.316. This shows that a higher net profit after tax deduction, and supported by growth in earnings will increase a company’s stock price, so H9 is accepted. Indirect testing showed the size of the company and coupled with a high level of profitability will reduce share prices, because the size of the company and the level of profitability reflect the value of the company, so H10 was accepted. Based on the description above is presented a summary of the results of testing the hypotheses of each variable as follows:

5. Conclusion

The research investigated the role of company performance as a mediating variable on factors affecting the stock price of companies listed on the Indonesia Stock Exchange in 2014-2018. This study used samples of 136 manufacturing companies and the data was analyzed by SEM-PLS with the help of the WarpPLS application. The research found that DER and NPM have a positive effect on stock prices. The size of the company does not affect the stock price. ROA can be a good mediator on the relationship between constructs. It can be seen that all research constructs are significant.

References

Apsari, I. A., Dwiatmoko, B., & Azizah, D. F. (2015). Return on equity, net profit margin, debt to equity ratio, and long-term debt to equity ratio, and price book value. Jurnal Administrasi Bisnis, 27(2), 23-33. http://administrasibisnis.studentjournal.

ub.ac.id/index.php/jab/article/view/1101/1284

Asraf, D. F. K., Khawaja, M., & Hussain, S. M. (2017). Do constraints on financial and operating leverage affect the performance of Islamic equity portfolios? Pacific-Basin Finance Journal, 42(C), 171-182. https://doi.org/10.1016/j.

pacfin.2017.02.009

Awan, A. G., Lodhi, M. U., & Hussain, D. (2018). Determinants of firm value: A case study of chemical industries of Pakistan.

Global Journal of Management, Social Sciences, and Humanities, 4(1), 46-61.

Barbosa, N., & Louri, H. (2003). Corporate performance: Does

ownership matter? A comparison of foreign and domestic-

owned firms in Greece and Portugal. Review of Industrial

Organization, 27(1), 73-102. https://doi.org/10.1007/s11151-

005-4920-y

(9)

Chang, K., Ding, J., Lou, Q., Li, Z., & Yang, J. (2020). The impact of capital leverage on green firms’ investment: New evidence regarding the size and age effects of Chinese green industries. Finance Research Letters, May, 101529. https://doi.

org/10.1016/j.frl.2020.101529.

Daeli, C. E. (2018). Determinants of firm value: A case study of cigarette companies listed on the Indonesia Stock Exchange.

International Journal of Managerial Studies and Research, 6(2), 51-59. http://dx.doi.org/10.2139/ssrn.3649042

Eitokpa, O. H. (2015). Determinants of the financial performance of listed foods and beverages companies in Nigeria. Order No.

6044-1428. Doctoral Dissertation, Ahmadu Bello University, Zaria. https://africantheses.org/abstracts/6044-1428

Ghozali, I., & Latan, H. (2015). Partial least square: Concept, application technique using Smart PLS 3.0 program for empirical research. Semarang, Indonesia: Diponegoro University Publishing Agency.

Ha, N. T. L., & Minh, B. T. (2018). Determinants of firm value in Vietnam: A research framework. International Journal of Science and Research, 9(1), 11-23. https://doi.org/10.21275/

ART20204002 626

Hair, J. F., Black, W. C., Babin, B. J., & Anderson, R. (2010).

Multivariate data analysis a global perspective (7th ed.). Upper Saddle River, NJ: Pearson Education Inc.

Khan, M. A., Nouman, M., Teng, J., Khan, M. I., & Jadoo, A. U.

(2017). Determinants of the financial performance of financial sectors: An assessment through economic value-added.

European Academic Research, 5(7), 25-37. https://mpra.

ub.uni-muenchen.de/82386/

Laksitaputri M. I. (2012). Analysis of factors affecting firm value with profitability as an intervening variable: Study on manufacturing companies listed on the Indonesia Stock Exchange for the period 2008-2010. Jurnal Bisnis Strategi, 21(2), 130-132. https://doi.org/10.24018/ejbmr.2020.5.1.230 Lee, J. W., & Zhao, T. F. (2014). The dynamic relationship between

stock price and exchange rates: Evidence from the Chinese stock market. Journal of Asian Finance, Economics, and Business, 1(1), 5-14. https://doi.org/10.13106/jafeb.2014.vol1.no1.5.

Modigliani, F., & Miller, M. H. (1963). Corporate income taxes and the cost of capital. The American Economic Review, 53(3), 433 – 443. https://www.jstor.org/stable/1809167

Mule, R. K., Mukras, M. S, & Nzioka, O. M. (2015) Corporate size, profitability, and market value: An econometric panel analysis of listed firms in Kenya. European Scientific Journal, 11(3), 1-13. https://eujournal.org/index.php/esj/

article/view/5659

Muliawati, E., & Saifi. M., (2019). Leverage, profitability, and company value: Study of textile and garment companies listed on the Indonesia Stock Exchange 2013-2017. Jurnal Administrasi Bisnis, 72(2), 12-21. http://administrasibisnis.

studentjournal.ub.ac.id/index.php/jab/article/view/2874 Ng, A., Yuce, A., & Chen, E. (2009). Determinants of state equity

ownership, and its effect on value/performance: China’s privatized firms. Pacific-Basin Finance Journal, 17, 413-443.

Niresh, J. A., & Velnampy, T. (2014). Firm size and profitability: A study of listed manufacturing firms in Sri Lanka. International Journal of Business and Management, 9(4). https://papers.ssrn.

com/sol3/papers.cfm?abstract_id=2422441

Pokharel K. P., Archer D. W., & Featherstone, A. M. (2020). The impact of size and specialization on the financial performance of agricultural cooperatives. Journal of Co-operative Organization and Management, 8(2), 18-30. https://doi.

org/10.1016/j.jcom.2020.100108

Ramli, N.A., Latan, H., & Solovida, G.T. (2018). Determinants of capital structure and firm financial performance: A PLS-SEM approach: Evidence from Malaysia and Indonesia. Quarterly Review of Economics and Finance,71, 148-160. https://doi.

org/10.1016/j.qref.2018.07.001

Ross, S. A. (1977) The determination of financial structure: The incentive-signaling approach. The Bell Journal of Economics, 8(1), 23-40. https://doi.org/10.2307/3003485

Sholihin, M., & Ratmono, D. (2013). Analysis of SEM-PLS with WarpPLs 3.0. Yogyakarta: Andi Offset

Ullah, A., Pinglu, C., Ullah, S., Zaman, M., & Hashmi, S. H.

(2020). The nexus between capital structure, firm-specific factors, macroeconomic factors, and financial performance in the textile sector of Pakistan. Heliyon, 6(8), 231-241. https://

doi.org/10.1016/j.heliyon.2020.e04741

Vo, Q. T. (2019). Export performance and stock return: A case of fishery firms listing in Vietnam Stock Market. Journal of Asian Finance, Economics, and Business, 6(4), 37-43. https://doi.

org/10.13106/jafeb.2019.vol6.no4.37

수치

Figure 1: Research Framework
Table 1: Measurement of research variables
Table 2: Descriptive Statistics
Table 4: Direct and Indirect Test Results

참조

관련 문서

첫째, UTAUT모형을 이용하여 스마트폰 어플리케이션의 구매에 대해 검정한 결과 독립변수들 (성과기대, 예상노력, 사회적 영향, 유희적 가치,

It also contains the statistical inference on the interaction among firm entry, industry specific factors, firm specific factors, and economic performance, and

Several theories have emerged on the nature of the firm: The neoclassical theory of the firm, the principal agency theory, the transaction cost theory,

The results reveal that the market condition and the revision ratio of offer price are useful public information, which affects IPO stock performance in

Wolfenzon, 2006, Inside the family Firm: The role of families in succession decisions and performance, NBER, Working Paper, 12356..

The unemployment benefit has the negative effect on the job-seeking behavior and the job-matching program - employment offices - has the positive effect,

Jung Bum Wee This paper studies the effect of the government economic policy and the optimizing behaviors of financial institution and business firm on

1 John Owen, Justification by Faith Alone, in The Works of John Owen, ed. John Bolt, trans. Scott Clark, &#34;Do This and Live: Christ's Active Obedience as the