INTRODUCTION
IgE sensitization to inhalant allergens is one of the major com- ponents underlying the pathophysiology of allergic respiratory diseases like asthma and rhinitis. Among several tools to assess inhalant allergen-specific IgE sensitization, the skin prick test is
Patterns of Inhalant Allergen Sensitization and Geographical Variation in Korean Adults: A Multicenter Retrospective Study
Min-Gyu Kang,
1,2Mi-Yeong Kim,
1,3Woo-Jung Song,
1,4Sujeong Kim,
5Eun-Jung Jo,
6Seung-Eun Lee,
7Jae-Woo Kwon,
8Sang-Min Lee,
9Chan-Sun Park,
10Hye-Kyung Park,
6Heung-Woo Park,
1,4Yoon-Seok Chang,
1,4,11Jaechun Lee,
12Young-Min Lee,
3Young-Koo Jee,
13Jong-Myung Lee,
5Inseon S. Choi,
14Sang-Heon Cho
1,4*
1Institute of Allergy and Clinical Immunology, Seoul National University Medical Research Center, Seoul, Korea
2Department of Internal Medicine, Chungbuk National University Hospital, Cheongju, Korea
3Department of Internal Medicine, Busan Paik Hospital, Inje University College of Medicine, Busan, Korea
4Department of Internal Medicine, Seoul National University College of Medicine, Seoul, Korea
5Department of Internal Medicine, Kyungpook National University School of Medicine, Daegu, Korea
6Department of Internal Medicine, Pusan National University Hospital, Busan, Korea
7Department of Internal Medicine Pusan National University Yangsan Hospital, Yangsan, Korea
8Department of Internal Medicine, Kangwon National University School of Medicine, Chuncheon, Korea
9Department of Internal Medicine, Gacheon University Gil Medical Center, Incheon, Korea
10Department of Internal Medicine, Haeundae Paik Hospital, Inje University College of Medicine, Busan, Korea
11Department of Internal Medicine, Seoul National University Bundang Hospital, Seongnam, Korea
12Department of Internal Medicine, Jeju National University School of Medicine, Jeju, Korea
13Department of Internal Medicine, Dankook University College of Medicine, Cheonan, Korea
14Department of Internal Medicine, Cheonnam National University Hospital, Gwangju, Korea
This is an Open Access article distributed under the terms of the Creative Commons Attribution Non-Commercial License (http://creativecommons.org/licenses/by-nc/4.0/) which permits unrestricted non-commercial use, distribution, and reproduction in any medium, provided the original work is properly cited.
Purpose: Inhalant allergen sensitization is one of the major factors involved in the pathogenesis of allergic respiratory diseases. However, the sensi- tization is determined by interactions between genetic and environmental factors. Thus, testing panels of inhalant allergens may differ among geo- graphical areas. Here we aimed to determine 10 common inhalant allergens in Korean adult patients with suspected respiratory allergies and to ex- amine the variation between different geographical locations. Methods: A total of 28,954 patient records were retrieved for retrospective analysis, from 12 referral allergy clinics located in 9 different areas. Inclusion criteria were Korean adults (≥18 years old) who underwent the inhalant allergen skin prick test for suspected history of respiratory allergy. The primary outcome was inhalant allergen skin prick response. Demographic and clinical information were also collected. Positive skin prick responses to allergens were defined as allergen-to-histamine wheal ratio ≥1. Based on skin test results, the most prevalent aeroallergens were determined. Results: The overall prevalence of allergic sensitization was 45.3%. Dermatophagoides farinae and Dermatophagoides pteronyssinus were the most commonly sensitized allergens. Other common inhalant allergens were cat epithelium (8.1%), birch (7.7%), mugwort (6.9%), alder (6.7%), hazel (6.7%), beech (6.7%), oak (6.6%), and Tyrophagus putres (6.2%), in decreasing order fre- quency. These 10 inhalant allergens explained 90% of inhalant allergen sensitization in the study participants. However, distinct patterns of the 10 in- halant sensitization were observed in patients living in Chungnam and Jeju. American cockroach, Gernam cockroach, and Trichophyton metagro- phytes were unique in Chungnam. Orchard, Japanese cedar, and Velvet were unique in Jeju. Conclusions: The present analysis suggests a panel of 10 most common inhalant allergens in Korean adult patients with suspected respiratory allergies, which explained 90% of inhalant allergen sensiti- zation. This panel can be utilized as a practical and convenient tool for primary practice and epidemiological surveys of respiratory allergic diseases.
Key Words: Allergens; allergy; sensitization
Correspondence to: Sang-Heon Cho, Department of Internal Medicine, Seoul National University College of Medicine, 103 Daehak-ro, Jongno-gu, Seoul 03080, Korea.
Tel: +82-2-760-2971; Fax: +82-2-764-3954; E-mail: [email protected] Received: January 1, 2017; Revised: May 25, 2017; Accepted: May 29, 2017
•Min-Gyu Kang and Mi-Yeong Kim contributed equally to this article.
•There are no financial or other issues that might lead to conflict of interest.
Allergy Asthma Immunol Res. 2017 November;9(6):499-508.
https://doi.org/10.4168/aair.2017.9.6.499 pISSN 2092-7355 • eISSN 2092-7363
one of the most useful tests for its high sensitivity and simplici- ty. The status of inhalant IgE sensitization is determined by in- teractions between genetic and environmental factors, and may differ between populations.1-3 Thus, testing panels of in- halant allergen need localization.
Current panels of the inhalant allergen skin test in Korean adults were based on previous studies conducted a relative small number of institutions, such as a study involving 2,554 adult patients recruited from the referral centers located in 3 different areas (Seoul, Suwon, and Jeju) in 2001.4 These results have been also utilized in several community-based popula- tion surveys on allergic diseases in Korean adults.5-7 There have been several additional studies on the sensitization rates of in- halant allergens in Korean patients.8-11 However, how the pan- els of skin prick testing for common inhalant allergens differ among areas was not addressed in those studies, as they were mostly restricted to specific centers or locations.8-11 Here we performed a retrospective multicenter survey involving 12 re- ferral allergy clinics located in 9 different areas in Korea, to identify recent common inhalant allergens in adult patients with allergic symptoms and to examine the regional difference in common inhalant allergen sensitization. Doing this, we aimed to suggest a panel of major inhalant allergens for skin prick testings to be used in further clinical practice and epide- miological surveys of Korean adults.
MATERIALS AND METHODS Study design
A retrospective study of medical records was performed in 2014, as an integral part of the project of ‘Standardization of di-
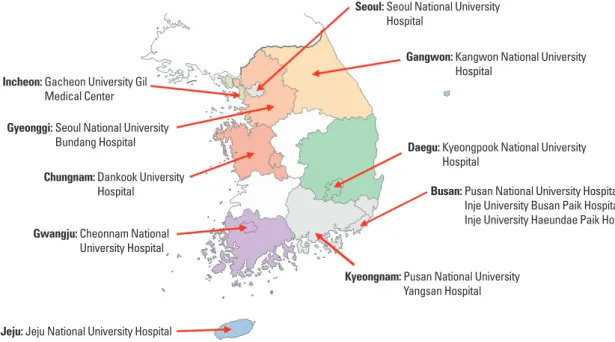
agnostic tests for allergic diseases in adults.’ A total of 12 referral allergy clinics located in 9 different areas covering all provinces in Korea were enrolled (Fig. 1): Seoul National University Hos- pital (SNUH) in Seoul, Seoul National University Bundang Hos- pital (SNUBH) in Seongnam, Gacheon University Gil Medical Center (GUGMC) in Incheon, Kangwon National University Hospital (KWNUH) in Chuncheon, Dankook University Hospi- tal (DKUH) in Cheonan, Kyungpook National University Hos- pital (KPNUH) in Daegu, Inje University Busan Paik Hospital (IUBPH), Inje University Haeundae Paik Hospital (IUHPH), Pu- san National University Hospital (PNUH) in Busan and Pusan National University Yangsan Hospital (PNUYH) in Yangsan, Cheonnam National University Hospital (CNUH) in Gwangju, and Jeju National University Hospital (JNUH) in Jeju. The study period was slightly different between individual clinics, and de- tailed information on the study period was described in sup- plementary Table 1. A retrospective review was performed on adult patients (≥18 years old) who visited referral allergy clin- ics for their respiratory symptoms suggestive of asthma or rhi- nitis and underwent inhalant allergen skin prick testing. Medi- cal record reviews included clinical history, demographics (age, gender, and residential areas), final diagnosis for allergic dis- eases and skin prick test results (the list of tested allergens and wheal sizes of allergens and controls). The patients were reclas- sified according to area for further analyses, depending on their registered residential places in electronic health records of each institution. The study protocol was approved by the Institution- al Review Board of each participating institution.
Skin prick test
The skin prick test was performed by trained specialists in
Fig. 1. The locations of the referral centers enrolled in this study.
Busan: Pusan National University Hospital, Inje University Busan Paik Hospital, Inje University Haeundae Paik Hospital
Kyeongnam: Pusan National University Yangsan Hospital
Daegu: Kyeongpook National University Hospital
Gangwon: Kangwon National University Hospital
Seoul: Seoul National University Hospital
Incheon: Gacheon University Gil Medical Center
Gyeonggi: Seoul National University Bundang Hospital
Chungnam: Dankook University Hospital
Gwangju: Cheonnam National University Hospital
Jeju: Jeju National University Hospital
each institution with in-hospital protocol. The histamine (1.0 or 1.7 mg/mL) was used for a positive control and physiologic sa- line was used for a negative control. Participants who did not react to histamine or reacted to physiologic saline were exclud- ed in the present analyses. The skin test results were interpret- ed after 15 minutes by measuring the mean size of flares and wheals for each allergen. Considering variations in the source and concentrations of allergen extracts and controls between centers, the allergen-to-histamine ratio was utilized to deter- mine the positivity. A skin prick test was considered positive of the mean wheal size for any allergen was greater than or equal to that for histamine (A/H ratio≥1).12 Allergen extracts manu- factured by the Allergopharma, Lofama and Allergy Therapeu- tics were used in our study population, which are listed in sup- plementary Table 1.
Statistical analysis
All statistical analyses were performed using SPSS version 20.0 (SPSS Inc., Chicago, IL, USA) and spreadsheet of Excel (Microsoft Corporation, Redmond, WA, USA) made by Neyel- off.13 The regional prevalence of sensitization to each allergen, and overall sensitization were estimated with arithmetic mean and confidence intervals by using logistic regression for binary outcomes. Nationwide sensitization profile of allergens were also meta-analyzed after adjusting for the heterogeneity of pop- ulation composition according to the 2010 Korean population and housing census.14
RESULTS
Baseline characteristics of study population and summary of allergens tested
A total of 28,954 adult patients were enrolled from the 12 aller-
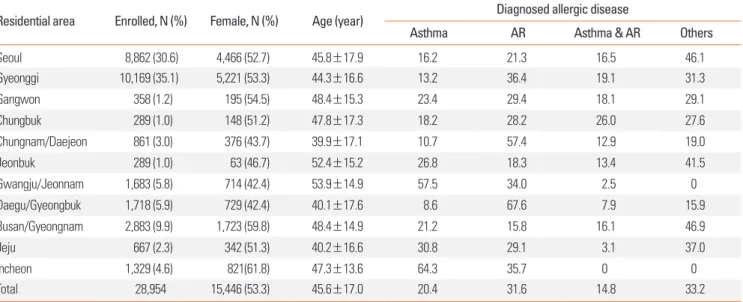
gy clinics of referral hospitals in 9 different areas. As described in the Materials and Method section, all the participants were re-classified based on their residential areas for further analy- ses of geographic difference, but not the location of the enrolled clinic. The clinical findings were summarized in Table 1. The mean age of the total population was 45.6 ±17.0 years and el- derly participants who were older than 65 years accounted for 15.1% of the study population. The percentage of females was 53.3%. In total, 66.8% of patients were finally diagnosed with asthma or allergic rhinitis. The other diagnoses included chron- ic sinusitis, upper airway cough syndrome, and chronic idio- pathic cough.
Detailed information on commercial inhalant allergens tested in each hospital was listed in supplementary Table 1. A total of 92 different allergens were found to be utilized in at least 1 insti- tution, which included 6 types of mite allergens, 2 types of cock- roach allergens, 13 types of mold allergens, 11 types of animal allergens, 17 types of tree allergens, 10 types of grass allergens, and 8 types of weed allergens. Sixteen allergens were found to be utilized in all participating centers: Dermatophagoides fari- na (Der f), Dermatophagoides pteronysimus (Der p), German cockroach, Alternaria, Cladosporium berbarum and Aspergillus fumigatus, alder, ash, hazel, poplar, birch, rye, nettle, ragweed, mugwort, and Japanese hop. The following 18 allergens were found to be tested in most centers (9 of 12): Tyrophagus putres- centiae, Penicilliun notatum, cat epithelia and dog epithelia, el- der, elm, willow tree, acacia, beech, pine, oak, plane tree, or- chard, timothy, meadow and bermuda grass, dandelion, and plantain. The following 10 allergens were exclusively being used in Jeju: Panonychus citrus, Trychophyton metagrophytes, Helminthosporium, hay dust, Jeju cedar, rape, dog’s tail grass, vernal grass, Johnson grass, and feather mix.
Table 1. Clinical findings of the study participants according to the residential area
Residential area Enrolled, N (%) Female, N (%) Age (year) Diagnosed allergic disease
Asthma AR Asthma & AR Others
Seoul 8,862 (30.6) 4,466 (52.7) 45.8±17.9 16.2 21.3 16.5 46.1
Gyeonggi 10,169 (35.1) 5,221 (53.3) 44.3±16.6 13.2 36.4 19.1 31.3
Gangwon 358 (1.2) 195 (54.5) 48.4±15.3 23.4 29.4 18.1 29.1
Chungbuk 289 (1.0) 148 (51.2) 47.8±17.3 18.2 28.2 26.0 27.6
Chungnam/Daejeon 861 (3.0) 376 (43.7) 39.9±17.1 10.7 57.4 12.9 19.0
Jeonbuk 289 (1.0) 63 (46.7) 52.4±15.2 26.8 18.3 13.4 41.5
Gwangju/Jeonnam 1,683 (5.8) 714 (42.4) 53.9±14.9 57.5 34.0 2.5 0
Daegu/Gyeongbuk 1,718 (5.9) 729 (42.4) 40.1±17.6 8.6 67.6 7.9 15.9
Busan/Gyeongnam 2,883 (9.9) 1,723 (59.8) 48.4±14.9 21.2 15.8 16.1 46.9
Jeju 667 (2.3) 342 (51.3) 40.2±16.6 30.8 29.1 3.1 37.0
Incheon 1,329 (4.6) 821(61.8) 47.3±13.6 64.3 35.7 0 0
Total 28,954 15,446 (53.3) 45.6±17.0 20.4 31.6 14.8 33.2
SeoulGyeonggiGangwonChungbuk Chungnam/ Daejeon
Jeonbuk
Jeonnam/ Gwangju
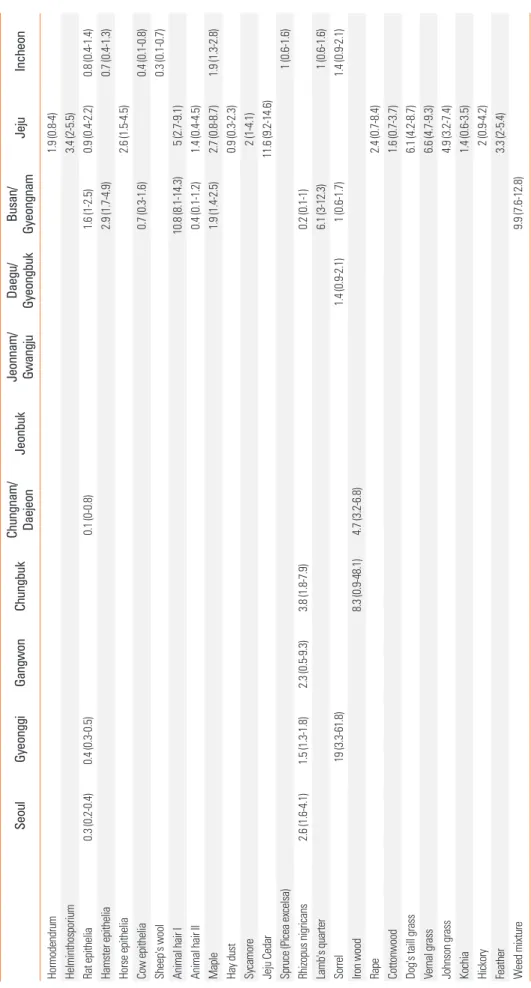
Daegu/ GyeongbukBusan/ GyeongnamJejuIncheon Total45.8 (44.8-46.8)46.6 (45.7-47.6)37.1 (32.5-42)39.7 (34.5-45.2)48.9 (45.7-52.1)33.7 (26.9-41.3)26.8 (24.9-28.7)54.1 (51.9-56.3)41.3 (39.6-43)53.8 (50.2-57.3)36.3 (33.9-38.8) Mites, any34.0 (33.1-35)34.9 (34-35.8)24.1 (20.1-28.5)30.5 (25.7-35.8)36.9 (33.9-40)23.5 (17.6-30.6)18.2 (16.6-20)38.5 (36.4-40.7)26.7 (25.2-28.2)38.5 (35.1-42.1)25.5 (23.3-27.8) Dermatophagoides pteronysimus29.5 (28.6-30.4)30.6 (29.7-31.5)22.2 (18.3-26.5)25.0 (20.5-30.0)31.2 (28.3-34.2)20.7 (15.4-27.8)16.6 (15.0-18.2)32.3 (30.3-34.4)23.7 (22.2-25.2)36.7 (33.3-40.3)20.8 (18.8-23.0) Dermatophagoides farinae30.3 (29.3-31.2)31.7 (30.8-32.6)20.8 (17.1-25.0)27.1 (22.5-32.3)33.7 (30.7-36.8)20.3 (14.8-27.1)16.1 (14.6-17.8)33.8 (31.8-35.9)23.3 (21.8-24.8)35.4 (32.0-38.9)22.3 (20.2-24.5) Tyrophagus putres5.6 (5.1-6.0)7.1 (6.6-7.6)4.1 (2.5-6.5)7.6 (5.1-11.1)6.6 (5.2-8.4)2.5 (1.0-6.4)5.9 (3.7-9.3)4.8 (3.9-5.8)6.0 (5.3-6.9)13.8 (10.2-18.4)4.8 (3.8-6.1) Tetranychus urticae9.0 (8.2-9.8)7.6 (6.3-9.1)6.2 (2.8-13.1)3.8 (1.2-11.1)9.7 (6.3-14.6)6.7 (2.3-17.6)2.8 (1-7.7)9 (5.4-14.6)5.8 (2.8-11.6)8.6 (3-22.5) Cockroach, any4.6 (4.2-5)4.3 (3.9-4.7)3.4 (2-5.7)4.4 (2.7-7.3)7.7 (6.1-9.5)3.1 (1.3-7.1)2.2 (1.7-3)2.6 (2-3.4)4.4 (3.8-5.2)5 (3.6-6.8)4.6 (3.6-5.8) German cockroach3.7 (3.3-4)3.3 (2.9-3.6)2.1 (1.1-4.1)3.6 (2.1-6.4)5.6 (4.3-7.2)3.1 (1.3-7.1)2.2 (1.7-3)2.5 (1.9-3.3)4.4 (3.7-5.2)5 (3.7-6.9)4.6 (3.7-5.8) American cockroach2.8 (2.5-3.1)2.3 (2-2.6)2.4 (1.3-4.5)3.1 (1.6-5.7)6 (4.6-7.7)1.7 (0.5-5.4)2.9 (1.5-5.7)1.7 (0.8-3.6)0.8 (0.2-2.8)4.1 (1.4-11.6) Outdoor mold, any5.7 (5.2-6.1)6.7 (6.2-7.2)5.9 (3.9-8.6)5.1 (3.2-8.2)6.2 (4.8-7.9)3.4 (1.5-7.5)3.1 (2.4-3.9)5.3 (4.4-6.3)2.3 (1.9-2.9)4.7 (3.4-6.5)4.8 (3.8-6) Alternaria2.7 (2.4-3)2.9 (2.6-3.2)3.6 (2.1-5.9)3.1 (1.7-5.7)3.2 (2.2-4.5)0.7 (0.1-4.2)0.7 (0.4-1.2)3.7 (2.9-4.6)1.2 (0.9-1.6)3.7 (2.6-5.3)1.5 (1-2.3) Candida albicans2.5 (2.1-2.9)1.7 (1.5-2)2 (0.9-4.3)2.2 (0.9-4.9)3.2 (2.1-4.6)1.5 (0.4-6.1)3.5 (1.6-7.5)3.7 (1.9-6.8)2.3 (1-4.9)4.5 (2.1-9.4)2.3 (1.7-3.2) Cladosporium1.4 (1.2-1.7)2 (1.8-2.3)0.7 (0.2-2.3)1.5 (0.6-3.7)1.5 (0.9-2.5)2 (0.7-5.7)0.5 (0.3-0.9)1.3 (0.9-1.9)0.9 (0.6-1.3)1.8 (1-3.3)1.5 (1-2.3) Fusarium moniliforme0.5 (0.4-0.7)0.8 (0.7-1)0.5 (0.1-1.9)0.2 (0-2.3)1 (0.2-4.5)0.1 (0-0.4)0.7 (0.4-1.1)0.6 (0.3-1.3)0.3 (0.1-0.8) Mold I mixture3.2 (2.9-3.6)3.8 (3.5-4.2)4.3 (2.7-6.8)2.4 (1.1-4.8)3.7 (2.2-6)0.5 (0-4.3)1.7 (0.7-4)3.2 (1.8-5.7)3.5 (2.4-5)2.6 (1.3-5.4)36.3 (33.9-38.8) Indoor molds3.9 (3.5-4.3)4.2 (3.8-4.6)4.3 (2.7-6.8)5.1 (3.2-8.1)7.6 (6-9.4)1.6 (0.5-5.3)1.6 (1.2-2.3)2.9 (2.2-3.7)2.3 (1.8-2.8)2.6 (1.7-4.1)3.7 (2.8-4.8) Aspergillus fumigatus1.3 (1.1-1.5)1.9 (1.6-2.1)1.2 (0.5-2.9)1.3 (0.5-3.4)1.1 (0.6-2)1.1 (0.3-4.6)0.6 (0.3-1)1.1 (0.7-1.7)1 (0.7-1.4)1.2 (0.5-2.5)1.1 (0.7-1.8) Aspergillus niger0.3 (0.2-0.5)1.5 (1.3-1.8)0.3 (0.1-2.2)1.2 (0.4-3.8)1 (0.3-3.4)0.9 (0.1-5.5)1.2 (0.3-4.5)0.7 (0.2-3)0.7 (0.2-3.5) Mucor mucedo0.3 (0.2-0.5)0.3 (0.2-0.4)0.5 (0.1-2.1)0.7 (0.3-1.6)0.7 (0.2-3.0)0.7 (0.2-3.5) Neurospora sitophilia0.7 (0.5-0.9)0.7 (0.5-0.8)0.5 (0.1-2)1.1 (0.4-3.2)1 (0.4-2.7)0.5 (0.1-4.2)0.5 (0.1-2.6)1.7 (1.2-2.3)0.8 (0.4-1.5) Penicillium notatum1.6 (1.4-1.9)0.9 (0.8-1.1)2.1 (1-4)1 (0.3-3)1.9 (1.2-3)0.5 (0.1-4.2)0.3 (0.1-0.7)1.1 (0.4-2.9)1.1 (0.8-1.5)1.1 (0.5-2.4) Trichophyton metagrophytes3.3 (1.3-8.1)6.7 (4.8-9.1)0.7 (0.4-1.3)1.8 (1.1-3.1)2.8 (2.1-3.8) Mold II mixture1.2 (1-1.5)1.3 (0.9-1.8)1.1 (0.4-3.1)1.3 (0.6-3.2)0.6 (0.1-5.8)0.2 (0-3.5)0.2 (0-2.6)2.3 (1.1-4.8)2.5 (1.2-5.3) Animal, any11.6 (11-12.3)11.1 (10.5-11.7)8.7 (6.3-11.9)8.2 (5.6-11.7)11.2 (9.3-13.3)6.5 (3.6-11.4)3.8 (3.1-4.7)8.7 (7.6-10)7.3 (6.4-8.2)8.1 (6.3-10.3)8.5 (7.2-10.1) Cat epithelia9.6 (9-10.2)8.7 (8.2-9.3)7.4 (5.2-10.5)5.9 (3.7-9.2)8.7 (7.1-10.7)5.6 (2.9-10.5)3.2 (2.5-4.1)7 (5.9-8.2)7.4 (6.5-8.6)5.4 (3.8-7.7)5.8 (4.7-7.1) Dog epithelia3.8 (3.4-4.2)4.7 (4.3-5.1)2.1 (1.1-4.1)3 (1.6-5.6)4.1 (3-5.6)0.7 (0.1-4.2)0.9 (0.6-1.4)2.6 (2-3.3)5.6 (4.6-6.8)3.7 (2.4-5.7)2.9 (2.1-3.9) Hens epithelia0.3 (0.2-0.4)0.3 (0.2-0.5)0.5 (0.1-2.3)0.5 (0.1-2.9)0.7 (0.1-3) Rabbit epithelia0.7 (0.5-0.9)0.4 (0.3-0.6)0.5 (0.1-3.9)0.5 (0.1-2.8)1.8 (1.1-3)1.3 (0.3-5.8)0.5 (0.1-3.3)1.1 (0.5-2.5)0.9 (0.5-1.5) Tree, early blooming, any9.7 (9.1-10.3)9.9 (9.4-10.5)10.6 (7.9-14)8 (5.4-11.5)11.3 (9.4-13.4)5.4 (2.8-10.1)7.3 (6.3-8.5)18.4 (16.8-20.2)14.8 (13.6-16.1)4.2 (3-5.9)5.9 (4.8-7.3) Alder6.4 (6-6.9)6.5 (6-6.9)9 (6.6-12.3)5 (3.1-8.1)5.7 (4.4-7.4)4.3 (2-8.7)4 (3.2-4.9)9.4 (8.2-10.8)14.5 (12.9-16.3)2.4 (1.4-4.1)2.5 (1.8-3.4) Ash1.1 (0.9-1.3)0.9 (0.7-1.1)1.8 (0.9-3.8)1.4 (0.6-3.5)1.7 (1.1-2.8)0.6 (0.3-1)2.3 (1.7-3)3.2 (2.4-4.1)1.7 (0.9-3.2)1.2 (0.8-1.9) Elder1.4 (1.2-1.6)1.2 (1-1.5)1 (0.4-2.7)1.7 (0.7-3.9)4.1 (3-5.6)1.2 (0.4-3.4)2.4 (1.3-4.6)6.1 (5.3-7)1.5 (0.2-8.7)2 (1.4-2.9) Elm1.6 (1.4-1.9)1.5 (1.3-1.7)0.8 (0.2-2.3)0.7 (0.2-2.6)1 (0.6-1.9)0.2 (0-2.5)1.3 (0.9-1.9)1.9 (1.5-2.5)1.3 (0.6-2.6)0.7 (0.4-1.3) Hazel6.7 (6.2-7.2)6.5 (6.1-7)8.5 (6.2-11.7)5.1 (3.2-8.2)5.5 (4.2-7.2)3.5 (1.6-7.8)5.7 (4.8-6.8)12.2 (10.9-13.7)7.7 (6.8-8.6)3.4 (2.2-5.3)2.1 (1.5-3) Poplar1.6 (1.3-1.8)1.6 (1.4-1.9)0.8 (0.2-2.3)1.3 (0.5-3.3)2 (1.2-3.1)1 (0.6-1.5)1.7 (1.3-2.4)5.1 (4.4-5.9)1.4 (0.7-2.8)1 (0.6-1.7) Willow tree1.4 (1.1-1.6)1.5 (1.3-1.7)0.2 (0-1.8)1.1 (0.4-3.1)1.6 (1-2.6)0.4 (0.2-0.8)1.5 (0.7-3.4)1.7 (1.1-2.4)1.1 (0.5-2.4)0.6 (0.3-1.2)
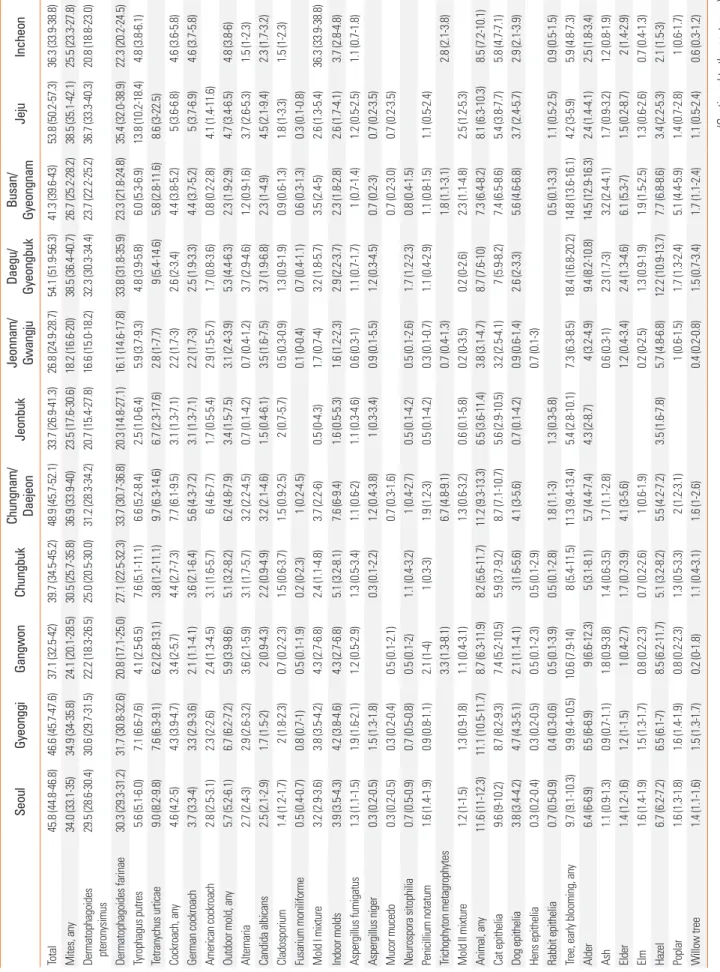
Table 2. Sensitization rates to inhalant allergens according to the residential area (Continued to the next page)
SeoulGyeonggiGangwonChungbuk Chungnam/ Daejeon
Jeonbuk
Jeonnam/ Gwangju
Daegu/ GyeongbukBusan/ GyeongnamJejuIncheon Tree I mixture7.6 (7.1-8.2)7.9 (7.4-8.4)7.6 (5-11.5)4.7 (2.8-7.7)5.9 (4-8.7)4.7 (2.3-9.3)9.3 (6.4-13.3)7.9 (5.5-11.1)6.1 (5.2-7)4.3 (2.5-7.5)2.8 (2-3.7) Tree, mid blooming, any11.4 (10.8-12)11.7 (11.1-12.4)13.3 (10.3-17)10.2 (7.3-14)8.1 (6.6-10.1)5.7 (3-10.5)6.6 (5.6-7.8)14.5 (13-16.1)14.9 (13.7-16.2)15.9 (13.4-18.7)6.1 (5-7.4) Acasia or locust1.3 (1.1-1.7)0.9 (0.7-1.1)1.1 (0.4-3.1)0.4 (0.1-2.7)0.2 (0-0.9)2.5 (1.9-3.3)0.9 (0.6-1.5)2.5 (1.4-4.2)1.4 (0.9-2.1) Birch7.7 (7.1-8.4)7.6 (7.1-8.1)10.7 (7.7-14.6)4.7 (2.7-8.1)5.7 (4.3-7.5)3.6 (1.5-8.7)4.9 (4.1-6)9.2 (8-10.6)12.8 (11.7-14)2.2 (1.2-3.9)2.9 (2.2-3.9) Beech7.1 (6.6-7.6)7 (6.5-7.5)8.6 (6.2-11.8)5.9 (3.8-9.1)4.4 (3.3-5.9)4.6 (2.3-9.1)4 (3.3-5)5.4 (4.5-6.5)12.3 (10.8-13.9)7.7 (3.5-15.9)2.4 (1.8-3.4) Pine1.4 (1.2-1.6)1.4 (1.2-1.6)1.6 (0.8-3.5)1.3 (0.5-3.4)0.4 (0.1-1)0.7 (0.1-4.2)1 (0.3-3.2)2.3 (1.2-4.4)7.1 (6.2-8.2)2.1 (1.2-3.7)2.2 (1.5-3.1) Oak7 (6.5-7.5)6.7 (6.3-7.2)7.2 (5-10.2)4.8 (2.9-7.8)5.2 (3.9-6.8)3.3 (1.4-7.5)4.3 (3.5-5.3)6.7 (5.7-7.8)9.3 (8.3-10.3)9.4 (4.7-18)2 (1.4-2.9) Plane tree1.5 (1.2-1.7)1.5 (1.2-1.7)1.2 (0.5-2.9)2.2 (1-4.5)2 (1.2-3.1)1.7 (0.8-3.6)1.5 (1-2.2)1.4 (0.7-2.9) Japanese ceda0.4 (0.3-0.5)0.7 (0.5-0.8)0.7 (0.2-2.3)0.8 (0.3-2.8)0.3 (0.1-1)0.7 (0.1-4.2)0.8 (0.2-2.9)0.5 (0.1-2.1)5.9 (5-7.1)12.1 (9.9-14.7)0.2 (0-0.6) Tree II mixture8.7 (8.2-9.3)8.6 (8.1-9.2)9.3 (6.3-13.5)5.3 (3.3-8.5)6.4 (4.4-9.3)4.7 (2.3-9.3)9.4 (6.5-13.4)8.7 (6.2-12)5.4 (4.6-6.3)5.1 (3-8.4)3 (2.2-4) Grasses, any5 (4.6-5.5)5.1 (4.7-5.5)3.6 (2.1-5.9)5.1 (3.2-8.2)7.4 (5.9-9.2)4.6 (2.3-9.1)4.2 (3.4-5.1)9 (7.8-10.3)9.9 (8.9-11)9.7 (7.8-12.1)5.9 (4.8-7.2) Velvet2.7 (2.4-3)2.6 (2.3-2.9)2 (1-4)2.7 (1.4-5.3)2.4 (1.3-4.4)2 (0.7-5.8)0.3 (0-2.6)2.3 (1.2-4.4)1.4 (0.5-3.5)7.7 (5.7-10.2) Orchard3.2 (2.9-3.6)2.8 (2.5-3.1)2 (1-4)3 (1.6-5.6)3.6 (2.6-5)3.3 (1.4-7.4)2.3 (1.7-3)1.4 (1-2)6.8 (6-7.7)14.5 (10.1-20.5)1.5 (1-2.3) Rye3.1 (2.8-3.5)3 (2.6-3.3)2.2 (1.2-4.3)3.4 (1.9-6)3.4 (2.4-4.8)3.9 (1.8-8.2)1.9 (1.4-2.6)3 (2.4-3.9)3.5 (2.9-4.3)8.6 (6.5-11.3)1.5 (1-2.3) Timothy2.7 (2.4-3.1)2.7 (2.4-3)2.2 (1.1-4.2)2.8 (1.5-5.4)3.6 (2.6-5)2.6 (1-6.5)1.8 (1.3-2.5)1.9 (1.4-2.6)3.2 (2.6-3.8)7 (5.1-9.4)1.5 (0.9-2.2) Kentucky bluegrass2.9 (2.6-3.3)2.8 (2.5-3.1)1.9 (0.9-3.8)2.2 (1.1-4.6)4.6 (3.4-6.1)2.5 (1-6.5)0.9 (0.3-3)1.3 (0.5-3.1)3.1 (2.4-4)7.7 (5.7-10.2)1.7 (1.2-2.5) Meadow2.9 (2.6-3.2)2.7 (2.4-3)1.6 (0.7-3.4)3 (1.6-5.6)3.2 (2.3-4.6)2.5 (1-6.5)2.2 (1.6-2.9)1.8 (1.3-2.4)3.6 (2.8-4.7)6.8 (5-9.3)1.2 (0.8-1.9) Nettle0.8 (0.6-1.1)0.4 (0.3-0.6)0.5 (0.1-2.4)0.9 (0.2-3.2)1.6 (0.9-2.7)0.8 (0.1-5.4)0.8 (0.5-1.3)0.6 (0.3-1.1)2.1 (1.6-2.8)1.6 (0.8-3.1)0.8 (0.4-1.4) Bermuda grass2 (1.7-2.4)1.2 (1-1.4)1.1 (0.4-3)1.5 (0.5-4)2.4 (1.5-3.7)0.8 (0.1-5.4)1.6 (1.1-2.3)3.4 (2.6-4.3)2.3 (1.8-2.9)3.5 (2.2-5.6)1.2 (0.7-1.9) Grass mixture2.9 (2.6-3.2)2.2 (2-2.5)1.9 (0.8-4.6)1.6 (0.7-3.8)1.8 (0.8-3.7)2.6 (1-6.6)1.1 (0.4-3.3)1.4 (0.6-3.3)2.4 (1.7-3.4)8.6 (5.7-12.9)3.2 (2.4-4.2) Weeds, any12.5 (11.8-13.1)14.3 (13.7-15)13.6 (10.5-17.3)11.8 (8.7-15.8)14.4 (12.3-16.7)10.5 (6.7-16.2)5.2 (4.3-6.2)16 (14.4-17.6)10.7 (9.7-11.9)11.8 (9.7-14.3)8.8 (7.5-10.4) Ragweed3.8 (3.5-4.2)3.6 (3.2-4)5.8 (3.9-8.6)2.7 (1.4-5.2)2.8 (2-4.1)2.9 (1.2-7)1.5 (1.1-2.1)5 (4.1-6)3.2 (2.4-4.1)4.9 (3.6-6.8)2 (1.4-2.9) Mugwort7.6 (7.1-8.1)7.6 (7.1-8.1)7.3 (5.1-10.3)5 (3.1-8.1)9.4 (7.7-11.5)4.4 (2.1-8.8)2.6 (2-3.4)6.5 (5.5-7.6)5.2 (4.5-6)7.2 (5.5-9.3)6.2 (5.1-7.6) Hop Japanese4.1 (3.7-4.5)5.3 (4.9-5.7)4.1 (2.6-6.6)4.9 (3-7.9)6.1 (4.7-7.8)7.2 (4.1-12.3)1.8 (1.3-2.5)5.9 (4.9-7)3.6 (3-4.3)6.3 (4.2-9.2)2.3 (1.6-3.2) Dandelion1.7 (1.5-2)2.4 (2.1-2.7)2.7 (1.5-4.9)1.2 (0.4-3.2)1.6 (0.7-3.4)0.4 (0.2-0.8)2.8 (2.2-3.6)4.6 (3.8-5.6)0.5 (0.1-3.9)0.8 (0.5-1.4) Chrysanthemum5.5 (5-6.1)7.4 (6.9-8)5.2 (2.9-9)7 (4.4-10.7)6.2 (4-9.4)7.4 (3.9-13.6)4.3 (2.3-7.7)6.7 (4.4-10.1)3.9 (3.2-4.8)4.2 (1.3-12.7) Goldenrod2.4 (2-2.8)1.8 (1.6-2.1)3.1 (1.7-5.8)0.9 (0.2-3.4)2.8 (1.3-5.8)0.9 (0.1-5.5)1.6 (0.5-5.1)2.7 (1.3-5.5)1.6 (1-2.5)4.2 (1-15.3) Plantain1.6 (1.3-1.9)0.8 (0.7-1)1.1 (0.4-3.1)2.3 (1-5)1.6 (0.9-2.8)3.5 (1.4-8.5)0.5 (0.1-3.9)1.5 (1.1-2.2)1.4 (0.8-2.5)1.7 (0.9-3.3)1.2 (0.7-1.9) Other uncommon allergens Latex (Hevea brasiliensis) Lepidoglyphus destructor Acarus siro6.1 (3.1-11.6)25.1 (7.1-59.6)10.2 (7.9-13.1)7.7 (6.1-9.6)6.8 (5.6-8.2) Panonychus citrus7 (4.1-11.5) Trychophyton mentagrophytes25.1 (7.1-59.6)9 (6.8-11.7) Tricepidermofiti mix Cephalosporium2 (0.9-4.2) (Continued to the next page)
Table 2. Continued
SeoulGyeonggiGangwonChungbuk Chungnam/ Daejeon
Jeonbuk
Jeonnam/ Gwangju
Daegu/ GyeongbukBusan/ GyeongnamJejuIncheon Hormodendrum1.9 (0.8-4) Helminthosporium3.4 (2-5.5) Rat epithelia0.3 (0.2-0.4)0.4 (0.3-0.5)0.1 (0-0.8)1.6 (1-2.5)0.9 (0.4-2.2)0.8 (0.4-1.4) Hamster epithelia2.9 (1.7-4.9)0.7 (0.4-1.3) Horse epithelia2.6 (1.5-4.5) Cow epithelia0.7 (0.3-1.6)0.4 (0.1-0.8) Sheep's wool0.3 (0.1-0.7) Animal hair I10.8 (8.1-14.3)5 (2.7-9.1) Animal hair II0.4 (0.1-1.2)1.4 (0.4-4.5) Maple1.9 (1.4-2.5)2.7 (0.8-8.7)1.9 (1.3-2.8) Hay dust0.9 (0.3-2.3) Sycamore2 (1-4.1) Jeju Cedar11.6 (9.2-14.6) Spruce (Picea excelsa)1 (0.6-1.6) Rhizopus nigricans2.6 (1.6-4.1)1.5 (1.3-1.8)2.3 (0.5-9.3)3.8 (1.8-7.9)0.2 (0.1-1) Lamb's quarter6.1 (3-12.3)1 (0.6-1.6) Sorrel19 (3.3-61.8)1.4 (0.9-2.1)1 (0.6-1.7)1.4 (0.9-2.1) Iron wood8.3 (0.9-48.1)4.7 (3.2-6.8) Rape2.4 (0.7-8.4) Cottonwood1.6 (0.7-3.7) Dog's taill grass6.1 (4.2-8.7) Vernal grass6.6 (4.7-9.3) Johnson grass4.9 (3.2-7.4) Kochia1.4 (0.6-3.5) Hickory2 (0.9-4.2) Feather3.3 (2-5.4) Weed mixture9.9 (7.6-12.8) *Sensitization rates to inhalant allergens are presented as mean (95% confidence interval).
Table 2. Continued
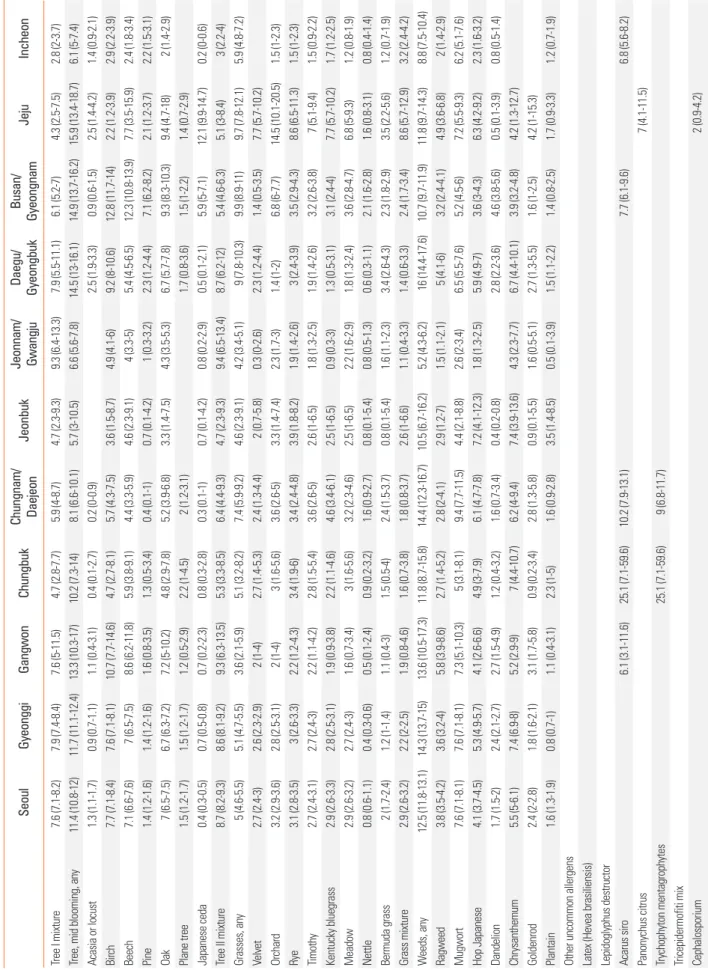
Fig. 2. Overall sensitization profiles of inhalant allergens in decreasing order of frequency.
Aeroallergens (species)
0 2 4 6 8 30 35 40 45
Sensitization rate (%) Total
Dermatophagoides farinae Dermatophagoides pteronysimus Tetranychus urticae Cat epithelia Birch Acarus ciro Mugwort Hazel Beech Alder Oak Chrysanthemum Tyrophagus putres Hop Japanese Dog epithelia Ragweed German cockroach Orchard Rye Lepidoglyphus destructor Kentucky bluegrass Velvet Timothy Meadow Horse epithelia American cockroach Alternaria Trichophyton metagrophytes Dandelion Candida albicans Pine Goldenrod Elder Poplar Bermuda grass Maple Rhizopus nigricans Plane tree Elm Cladosporium Aspergillus fumigatus Willow tree Sorrel Plantain Penicillium notatum Japanese ceda Hamster epithelia Acasia or locustAsh Aspergillus niger Neurospora sitophilia Nettle Rabbit epithelia Fusarium moniliforme Cow epithelia Rat epithelia Sheep’s wool Mucor mucedo Hens epithelia Latex
Sensitization profiles of inhalant allergens and their geographical difference
The sensitization profiles of individual allergens according to area were summarized in Table 2. A total of 45.3% of study par- ticipants had at least 1 positivity in their skin prick tests. The mean number of allergens in sensitized patients were 4.5±2.2, and 60.8% of the participants were sensitized to more than 3 al- lergens. The positivity rate was relatively high in Daegu (54.1%) and Jeju (53.8%), and relatively low in Incheon (36.3%), Jeon- buk (33.7%), and Jeonnam (26.8%). Fig. 2 shows the overall sen- sitization rate for each allergen tested. Der f and Der p were the most commonly sensitized allergens (29.0% and 28.2%, respec- tively).
For allergen groups, about one-third (32.4%) of all the study participants were sensitized to mites. Among pollens, sensitiza- tion to tree pollens was found to be most prevalent (13.3%), fol- lowed by weed pollens (12.5%) and grass pollens (6.4%). Sensiti- zation rate to the animal allergen group was about 10%. Sensiti- zation rate to the other allergens except cat (8.1%) and dog (3.8%) were lower than 1.0%. Sensitization rates to outdoor molds were slightly higher than those to indoor molds (5.4% vs 3.7%).
Seven out of 10 sensitized patients were sensitized to house dust mites (Dp or Df). Other common inhalant allergens were cat epithelium (8.1%), birch (7.7%), mugwort (6.9%), alder (6.7%), hazel (6.7%), beech (6.7%), oak (6.6%) and Tyrophagus putres (6.2%), in decreasing order of frequency. Ninety percent cases of inhalant allergen sensitization could be detected by testing these 10 inhalant allergens.
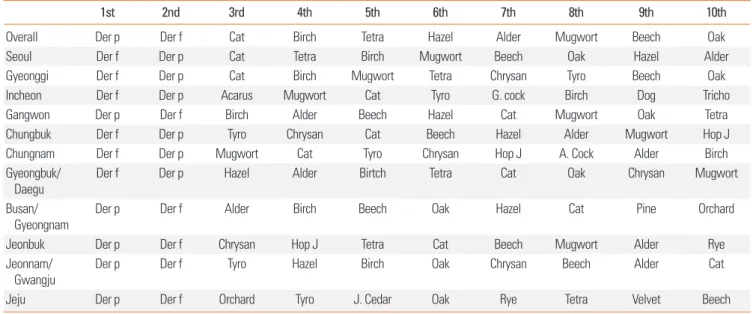
The panel of 10 most commonly sensitized inhalant allergens was similar among areas, except Chungnam and Jeju (Table 3).
Since Jeju Island is an island geographically separated from mainland Korea, its sensitization profile of inhalant allergens was considerably different from that of mainland Korea. Der f and Der p were also the most common inhalant allergens, ac- counting for 75% of inhalant allergen sensitization, and Tyroph- agus Putrescentiae, Tetranychus urticae, and mugwort were also prevalent in Jeju. However, Japanese cedar, which is the fifth most common allergen was considerably more sensitized in participants from Jeju (12.4% vs 0.6%, P<0.001). Grass pollens, such as orchard, rye, and velvet, were considerably more sensi- tized in participants from Jeju. This Jeju-specific inhalant aller- gen panel could explain 9 of 10 patients who had atopy in Jeju, which were considerably higher than the other areas (only 75%). The types of top 10 allergens were also different between Chungnam and the other areas. American cockroach, German cockroach, and Trichophyton metagrophytes were found to be area-specific.
DISCUSSION
To get representativeness, we attempted to include areas even- ly and adjusted for population according to 2010 Korean popu- lation and housing census.14 The number of subjects was about 11-fold larger than a previous multicenter study in Korea.4
The first aim of our study was to summarize variable allergens which were used in actual medical practice. Each hospital used its own inhalant panel which was not perfectly same as other hospitals. Thus, we could not determine the exact sensitization rate to each allergen. For example, Tetranychus urticae was in- cluded in not all hospitals despite belonging to the top 10 aller-
Table 3. Common inhalant allergen panel according to the residential area
1st 2nd 3rd 4th 5th 6th 7th 8th 9th 10th
Overall Der p Der f Cat Birch Tetra Hazel Alder Mugwort Beech Oak
Seoul Der f Der p Cat Tetra Birch Mugwort Beech Oak Hazel Alder
Gyeonggi Der f Der p Cat Birch Mugwort Tetra Chrysan Tyro Beech Oak
Incheon Der f Der p Acarus Mugwort Cat Tyro G. cock Birch Dog Tricho
Gangwon Der p Der f Birch Alder Beech Hazel Cat Mugwort Oak Tetra
Chungbuk Der f Der p Tyro Chrysan Cat Beech Hazel Alder Mugwort Hop J
Chungnam Der f Der p Mugwort Cat Tyro Chrysan Hop J A. Cock Alder Birch
Gyeongbuk/
Daegu Der f Der p Hazel Alder Birtch Tetra Cat Oak Chrysan Mugwort
Busan/
Gyeongnam Der p Der f Alder Birch Beech Oak Hazel Cat Pine Orchard
Jeonbuk Der p Der f Chrysan Hop J Tetra Cat Beech Mugwort Alder Rye
Jeonnam/
Gwangju Der p Der f Tyro Hazel Birch Oak Chrysan Beech Alder Cat
Jeju Der p Der f Orchard Tyro J. Cedar Oak Rye Tetra Velvet Beech
Acarus (Acarus siro), A. cock (American cockroach), Cat (Cat epithelium), Chrysan (Chrysanthemum), Def f (Dermatophagoides farina), Der P (Dermatophagoides pter- onyssinus), Dog (Dog epithelium), G. Cock (German cockroach), Hop J (Hop Japanese), J. cedar (Japanese cedar), Tetra (Tetranychus urticae), Tricho (Trichophyton metagrophytes), Tyro (Tyrophagus putres).
gens. Only 3 hospitals performed skin testing for this allergen, and 1 hospital used this allergen regularly. Furthermore, de- spite their high antigenicity, beech, oak, orchard, and timothy were not used in 3 hospitals. Some hospitals did not use cat, beech, and oak that belong to top 10 allergens. Some patients were diagnosed with atopy in one hospital, but not in another hospital. We cannot test all inhalant allergens available, so we need to make a standardized allergen panel for clinical use by considering the significance of each allergen.
The second aim of our study was to rank common sensitized inhalant allergens and to find their geographical and temporal difference. Over one-third of patients were sensitized to house dust mites (Der p and Der f). Among pollens, tree pollens was most common (tree, weed, and grass in decreasing order of fre- quency). Among animals, dog and cat epithelia were most common. This might be related to the frequency of exposure.
For the same reason, patients were more sensitized to indoor molds than outdoor molds. In 2003, common allergens were mites (Der p, Der f, and Teranychns urticae), animals (cat, dog, and cockroach), tree pollen (mixtures I, and II), mugwort, rag- weed, Japanese hop, chrysanthemum, and Jeju cedar.4 In our study, mites (Der p, Der f, and Tyrophagus), cat, tree pollen and mugwort showed higher sensitization rates. Japanese cedar or Jeju cedar was still considerably more sensitized in participants from Jeju.15 In Chungnam, cockroach and Trichophyton showed higher sensitization rates than in other areas. Com- pared to the previous 10 years, sensitization rate to mites is still higher than in other allergens.4 Among pollens, sensitization rate to tree pollens was higher than that to weed pollen. Tem- poral changes were also found geographically. The most com- mon allergens in Seoul were Der p, Der f, Tetranychus urticae, Tyrophagus putrescentiae, and Panonychus citri in decreasing order of frequency.4 However, in our study, the most common allergens in Seoul were Der p, Der f, cat, Tetranychus urticae, and mugwort. There have been several studies showing tempo- ral changes in sensitization.4, 16-17 We should investigate the rea- sons why the pattern of sensitization changes. One of the main reasons to specify the allergen panel nationally, regionally, and temporally is that amounts and types of exposure to allergens may vary among different climates and geographic characteris- tics.18 In our study, frequency and types of top 10 allergens were different among areas, especially in Chungnam and Jeju. In Jeju, many region-specific allergens found tested in many stud- ies.4,17,19 Without such studies, patients with atopy could be un- derdiagnosed in Jeju. In our study, the types of allergens were similar among the areas of mainland Korea except Chungnam, but were different between Jeju Island and them. This may due to differences in biological environment and climate. Not only current regional difference in inhalant allergens but also global warming would influence the change of allergen type in the fu- ture. More studies are needed to confirm our results. If the change is not completely determined, it may be necessary to
change the panel at regular intervals.
The third aim of our study was to find top 10 allergens. If these 10 allergens are used in the diagnosis of patients, we can detect 90% of patients with the allergen panel would be useful in hos- pitals with limited time and resources.
Our study has several limitations. First, we enrolled patients who visited mainly tertiary hospitals. A larger number of pa- tients who have mild to moderate allergic symptoms received medical treatment in local hospitals. This could be a bias to sensitized profiles. Further studies of patients who visit primary and secondary hospitals are needed. Second, some allergens were intermittently tested during the study period because of inadequate allergen supply from oversea manufacturers. Thus, the overall sensitization rate was difficult to analyze. It is impor- tant to maintain adequate allergen extract supply for further studies. In addition, it is necessary to develop allergen extracts suitable to domestic situations. Third, the difference in allergen extracts manufactured by Allergopharma, Lofama, and Allergy- Therapeutics can cause the heterogeneity of sensitization pro- files among institutions. This could be an important confound- ing. Actually, we diagnosed atopy using the same criteria irre- spective of the manufacturers. Thus, we defined allergen sensi- tization as the allergen/histamine wheal ratio (AHR) ≥1, not as absolute mean allergen wheal size ≥3 mm. Most institutions used histamine manufactured by Allergopharma (Reinbeck, Germany) and the concentration of histamine (1.0 mg/mL) is nearly the same except 1 institution (1.7 mg/mL). The skin prick test was performed by trained specialists in each institu- tion using their in-hospital protocol. Fortunately, most institu- tions used 10 common allergen extracts manufactured by Al- lergopharma. Further studies are needed to evaluate the aller- genicity of the commercial allergen extracts. Finally, we could not evaluate clinically relevance of allergens tested. Only 67.5%
of patients tested were diagnosed with allergic rhinitis or aller- gic asthma. It is difficult to correlate symptoms to positive skin test results. The aim of this study was to find the distribution of sensitized allergens in patients who were suspected to have al- lergic respiratory diseases at first visit. We are planning further study to evaluate clinically relevance of allergens in patients with allergic disease.
The present multicenter study demonstrated the geographi- cal pattern of inhalant allergen sensitization in Korean adult patients with suspected respiratory allergies. Our panel of 10 most common inhalant allergens may account for 90% of in- halant allergen sensitization in Korean adults. We hope that this panel could be utilized as a practical and convenient tool for primary practice and epidemiological surveys of respiratory al- lergic diseases.
ACKNOWLEDGMENTS
This research was supported by a fund (2014-ER5603) by Re-
search of Korea Centers for Disease Control and Prevention.
REFERENCES
1. Newson RB, van Ree R, Forsberg B, Janson C, Lötvall J, Dahlén SE, et al. Geographical variation in the prevalence of sensitization to common aeroallergens in adults: the GA(2) LEN survey. Allergy 2014;69:643-51.
2. Chan-Yeung M, Anthonisen NR, Becklake MR, Bowie D, Sonia Buist A, Dimich-Ward H, et al. Geographical variations in the prev- alence of atopic sensitization in six study sites across Canada. Al- lergy 2010;65:1404-13.
3. Salo PM, Arbes SJ Jr, Jaramillo R, Calatroni A, Weir CH, Sever ML, et al. Prevalence of allergic sensitization in the United States: re- sults from the National Health and Nutrition Examination Survey (NHANES) 2005–2006. J Allergy Clin Immunol 2014;134:350-9.
4. Kim TB, Kim KM, Kim SH, Kang HR, Chang YS, Kim CW, et al. Sen- sitization rates for inhalant allergens in Korea; a multi-center study.
J Asthma Allergy Clin Immunol 2003;23:483-93.
5. Kim YK, Kim SH, Tak YJ, Jee YK, Lee BJ, Kim SH, et al. High preva- lence of current asthma and active smoking effect among the el- derly. Clin Exp Allergy 2002;32:1706-12.
6. Song WJ, Kim SH, Lim S, Park YJ, Kim MH, Lee SM, et al. Associa- tion between obesity and asthma in the elderly population: poten- tial roles of abdominal subcutaneous adiposity and sarcopenia.
Ann Allergy Asthma Immunol 2012;109:243-8.
7. Song WJ, Chang YS, Lim MK, Yun EH, Kim SH, Kang HR, et al.
Staphylococcal enterotoxin sensitization in a community-based population: a potential role in adult-onset asthma. Clin Exp Allergy 2014;44:553-62.
8. Park HJ, Lim HS, Park KH, Lee JH, Park JW, Hong CS. Changes in allergen sensitization over the last 30 years in Korea respiratory al- lergic patients: a single-center. Allergy Asthma Immunol Res 2014;
6:434-43.
9. Park HJ, Lee JH, Park KH, Ann HW, Jin MN, Choi SY, et al. A nation- wide survey of inhalant allergens sensitization and levels of indoor major allergens in Korea. Allergy Asthma Immunol Res 2014;6:222- 7.
10. Lee JE, Ahn JC, Han DH, Kim DY, Kim JW, Cho SH, et al. Variability of offending allergens of allergic rhinitis according to age: optimi- zation of skin prick test allergens. Allergy Asthma Immunol Res 2014;6:47-54.
11. Jung JW, Choi JC, Shin JW, Kim JY, Park IW, Choi BW. Clinical char- acteristics according to sensitized allergens in adult korean pa- tients with bronchial asthma. Allergy Asthma Immunol Res 2010;2:
102-7.
12. Adinoff AD, Rosloniec DM, McCall LL, Nelson HS. Immediate skin test reactivity to Food and Drug Administration-approved stan- dardized extracts. J Allergy Clin Immunol 1990;86:766-74.
13. Neyeloff JL, Fuchs SC, Moreira LB. Meta-analyses and Forest plots using a microsoft excel spreadsheet: step-by-step guide focusing on descriptive data analysis. BMC Res Notes 2012;5:52.
14. Statistics Korea. 2010 Population and housing census. Daejeon:
Statistics Korea; 2011.
15. Lee J, Lee KH, Lee HS, Hong SC, Kim JH. Japanese cedar (Crypto- meria japonica) pollinosis in Jeju, Korea: is it increasing? Allergy Asthma Immunol Res 2015;7:295-300.
16. Kim YJ, Han JE, Kang IJ. Change of inhalant allergen sensitization in children with allergic respiratory diseases during recent 10 years.
Korean J Asthma Allergy Clin Immunol 2004;24:241-6.
17. Lee JJ, Lee KH, Kim JH. Japanese cedar (Cryptomeria japonica) pollinosis in Jeju, Korea; might it be increasing? J Allergy Clin Im- munol 2015;135:AB108.
18. Oh JW, Lee HB, Kang IJ, Kim SW, Park KS, Kook MH, et al. The re- vised edition of Korean calendar for allergenic pollens. Allergy Asthma Immunol Res 2012;4:5-11.
19. Jeon BH, Lee J, Kim JH, Kim JW, Lee HS, Lee KH. Atopy and sensiti- zation rates to aeroallergens in children and teenagers in Jeju, Ko- rea. Korean J Asthma Allergy Clin Immunol 2010;30:14-20.