© 2017 The Korean Ophthalmological Society
This is an Open Access article distributed under the terms of the Creative Commons Attribution Non-Commercial License (http://creativecommons.org/licenses /by-nc/3.0/) which permits unrestricted non-commercial use, distribution, and reproduction in any medium, provided the original work is properly cited.
Original Article
Prevalence and Factors Associated with the Use of Eye Care Services in South Korea: Korea National Health and Nutrition Examination Survey 2010–2012
Yong Seok Park1, Hwan Heo1, Byeong Jin Ye2, Young-Woo Suh3, Seung-Hyun Kim3, Shin Hae Park4, Key Hwan Lim5, Sung Jin Lee6, Song Hee Park6, Seung-Hee Baek7; The Epidemiologic Survey Committee of the
Korean Ophthalmological Society
1Department of Ophthalmology, Chonnam National University Hospital, Chonnam National University Medical School, Gwangju, Korea
2Department of Occupational and Environmental Medicine, Dong-A University Hospital, Dong-A University College of Medicine, Busan, Korea
3Department of Ophthalmology, Korea University College of Medicine, Seoul, Korea
4Department of Ophthalmology and Visual Science, Seoul St. Mary’s Hospital, College of Medicine, The Catholic University of Korea, Seoul, Korea
5Department of Ophthalmology, Ewha Womans University Mokdong Hospital, Ewha Womans University School of Medicine, Seoul, Korea
6Department of Ophthalmology, Soonchunhyang University Seoul Hospital, Seoul, Korea
7Department of Ophthalmology, Kim’s Eye Hospital, Konyang University College of Medicine, Seoul, Korea
Purpose: To estimate the factors and prevalence of eye care service utilization in the South Korean population.
Methods: This cross-sectional, population-based study included data from 22,550 Koreans aged ≥5 years who participated in the Korea National Health and Nutrition Examination Survey from 2010 to 2012. For people aged 5 to 11 years (young children), information was based on self-reports of contact with eye care service in the past year; for people aged ≥12 years (older population), the information was based on the self-reported lifetime contact with eye care service. Univariate and multivariate logistic regression analyses of the complex sample survey data were performed.
Results: The prevalence of eye care service use in young children during the past year was 61.1% (95% con- fidence interval, 58.1%–64.1%), while that in the older population during their lifetime was 73.5%. Subjects aged 7 to 11 years were more likely to have had an eye examination in the past year than subjects aged 5 to 6 years (odds ratio, 3.83; 95% confidence interval, 2.37–6.19). Multivariate logistic regression analysis indicated that higher monthly household income, being a National Health Insurance holder, and having private health insurance were related to more frequent use of eye care services in young children. For the older population and women, those living in an urban area and those with a best-corrected visual acuity less than 20 / 40 in the worse-seeing eye were more likely to have had an eye examination during their lifetime. Low education level was associated with low lifetime use of eye care services in the older population.
Conclusions: There are sociodemographic disparities with use of eye care services in South Korea. This popu- lation-based study provides information that is useful for determining different intervention programs based on sociodemographic disparities to promote eye care service utilization in South Korea.
Key Words: Eye, Healthcare disparities, National Health and Nutrition Examination Survey, Socioeconomic fac- tors, South Korea
Received: November 10, 2015 Accepted: December 21, 2015
Corresponding Author: Seung-Hee Baek, MD, PhD. Department of Ophthalmology, Kim’s Eye Hospital, Konyang University College of Medicine, #136 Yeongshin-ro, Youngdeungpo-gu, Seoul 07301, Korea. Tel: 82-2-2639-7812, Fax: 82-2-2639-9214, E-mail: [email protected]
Visual impairment associated with many ocular condi- tions can be prevented if it is detected and treated early;
therefore, it is important for eye care services to be used regularly [1]. In children, visual impairment affects cognitive and motor development, educational performance, and so- cialization, as well as quality of life later in adulthood [2-4].
Due to remarkable advances in technology, as well as our increased understanding of the developing visual system, vision screening can now be performed readily. Indeed, routine vision screening has been recommended by several medical organizations, including the American Academy of Ophthalmology, the American Academy of Pediatrics, the American Association of Pediatric Ophthalmology and Strabismus, and the American Association of Certified Or- thoptists. Furthermore, these organizations recommend screening for adults as well as for children [5-7].
Several recent studies have emphasized preschool vision screening to prevent amblyopia [8-11]. For instance, Høeg et al. [10] reported an over four-fold decrease in the preva- lence of amblyopia after the National Preschool Vision Screening program was instituted in Denmark. Further- more, as the adult population continues to age, we can ex- pect a proportionate increase in the population at risk for eye diseases such as glaucoma, age-related macular degen- eration, and diabetic retinopathy [12,13]. Therefore, we conducted this study to determine the sociodemographic factors associated with poor use of eye care services in the South Korean population (from the age of 5 years on- wards), as well as to identify potential barriers to use in subpopulations that fail to attend their recommended eye care.
The Korea Centers for Disease Control and Prevention have been conducting the Korea National Health and Nu- trition Examination Survey (KNHANES) regularly since 1998. The KNHANES is a national program designed to assess the health and nutritional status of adults and chil- dren in South Korea [14,15]. The KNHANES is an annual cross-sectional survey, and its target population comprises nationally representative non-institutionalized South Kore- an citizens. Each survey year includes a new sample of ap- proximately 10,000 individuals aged 1 year or older. Data from this survey have been used to estimate the prevalence of various diseases in the entire population and also to monitor trends in prevalence and risk factors of various health-related conditions in the South Korean population.
Since July 2008, the KNHANES has included ophthalmo-
logic interviews and examinations with help from the Ko- rean Ophthalmological Society [16]. We used the ophthal- mologic data acquired from the KNHANES Phase V (2010–2012) to investigate the use of eye care services in the South Korean population.
To our knowledge, no studies have reported the preva- lence of eye care service utilization by both children and adults in South Korea, or the associated sociodemographic factors; previous studies have focused on age-specific or disease-specific groups [17-20]. Understanding the preva- lence of eye care service utilization and associated socio- demographic factors may help with the design of tailored public eye healthcare services. Therefore, the aim of the present study was to report the estimated prevalence of eye care service utilization among the general population in South Korea, and its relationship with sociodemographic factors.
Materials and Methods
Data source and study population
The data used for this study were taken from the KN- HANES 2010–2012. The KNHANES is a nationwide, pop- ulation-based, cross-sectional health examination and sur- vey conducted regularly by the Division of Chronic Disease Surveillance of the Korea Centers for Disease Control and Prevention, under the Ministry of Health and Welfare [16,21].
The survey has three parts: health interview, health ex- amination, and nutrition survey. The health interview comprises a questionnaire that consists of both household and individual components. The household component is based on information provided by an adult respondent aged ≥19 years from a sampled household; it surveys the demographic characteristics of all members of the sampled household, as well as their income. The individual compo- nent questionnaire collects information on medical condi- tions, education and occupation, use of healthcare services, activity limitation, and quality of life and injury using a face-to-face interview conducted by trained interviewers.
The content of the individual component questionnaire differs among age groups, because the risk and prevalence of many diseases vary with age. For participants aged 5 to 11 years, the health interview questionnaire was completed
by a legal guardian. To select which households are to par- ticipate in the survey, a stratified, multistage, probabili- ty-sampling design is used; this ensures that each year’s survey result represents the entire general population of South Korea. In the 2010 to 2012 survey, all members of each selected household were asked to participate in the survey, and the participation rate was 75.9% to 77.5%.
Our cross-sectional study included data from a represen- tative sample of South Koreans aged ≥5 years; the data were collected during the fifth KNHANES (KNHANES V 1, 2, and 3, conducted in years 2010, 2011, and 2012, re- spectively). A total of 23,376 subjects had completed the Health Examination Survey and undergone ophthalmolog- ic examinations; after those aged <5 years (n = 601) and subjects who had no visual acuity data (n = 679) were ex- cluded, the remaining 22,096 were included in this study (Fig. 1). The survey adhered to the tenets of the Declara- tion of Helsinki for biomedical research and was approved by the institutional review board of the Korea Centers for Disease Control and Prevention. Written informed consent was obtained from each participant. The design of this specific study was approved by the institutional review board of Kim’s Eye Hospital, Seoul, South Korea.
Measurements
1) Dependent variable: use of eye care services
Participants aged 5 to 11 years were asked, “have you visited a healthcare provider for an eye examination within the past year? If so, specify where you had the eye exam-
ination.” Participants who had undergone eye examination specified whether it had taken place in a pediatric clinic affiliated with the National Health Insurance (NHI) Cor- poration, an ophthalmology clinic affiliated with the NHI Corporation, an opticians’ shop, or a non-NHI Corporation ophthalmologist, during the course of vision screening in school, or other.
Participants aged 12 years or older were asked, “when was the last time you had your eyes examined by an oph- thalmologist, pediatrician, or other eye care provider (e.g., an optician or a provider of vision screening in school)?”
They responded with one of the following options: within the past month, within the past year, within the past 3 years, 3 or more years ago, or never. We then categorized all respondents in this older age group into two groups:
those who had visited an eye care provider in their lifetime and those who had not.
2) Independent variables
Participants were categorized into two main age groups:
5 to 11 years (young children) and ≥12 years (older popula- tion). The young children were then further categorized into two subgroups: 5 to 6 and 7 to 11 years; the older pop- ulation was subcategorized into seven age groups (12–19, 20–29, 30–39, 40–49, 50–59, 60–69, and ≥70 years). The sociodemographic covariates were sex (men/women), monthly house income (lowest, medium–lowest, medium–
highest, highest quartiles), residential area (urban/rural), NHI status (NHI holder who was not a recipient of Nation- al Basic Livelihood Security [NBLS], or recipient of NBLS), private health insurance (PHI) status (PHI holder or not), and best-corrected visual acuity (BCVA, ≥20 / 40 and <20 / 40) in the better-seeing eye and also in the worse-seeing eye were included as covariates that might affect eye care service utilization. Residential area was classified as urban in the cities of Seoul, Busan, Daegu, Incheon, Daejeon, Gwangju, and Ulsan and all other prov- inces were classified as rural (Gyeonggi, Gangwon, Chun- gnam, Chungbuk, Jeonnam, Jeonbuk, Gyeongnam, Gyeo- ngbuk, and Jeju). Education was categorized into four levels of elementary school graduate or lower, middle school graduate, high school graduate, and university graduate or higher.
Fig. 1. Flow diagram of study participant selection. KNHANES V = Korea National Health and Nutrition Examination Survey Phase V; VA = visual acuity.
31,596 Subjects selected for KNHANES V 2010–2012 10,938 in 2010
10,589 in 2011 10,069 in 2012
24,173 Participants for KNHANES V 2010–2012 8,473 in 2010 (participation rate, 77.5%) 8,055 in 2011 (participation rate, 76.1%) 7,645 in 2012 (participation rate, 75.9%)
22,096 Participants aged 5 year or older finally included in the analysis 9,840 Males
12,256 Females
797 Subjects had not undergone ophthalmologic examination
601 Subjects under 5 year of age were excluded 679 Subjects who had no VA data were excluded 23,376 Subjects completed the ophthalmologic survey
Statistical analysis
The overall weighted prevalence rates for eye care ser- vices utilization were expressed as percentages of the study population, with 95% confidence intervals (CIs). Be- cause the results of the KNHANES V had been weighted to compensate for the complex sampling design and allow for approximations of the Korean population, weighted
analyses were performed using SPSS ver. 20.0 software (IBM Co., Armonk, NY, USA). The associations between the use of eye care services (whether or not the participant had visited an eye care provider) and age, sex, education level, monthly household income, residential area, and the BCVA values of the better-seeing eye and worse-seeing eye were analyzed using logistic regression. Odds ratios (ORs) and 95% CIs were calculated: the OR was used to
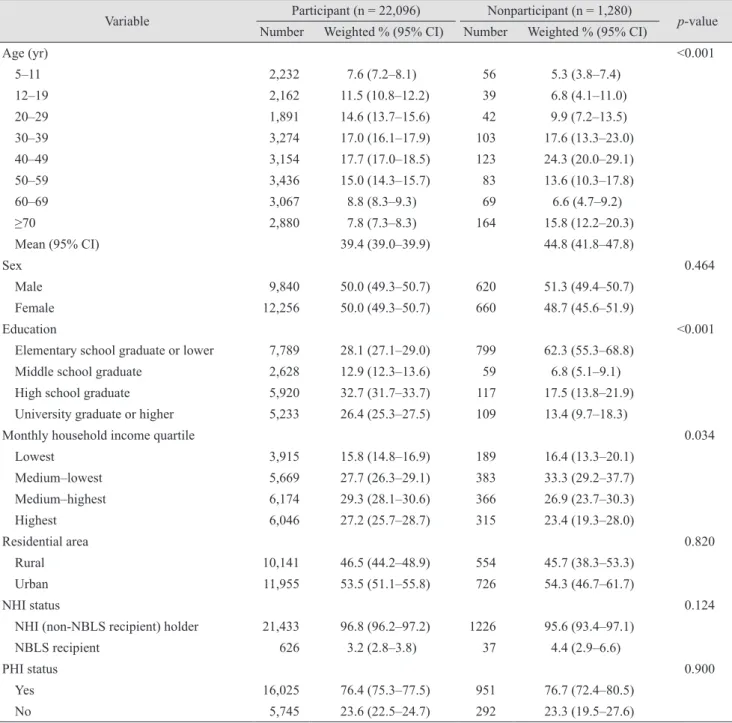
Table 1. Baseline characteristics of the study participants
Variable Participant (n = 22,096) Nonparticipant (n = 1,280)
p-value Number Weighted % (95% CI) Number Weighted % (95% CI)
Age (yr) <0.001
5–11 2,232 7.6 (7.2–8.1) 56 5.3 (3.8–7.4)
12–19 2,162 11.5 (10.8–12.2) 39 6.8 (4.1–11.0)
20–29 1,891 14.6 (13.7–15.6) 42 9.9 (7.2–13.5)
30–39 3,274 17.0 (16.1–17.9) 103 17.6 (13.3–23.0)
40–49 3,154 17.7 (17.0–18.5) 123 24.3 (20.0–29.1)
50–59 3,436 15.0 (14.3–15.7) 83 13.6 (10.3–17.8)
60–69 3,067 8.8 (8.3–9.3) 69 6.6 (4.7–9.2)
≥70 2,880 7.8 (7.3–8.3) 164 15.8 (12.2–20.3)
Mean (95% CI) 39.4 (39.0–39.9) 44.8 (41.8–47.8)
Sex 0.464
Male 9,840 50.0 (49.3–50.7) 620 51.3 (49.4–50.7)
Female 12,256 50.0 (49.3–50.7) 660 48.7 (45.6–51.9)
Education <0.001
Elementary school graduate or lower 7,789 28.1 (27.1–29.0) 799 62.3 (55.3–68.8) Middle school graduate 2,628 12.9 (12.3–13.6) 59 6.8 (5.1–9.1)
High school graduate 5,920 32.7 (31.7–33.7) 117 17.5 (13.8–21.9)
University graduate or higher 5,233 26.4 (25.3–27.5) 109 13.4 (9.7–18.3)
Monthly household income quartile 0.034
Lowest 3,915 15.8 (14.8–16.9) 189 16.4 (13.3–20.1)
Medium–lowest 5,669 27.7 (26.3–29.1) 383 33.3 (29.2–37.7)
Medium–highest 6,174 29.3 (28.1–30.6) 366 26.9 (23.7–30.3)
Highest 6,046 27.2 (25.7–28.7) 315 23.4 (19.3–28.0)
Residential area 0.820
Rural 10,141 46.5 (44.2–48.9) 554 45.7 (38.3–53.3)
Urban 11,955 53.5 (51.1–55.8) 726 54.3 (46.7–61.7)
NHI status 0.124
NHI (non-NBLS recipient) holder 21,433 96.8 (96.2–97.2) 1226 95.6 (93.4–97.1)
NBLS recipient 626 3.2 (2.8–3.8) 37 4.4 (2.9–6.6)
PHI status 0.900
Yes 16,025 76.4 (75.3–77.5) 951 76.7 (72.4–80.5)
No 5,745 23.6 (22.5–24.7) 292 23.3 (19.5–27.6)
CI = confidence interval; NHI = National Health Insurance; NBLS = National Basic Livelihood Security; PHI = private health insurance.
assess the mutually confounding effect of these variables on the likelihood of eye care utilization. A p-value <0.05 indicated statistical significance.
Results
Baseline characteristics
In total, 22,096 Koreans (2,232 young children and 19,864 older people), representative of 47,990,761 Koreans (based on the 2010 Census of Korea), were included in this study. The characteristics of the study population are shown in Table 1. The mean age of the study participants was 39.4 years (95% CI, 39.0–39.9 years), and 797 subjects who had not undergone ophthalmologic examination, 601 subjects under 5 years of age, and 679 subjects who had no visual acuity data were excluded. The nonparticipants were more likely to be in the older age groups, less educat- ed, and in the lower household income group than the par- ticipants. However, the distributions of sex, residential area, NHI status, and possession of PHI to supplement NHI coverage were not significantly different between participants and nonparticipants.
Use of eye care services in young children
In young children, the weighted prevalence of the eye care service utilization within the past year was 61.1%
(95% CI, 58.1%–64.1%). More than half of the population (56.3%; 95% CI, 52.6%–59.9%) had received eye care ser- vices by visiting an ophthalmology clinic (including NHI Corporation clinics); the next largest proportion had under- gone school vision screening (19.8%; 95% CI, 17.0%–
23.0%). A smaller portion of subjects visited an optician’s shop (7.4%; 95% CI, 5.7%–9.5%), and the smallest portion of subjects attended a pediatric clinic (4.1%; 95% CI, 2.8%–6.0%). Fig. 2 shows the types of eye care services that were used by young children within the past year.
The associations between various factors and the use of eye care services within the past year among young chil- dren are described in Table 2. The use of eye care services was significantly associated with age, sex, and monthly household income, but not with residential area, NHI sta- tus, PHI status, or BCVA of either the better-seeing eye or the worse-seeing eye in univariate analysis. In multivariate
analysis, no association was found between the use of eye care services and sex, but there was a significant associa- tion with age, monthly household income, NHI status, and PHI status. Notably, the odds of eye care service utilization increased as monthly household income increased and were 14.6 times higher in the highest monthly household income group than in the lowest one (95% CI, 2.45–87.03).
A strong association between eye care services utilization was also found with NHI status (OR, 10.18; 95% CI, 1.01–
102.32) and PHI status (OR, 2.37; 95% CI, 1.06–5.39): NHI holders who were not non-NBLS recipients were 10.18 times more likely to have used an eye care service in the past year than recipients of NBLS, and PHI holders were 2.4 times more likely to have used one in the past year than non-PHI holders.
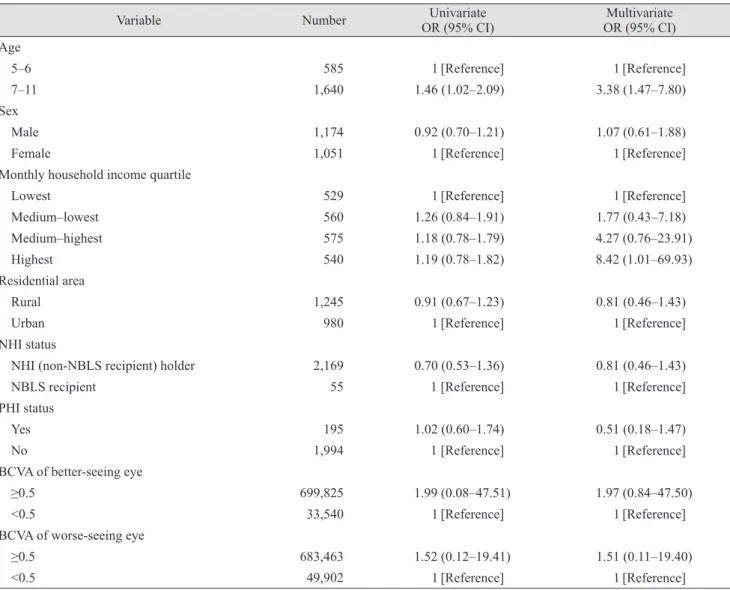
Table 3 shows the associations between sociodemo- graphic factors and eye care in an ophthalmology clinic during the previous year for young children. Age was the only significant factor in univariate analysis, whereas age and monthly household income were both significant fac- tors associated with ophthalmology clinic visits in the mul- tivariate analysis. Young children in the older age group (7–11 years) were significantly more likely to have visited an ophthalmology clinic than children in the younger age group (5–6 years), even when controlling for other factors;
conversely, children in the highest monthly household in- come group were more likely to have received eye care in an ophthalmology clinic than those in the lowest group, but only when age and other variables had been controlled (OR, 8.42; 95% CI, 1.01–69.93).
70 60 50 40 30 20 10 0
Types of eye care services
Weighted prevalence (%)
Ophthalmology
clinic Vision screening
in school Optician’s shop NHI Corporation pediatric clinic Others
Fig. 2. Types of eye care services used by younger children aged 5 to 11 years during the previous year. NHI = National Health Insurance.
90 85 80 75 70 65
60
Age group (yr)
Weighted prevalence (%)
12–19 20–29 30–39 40–49 50–59 60–69 over 70
A 55
50 45 40 35 30 25 20
Age group (yr)
Weighted prevalence (%)
12–19 20–29 30–39 40–49 50–59 60–69 over 70
B
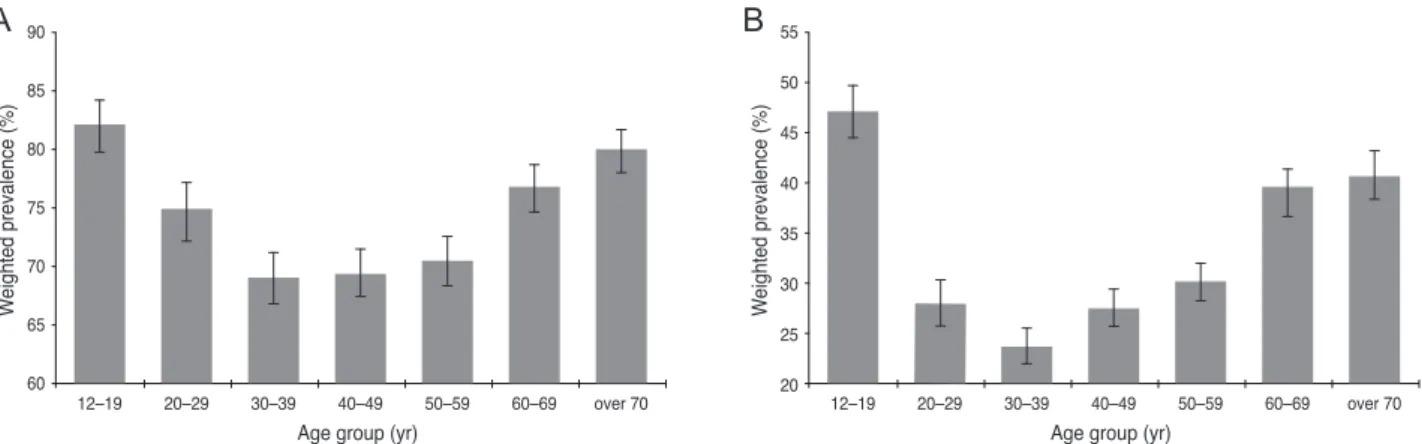
Fig. 3. Weighted prevalence of eye care service utilization in the older population (aged ≥12 years). (A) Weighted prevalence of lifetime use of eye care services. (B) Weighted prevalence of eye care service utilization in the past year.
Table 2. Univariate and multivariate logistic regression for eye care service utilization during the previous year in young children aged 5 to 11 years
Variable Number Univariate OR (95% CI) Multivariate OR (95% CI)
Age
5–6 585 1 [Reference] 1 [Reference]
7–11 1,640 3.27 (2.51–4.26) 3.83 (2.37–6.19)
Sex
Male 1,174 1 [Reference] 1 [Reference]
Female 1,051 1.35 (1.10–1.66) 1.31 (0.85–2.01)
Monthly household income quartile
Lowest 529 1 [Reference] 1 [Reference]
Medium–lowest 560 1.49 (0.99–2.27) 2.82 (1.03–7.65)
Medium–highest 575 1.39 (0.92–2.10) 6.67 (1.64–27.09)
Highest 540 1.57 (1.03–2.39) 14.61 (2.45–87.03)
Residential area
Rural 1,245 1.26 (0.98–1.64) 0.91 (0.53–1.56)
Urban 980 1 [Reference] 1 [Reference]
NHI status
NHI (non-NBLS recipient) holder 2,169 0.90 (0.50–1.64) 10.18 (1.01–102.32)
NBLS recipient 55 1 [Reference] 1 [Reference]
PHI status
Yes 195 1 [Reference] 2.37 (1.06–5.39)
No 1,994 1.08 (0.70–1.67) 1 [Reference]
BCVA of better-seeing eye
≥0.5 699,825 0.82 (0.29–2.32) 1.31 (0.15–11.39)
<0.5 33,540 1 [Reference] 1 [Reference]
BCVA of worse-seeing eye
≥0.5 683,463 0.67 (0.32–1.40) 0.83 (0.15–4.63)
<0.5 49,902 1 [Reference] 1 [Reference]
OR = odds ratio; CI = confidence interval; NHI = National Health Insurance; NBLS = National Basic Livelihood Security; PHI = private health insurance; BCVA = best-corrected visual acuity.
Table 3. Univariate and multivariate logistic regression for ophthalmology clinic visits during the previous year in young children aged 5 to 11 years
Variable Number Univariate
OR (95% CI) Multivariate
OR (95% CI) Age
5–6 585 1 [Reference] 1 [Reference]
7–11 1,640 1.46 (1.02–2.09) 3.38 (1.47–7.80)
Sex
Male 1,174 0.92 (0.70–1.21) 1.07 (0.61–1.88)
Female 1,051 1 [Reference] 1 [Reference]
Monthly household income quartile
Lowest 529 1 [Reference] 1 [Reference]
Medium–lowest 560 1.26 (0.84–1.91) 1.77 (0.43–7.18)
Medium–highest 575 1.18 (0.78–1.79) 4.27 (0.76–23.91)
Highest 540 1.19 (0.78–1.82) 8.42 (1.01–69.93)
Residential area
Rural 1,245 0.91 (0.67–1.23) 0.81 (0.46–1.43)
Urban 980 1 [Reference] 1 [Reference]
NHI status
NHI (non-NBLS recipient) holder 2,169 0.70 (0.53–1.36) 0.81 (0.46–1.43)
NBLS recipient 55 1 [Reference] 1 [Reference]
PHI status
Yes 195 1.02 (0.60–1.74) 0.51 (0.18–1.47)
No 1,994 1 [Reference] 1 [Reference]
BCVA of better-seeing eye
≥0.5 699,825 1.99 (0.08–47.51) 1.97 (0.84–47.50)
<0.5 33,540 1 [Reference] 1 [Reference]
BCVA of worse-seeing eye
≥0.5 683,463 1.52 (0.12–19.41) 1.51 (0.11–19.40)
<0.5 49,902 1 [Reference] 1 [Reference]
OR = odds ratio; CI = confidence interval; NHI = National Health Insurance; NBLS = National Basic Livelihood Security; PHI = private health insurance; BCVA = best-corrected visual acuity.
80 70 60 50 40 30 20 10 0
Eye care utilization
Weighted prevalence (%)
At least once
26.5%
Never 73.5%
Over 36 mon
Within 12–36 mon
Within 1–12 mon
Within 1 mon
Fig. 4. Elapsed time since last use of eye care services in the older pop- ulation (aged ≥12 years). The weighted prevalence for those who had never had eye care in their lifetime was 26.5% (95% CI, 25.4%–27.6%).
In those who had eye care at least once, the weighted prevalence was 22.1% (95% CI, 21.3%–22.9%), 19.5% (95% CI, 18.7%–20.3%), 25.9%
(95% CI, 25.1%–26.7%), and 6.1% (95% CI, 5.7%–6.6%) in the over 36 months, within 12–36 months, within 1–12 months, and within 1 month groups, respectively. CI = confidence interval.
Use of eye care service in the older population The weighted prevalence of lifetime use of eye care ser- vices in the older population was 73.5% (95% CI, 72.4%–
74.6%). The age group-specific weighted prevalence of lifetime use of eye care services is shown in Fig. 3A. Life- time use of eye care services was highest in those aged 12 to 19 years (82.1%; 95% CI, 79.8%–84.2%) and lowest in Table 4. Univariate and multivariate logistic regression for lifetime eye care use in the older population (aged ≥12 years)
Variable Number Univariate OR (95% CI) Multivariate OR (95% CI)
Age
12–19 2,155 1.14 (0.95–1.38) 1.71 (1.06–2.74)
20–29 1,891 0.74 (0.63–0.88) 0.88 (0.54–1.44)
30–39 3,271 0.55 (0.47–0.64) 0.46 (0.28–0.74)
40–49 3,153 0.56 (0.48–0.66) 0.62 (0.39–0.99)
50–59 3,434 0.59 (0.51–0.69) 0.86 (0.59–1.26)
60–69 3,064 0.82 (0.71–0.96) 1.09 (0.82–1.45)
≥70 2,876 1 [Reference] 1 [Reference]
Sex
Male 8,657 1 [Reference] 1 [Reference]
Female 11,187 1.62 (1.50–1.77) 1.78 (1.47–2.16)
Monthly household income quartile
Lowest 5,443 1 [Reference] 1 [Reference]
Medium–low 5,370 0.88 (0.77–1.01) 0.97 (0.73–1.30)
Medium–high 5,025 0.91 (0.79–1.03) 0.98 (0.67–1.43)
Highest 3,738 0.99 (0.86–1.14) 1.07 (0.61–1.85)
Residential area
Rural 10,690 1 [Reference] 1 [Reference]
Urban 9,154 1.10 (1.01–1.20) 1.35 (1.04–1.73)
NHI status
NHI (non-NBLS recipient) holder 19,240 1 [Reference] 1 [Reference]
NBLS recipient 569 1.01 (0.80–1.29) 0.95 (0.56–1.59)
PHI status
No 5,543 1 [Reference] 1 [Reference]
Yes 14,014 0.92 (0.84–1.01) 0.97 (0.74–1.28)
BCVA of better-seeing eye
≥0.5 3,983 1 [Reference] 1 [Reference]
<0.5 581 1.63 (1.35–1.96) 0.87 (0.59–1.28)
BCVA of worse-seeing eye
≥0.5 3,454 1 [Reference] 1 [Reference]
<0.5 1,110 1.19 (1.03–1.38) 1.70 (1.22–2.37)
Education
Elementary school graduate or lower 5,563 0.61 (0.55–0.68) 0.56 (0.37–0.85)
Middle school graduate 2,623 0.78 (0.69–0.89) 0.70 (0.46–1.07)
High school graduate 5,918 1.07 (0.97–1.18) 0.77 (0.53–1.10)
University graduate or higher 5,229 1 [Reference] 1 [Reference]
OR = odds ratio; CI = confidence interval; NHI = National Health Insurance; NBLS = National Basic Livelihood Security; PHI = private health insurance; BCVA = best-corrected visual acuity.
those aged 30 to 39 years (69.0%; 95% CI, 66.8%–71.1%).
The prevalence of eye care service utilization during the past year demonstrated similar patterns throughout all age groups: the highest prevalence was in those aged 12 to 19 years (47.1%; 95% CI, 44.4%–49.9%) and the lowest was found in those aged 30 to 39 years (23.7%; 95% CI, 22.0%–
25.5%). The age group-specific weighted prevalence of eye care service utilization during the past year is shown in Fig. 3B. The likelihood that a given participant had used eye care services gradually decreased through the ages of 12 to 19 years and 30 to 39 years and then gradually in- creased with advancing age. Fig. 4 shows the elapsed time from the last use of eye care services in the older popula- tion. The weighted prevalence in those who had never used eye care was 26.5% (95% CI, 25.4%–27.6%).
Table 4 shows the results of the univariate and multivar- iate analyses for the associations between various sociode- mographic factors and the likelihood of lifetime use of eye care services in the older population. Univariate analysis indicated significant association between the use of eye care services and age, sex, residential area, BCVA of the better-seeing and the worse-seeing eye, and education lev- el. Unlike young children, no association was found be- tween lifetime use of eye care services and monthly house- hold income, NHI status, or PHI status in the older population. In multivariate analysis, there was a significant relationship between the use of eye care services and age, sex, residential area, BCVA of the worse-seeing eye, and education level. Women were more likely to have received eye care services than men (OR, 1.78; 95% CI, 1.47–2.16), and urban residents were more likely to have received eye care than rural residents (OR, 1.35; 95% CI, 1.04–1.73). The odds of elementary school graduates or lower having re- ceived eye care were 0.56 times lower than that of those with university or higher level education (95% CI, 0.37–
0.85).
Discussion
We classified our participants into young children (aged 5–11 years) and an older population (≥12 years) based on vision development and frequency of vision-screening ex- aminations at specific ages. Children tended to regularly use eye care services as part of health-screening programs for infants and children that are funded under the NHI
Act, as well as a vision-screening program that was intro- duced by the School Health Act in South Korea. Specifi- cally, infants and children undergo health screenings that include examinations for normal healthy growth; these in- clude growth and development assessments and infant care consultations that reinforce health education. Before the age of 6 years, children may undergo up to seven screen- ing examinations, i.e., at 4, 9, 18, 30, 42, 54, and 66 months.
Under the School Health Act, first and fourth graders in elementary school, first year middle schoolers, and high school students are eligible for school-based vision-screen- ing examinations at designated clinics; the examinations include tests for visual acuity, color vision, and common ocular diseases such as conjunctivitis, epiblepharon, and strabismus. In addition, school health staff check children’s visual acuity in the second, third, fifth, and sixth grades of elementary school, so that all grades in elementary school, the first year in middle school, and high school students are assessed regularly. Moreover, school health staff rec- ommend that students undergo a more thorough examina- tion if visual acuity in either eye is less than 20 / 30.
Eye care service at ophthalmology clinics can be distin- guished from pediatric clinics and optician shops or any other screening eye care services. Uncorrected visual acui- ty within the normal range does not guarantee that the eye is free of ophthalmologic disorders, and visual acuity can- not be fully corrected in those with amblyopia or other eye disorders. The Korean Ophthalmological Society suggests that everyone between 3 to 4 years of age should go through ophthalmologic examinations even if they do not have symptomatic ophthalmologic problems. Therefore, we also analyzed factors associated with children visiting ophthalmologists.
The estimated prevalence of eye care service utilization in young children during the previous year was 61.1% (95%
CI, 58.1%–64.1%), which is higher than in the United States and Taiwan, where the annual rate of eye care ser- vice use was 57.4% and 43.5%, respectively, in children with ocular disease and 49.3% and 22.5% in children with- out ocular disease [13,22]. These differences between countries may exist because U.S. citizens do not have com- pulsory NHI. South Korea has a nationwide universal health system, the NHI Corporation, which is a single in- surer that provides health insurance for most citizens liv- ing in the country. The NHI covers the majority of citi- zens, while the NBLS covers the poor and other specified
groups. All South Korean citizens are compulsorily benefi- ciaries of either the NHI or NBLS. People who receive coverage pay a certain portion of their healthcare costs as a co-payment; this portion is determined differently de- pending on whether the individual is using inpatient or outpatient services, as well as the type and level of the healthcare institution. People who want coverage of ser- vices that the NHI system does not cover can get addition- al PHI.
Recent research has indicated that screening leads to im- proved visual outcomes due to consequent early treatment in children aged 18 months to 5 years; however, in this study, the prevalence of eye care service utilization in chil- dren aged 5 to 6 years (39.4%; 95% CI, 34.0%–45.1%) was significantly lower than in those aged 7 to 11 years (68.0%;
95% CI, 64.7%–71.2%). This discrepancy by age group may have occurred because children aged 7 to 11 years can complain about the loss of vision or visual symptom com- pared with younger children (aged 5–6 years). However, our data indicate no association between visual acuity and the use of eye care services in young children; this dis- crepancy may have occurred because the school vi- sion-screening program is compulsory, whereas the health-screening programs for children aged 5 to 6 years are not mandatory. Our results suggest that many South Koreans do not follow the recommendations to visit an eye care professional every 1 to 2 years, especially for younger children [23]. Su et al. [24] reported that lack of parental awareness is an important barrier to children receiving vi- sion screening, and Williams et al. [25] reported that fami- ly unawareness of the need for care is a major obstacle to ophthalmologic care in at-risk pediatric populations. A na- tionwide intervention program aimed at increasing aware- ness of the importance of eye care in children aged 5 to 6 years should be implemented.
Coupled with the rapid increase in the number of health facilities in recent decades, the public health financing pol- icy has improved access to healthcare facilities in South Korea [26]; however, there are significant economic and insurance factors associated with eye care utilization by young children. An individual NHI holder is about 10 times more likely to have had eye care in the previous year, and those having PHI are about twice as likely to have sought eye care for young children in the past year.
However, no difference in receiving eye care at ophthal- mology clinic was revealed by NHI status or PHI status.
Moreover, the younger children in the highest monthly household income group were more likely to have had eye care at an ophthalmology clinic in the previous year. This indicates that having national and/or PHI could lead to in- creased screening, but not to increased ophthalmology clinic visits. A patient might visit an ophthalmology clinic only if they were recommended for further evaluation for abnormal results in screening; additionally economic bar- riers might prevent care at an ophthalmology clinic, re- gardless of health insurance status. Since eye care for chil- dren is initiated by their caregivers, an intervention program and insurance policy should be put in place to en- sure that children receive the eye care they need at the ap- propriate times, regardless of family income status.
In this study, women in the older population were more likely to have attended eye care services than men; this corroborates with reports from other countries [27-30]. For example, Lee et al. [27] reported that women in the United States use eye care services more often than men, and this is consistent with the Beaver Dam Eye Study [31]. In con- trast, Nirmalan et al. [32] and Emamian et al. [33] reported that men were more likely to have received eye care ser- vices in hospitals in rural India and Northern Iran. Fur- thermore, a sex difference in the prevalence of visual im- pairment has been noted in both high-income and low-income countries [34-37]. The main cause of this dis- parity is that, in low-income countries, women use eye care services much less frequently [38]. Park et al. [18] re- ported in another study that used the KNHANES Phase V survey that the prevalence of low vision and blindness was generally higher among women than men in South Korea.
In the present study, the odds of eye care service utiliza- tion was higher in women than man even after adjusting the vision by BCVA ≥20 / 40 or <20 / 40 in the better-see- ing eye and also in the worse-seeing eye. Additional re- search is required to determine whether the more frequent use of eye care services among women can be explained by their higher prevalence of low vision and blindness.
This study found that South Korea individuals in the older population with higher education levels tended to use eye care services more often than those with lower educa- tion; this is consistent with other reports [39-41]. Parental educational level is also important, because it affects not only personal use of eye care services, but also children’s access to care. Several studies have shown that children with eye diseases whose parents have a lower level of edu-
cation receive a lower level of eye care [27,28,39]. Further- more, numerous studies have shown that the quality of physician-patient communication is lower among the less educated than among more educated patients [27].
In our study, the aforementioned economic and insur- ance factors were not related to the use of eye care services in the older age population. This suggests that, in contrast with some other reports, financial constraints were not sig- nificant barriers to eye care in older individuals in our population because most are covered by the NHI system. In contrast with our study, several studies have shown that eye care is less common among uninsured adults [27,28,42,43].
Specifically, Lee et al. [27] reported that adults who had experienced an interruption in their health insurance cov- erage in the previous 12 months were less likely to have reported visiting an ocular healthcare provider than those who were consistently insured. They estimated that 3.8%
(7.8 million) of community-dwelling adults in the United States reported an insurance-coverage gap in the past 12 months. They also found that adults with concurrent pri- vate and public healthcare coverage were generally more likely to have reported an ocular healthcare visit in the preceding 12 months than were adults who had private in- surance only, even after adjusting for sex, level of visual impairment, and education. These differences between countries may exist because U.S. citizens do not have com- pulsory NHI. Together, these results indicate that, while economic and insurance factors were not related to the use of eye care services in the older population of South Ko- rea, men, rural residents, and those with better visual acui- ty in the worse-seeing eye were less likely to have had an eye examination during their lifetime. One possible expla- nation for this is that the older population may encourage their children to receive eye care, because of their econom- ic status, but they may not have time or accessibility for their own eye care; in addition, accessing facilities may be difficult in terms of time and geographic distance, and these individuals may not prioritize eye care in the absence of serious vision impairment. Therefore, different inter- vention programs or campaigns are needed and should be customized for specific age groups. Education or cam- paigns to emphasize the importance of regular eye check- up are needed for the older South Korean population rather than encouraging them to buy PHI.
There were several limitations to our study. First, the non-response rate in the KNHANES ranged from 24.1% to
22.5% between 2010 and 2012, and non-response to the survey introduced a bias. Researchers conducting the KN- HANES must devise and implement methods for reducing this bias during the KNHANES data analysis. Similarly, our data may have some degree of recall bias, and the cor- relations identified in this cross-sectional study do not nec- essarily ensure causal relationships. Second, comparison of our study participants and nonparticipants revealed sig- nificant differences: nonparticipants were more likely to be older and less educated than participants. These differenc- es in age and education between participants and non-par- ticipants in our study may have led to an underestimation of eye care services utilization. Our results show that the elderly population (aged ≥70 years) tended to use eye care services more than younger age groups (OR, 0.46; 95% CI, 0.28–0.74 for age 30–39 years; OR, 0.62; 95% CI, 0.39–0.99 for age 40–49 years), whereas the least educated group (el- ementary school or lower) tended to use eye care services less than the more highly educated population (OR, 0.56).
Third, we did not compare individuals diagnosed with a specific eye condition, e.g., diabetic retinopathy or glauco- ma, to those without eye disease. Individuals with diabetic retinopathy or glaucoma may be more likely to have used eye care services, because these conditions necessitate reg- ular check-ups. To assess eye health, we analyzed the BCVA values in the better-seeing and the worse-seeing eye; however, glaucoma patients with peripheral visual field defects and central vision sparring may have good BCVA. Additional research is needed to assess whether specific eye conditions are related to the use of eye care services.
Despite the above limitations, one notable strength of this study was the large sample size (n = 22,096), which is representative of the general South Korean population in all age groups older than 5 years. Furthermore, the validity of our results was controlled; we used a standardized pro- tocol, and our examiners were periodically trained by act- ing staff members of the Epidemiologic Survey Commit- tee of the Korean Ophthalmological Society. Our findings could be used to promote the use of eye care in South Ko- rea and to identify specific sub-groups that should receive additional education about care resources.
In conclusion, in South Korea, there are sociodemo- graphic disparities that correlate with the use of eye care services. Our current study has demonstrated that there are significant differences in socioeconomic factors of
household income, NHI status, and PHI status in children aged 5 to 11 years. Females, who are generally considered to have a more flexible work schedule, may have more time to use eye care services, as well as people who living in urban areas, where they can easily access eye care ser- vice. People that have difficulty with daily activity with a BCVA less than 20 / 40 in the worse-seeing eye are more likely to use eye care services during their lifetime; how- ever, people with low education levels and those ≥12 years of age are not likely to use eye care service during their lifetime. Awareness must be increased to address these disparities, and targeted intervention programs must be es- tablished to increase access to eye care services. The find- ings of this population-based study will provide useful in- formation for policy makers and program planners to promote the use of eye care services in South Korea.
Conflict of Interest
No potential conflict of interest relevant to this article was reported.
References
1. Congdon N, O’Colmain B, Klaver CC, et al. Causes and prevalence of visual impairment among adults in the Unit- ed States. Arch Ophthalmol 2004;122:477-85.
2. Ganz ML, Xuan Z, Hunter DG. Prevalence and correlates of children’s diagnosed eye and vision conditions. Ophthal- mology 2006;113:2298-306.
3. Wong HB, Machin D, Tan SB, et al. Visual impairment and its impact on health-related quality of life in adolescents.
Am J Ophthalmol 2009;147:505-11.
4. Chadha RK, Subramanian A. The effect of visual impair- ment on quality of life of children aged 3-16 years. Br J Ophthalmol 2011;95:642-5.
5. Eye examination and vision screening in infants, children, and young adults: American Academy of Pediatrics Com- mittee on Practice and Ambulatory Medicine, Section on Ophthalmology. Pediatrics 1996;98:153-7.
6. American Academy of Pediatrics; Section on Ophthalmol- ogy; American Association for Pediatric Ophthalmology and Strabismus, et al. Red reflex examination in neonates, infants, and children. Pediatrics 2008;122:1401-4.
7. Beauchamp GR, Ellepola C, Beauchamp CL. Evi- dence-based medicine: the value of vision screening. Am Orthopt J 2010;60:23-7.
8. Solebo AL, Cumberland PM, Rahi JS. Whole-population vision screening in children aged 4-5 years to detect am- blyopia. Lancet 2015;385:2308-19.
9. Moradabadi AS, Ghanbarnejad A, Bani-Hashemi A, et al.
Amblyopia screening in children in Bandar Abbas (Iran) during 2011-2012. Electron Physician 2014;6:906-11.
10. Hoeg TB, Moldow B, Ellervik C, et al. Danish Rural Eye Study: the association of preschool vision screening with the prevalence of amblyopia. Acta Ophthalmol 2015;93:322-9.
11. Chen X, Fu Z, Yu J, et al. Prevalence of amblyopia and strabismus in Eastern China: results from screening of pre- school children aged 36-72 months. Br J Ophthalmol 2016;100:515-9.
12. Cho W, Lee S, Kang HY, Kang M. Setting national priori- ties for quality assessment of health care services in Korea.
Int J Qual Health Care 2005;17:157-65.
13. Choi YJ, Kim HC, Kim HM, et al. Prevalence and manage- ment of diabetes in Korean adults: Korea National Health and Nutrition Examination Surveys 1998-2005. Diabetes Care 2009;32:2016-20.
14. Kim Y. The Korea National Health and Nutrition Exam- ination Survey (KNHANES): current status and challeng- es. Epidemiol Health 2014;36:e2014002.
15. Kweon S, Kim Y, Jang MJ, et al. Data resource profile: the Korea National Health and Nutrition Examination Survey (KNHANES). Int J Epidemiol 2014;43:69-77.
16. Yoon KC, Mun GH, Kim SD, et al. Prevalence of eye dis- eases in South Korea: data from the Korea National Health and Nutrition Examination Survey 2008-2009. Korean J Ophthalmol 2011;25:421-33.
17. Park Y, Shin JA, Yang SW, et al. The relationship between visual impairment and health-related quality of life in Ko- rean adults: The Korea National Health and Nutrition Ex- amination Survey (2008-2012). PLoS One 2015;10:e0132779.
18. Park SH, Lee JS, Heo H, et al. A nationwide popula- tion-based study of low vision and blindness in South Ko- rea. Invest Ophthalmol Vis Sci 2014;56:484-93.
19. Lim HT, Yoon JS, Hwang SS, Lee SY. Prevalence and as- sociated sociodemographic factors of myopia in Korean children: the 2005 third Korea National Health and Nutri- tion Examination Survey (KNHANES III). Jpn J Ophthal- mol 2012;56:76-81.
20. Ahn JM, Lee SH, Rim TH, et al. Prevalence of and risk
factors associated with dry eye: the Korea National Health and Nutrition Examination Survey 2010-2011. Am J Oph- thalmol 2014;158:1205-14.
21. Yoon KC, Choi W, Lee HS, et al. An overview of ophthal- mologic survey methodology in the 2008-2015 Korean Na- tional Health and Nutrition Examination Surveys. Korean J Ophthalmol 2015;29:359-67.
22. Ganz M, Xuan Z, Hunter DG. Patterns of eye care use and expenditures among children with diagnosed eye condi- tions. J AAPOS 2007;11:480-7.
23. Rowe S, MacLean CH, Shekelle PG. Preventing visual loss from chronic eye disease in primary care: scientific review.
JAMA 2004;291:1487-95.
24. Su Z, Marvin EK, Wang BQ, et al. Identifying barriers to follow-up eye care for children after failed vision screening in a primary care setting. J AAPOS 2013;17:385-90.
25. Williams S, Wajda BN, Alvi R, et al. The challenges to ophthalmologic follow-up care in at-risk pediatric popula- tions. J AAPOS 2013;17:140-3.
26. Moon S, Shin J. Performance of universal health insurance:
lessons from South Korea. World Health Popul 2007;9:95- 113.
27. Lee DJ, Lam BL, Arora S, et al. Reported eye care utiliza- tion and health insurance status among US adults. Arch Ophthalmol 2009;127:303-10.
28. Morales LS, Varma R, Paz SH, et al. Self-reported use of eye care among Latinos: the Los Angeles Latino Eye Study.
Ophthalmology 2010;117:207-15.
29. McGwin G, Khoury R, Cross J, Owsley C. Vision impair- ment and eye care utilization among Americans 50 and older. Curr Eye Res 2010;35:451-8.
30. Jin YP, Trope GE. Eye care utilization in Canada: disparity in the publicly funded health care system. Can J Ophthal- mol 2011;46:133-8.
31. Puent BD, Klein BE, Klein R, et al. Factors related to vision care in an older adult cohort. Optom Vis Sci 2005;82:612-6.
32. Nirmalan PK, Katz J, Robin AL, et al. Utilisation of eye care services in rural south India: the Aravind Comprehen- sive Eye Survey. Br J Ophthalmol 2004;88:1237-41.
33. Emamian MH, Zeraati H, Majdzadeh R, et al. Economic inequality in eye care utilization and its determinants: a
Blinder-Oaxaca decomposition. Int J Health Policy Manag 2014;3:307-13.
34. Perruccio AV, Badley EM, Trope GE. A Canadian popula- tion-based study of vision problems: assessing the signifi- cance of socioeconomic status. Can J Ophthalmol 2010;45:477-83.
35. Ulldemolins AR, Lansingh VC, Valencia LG, et al. Social inequalities in blindness and visual impairment: a review of social determinants. Indian J Ophthalmol 2012;60:368- 75.
36. Robinson B, Feng Y, Woods CA, et al. Prevalence of visual impairment and uncorrected refractive error: report from a Canadian urban population-based study. Ophthalmic Epi- demiol 2013;20:123-30.
37. Ferraz FH, Corrente JE, Opromolla P, Schellini SA. Influ- ence of uncorrected refractive error and unmet refractive error on visual impairment in a Brazilian population. BMC Ophthalmol 2014;14:84.
38. Courtright P, Bassett K. Gender and blindness: eye disease and the use of eye care services. Community Eye Health 2003;16:11-2.
39. Fang YT, Chou YJ, Liu CY, et al. Factors associated with subsequent eye care for children in Taiwan: a popula- tion-based historical cohort study. Ophthalmic Epidemiol 2012;19:350-7.
40. Do YK, Eggleston KN. Educational disparities in quality of diabetes care in a universal health insurance system: ev- idence from the 2005 Korea National Health and Nutrition Examination Survey. Int J Qual Health Care 2011;23:397- 404.
41. Wang D, Ding X, He M, et al. Use of eye care services among diabetic patients in urban and rural China. Oph- thalmology 2010;117:1755-62.
42. Centers for Disease Control and Prevention (CDC). Eye- care utilization among women aged > or =40 years with eye diseases: 19 states, 2006-2008. MMWR Morb Mortal Wkly Rep 2010;59:588-91.
43. Keeffe JE, Weih LM, McCarty CA, Taylor HR. Utilisation of eye care services by urban and rural Australians. Br J Ophthalmol 2002;86:24-7.