서 론
2008–2015
지역건강통계에 따르면 전국 성인 남녀의 운전 시 안전 벨트 착용률은2008
년도87
.6
%에서2012
년도74
.0
%로 감소 이후, 지 속적으로 증가해2015
년도79
.8
%로 나타났다.1) 도로교통공사의 교 통사고 통계 분석결과, 안전벨트 미착용 시 사망률(사상자 대비 사망자 수)은
1
.45
%로, 착용했을 때의0
.39
%보다3
배가량 높았고,2) 미 국National Highway Traffic Safety Administration
에 따르면 지난10
년 동안 미국에서 안전벨트가 구한 생명은5
만 명이 넘고130
만 명이 부상을 피했다고 하며, 승용차에서 안전벨트 착용은 치사율을45
% 감소시켜준다고 한다.3-6)미국 질병통제예방센터(
Center for Diseases Control and Prevention
,Received August 1, 2018 Revised September 28, 2019 Accepted October 21, 2019
Corresponding author Nayeon Moon Tel: +82-2-2225-1292, Fax: +82-504-042-0518 E-mail: [email protected]
ORCID: http://orcid.org/0000-0003-1578-4947
Copyright © 2019 The Korean Academy of Family Medicine
This is an open-access article distributed under the terms of the Creative Commons At- tribution Non-Commercial License (http://creativecommons.org/licenses/by-nc/4.0) which permits unrestricted noncommercial use, distribution, and reproduction in any medium, provided the original work is properly cited.
Original Article
https://doi.org/10.21215/kjfp.2019.9.6.492 eISSN 2233-9116
Korean J Fam Pract. 2019;9(6):492-498
Korean Journal of Family Practice
KJFP
국내 성인에서 체질량지수에 따른 안전벨트 착용률:
국민건강영양조사 제6기(2013–2015) 자료
여혜정, 박가윤, 강동연, 문나연*
중앙보훈병원 가정의학과
Body Mass Index and Seatbelt Use in Korea: Analyzing the Sixth Korea National Health and Nutrition Examination Survey (2013–2015)
Hyejeong Yeo, Gayoon Park, Dongyeon Kang, Nayeon Moon*
Department of Family Medicine, VHS Medical Center, Seoul, Korea
Background: The prevalence of obesity in Korea is continuously increasing, and there are several international studies that suggest obese populations are not likely to wear seatbelts when driving a car. Even though the rate of seatbelt use in Korean adults is 79.8%, which is much lower than 94% for OECD countries, no studies have been conducted related to this particular issue in Korea. This study was conducted to determine the relationship between body mass index (BMI) and seatbelt use in Korea where BMI standards, laws, cultures, and social conventions totally differ from those of western countries.
Methods: This study was conducted on 8,556 drivers, aged 19 or older, using raw data from the 6th Korea National Health and Nutrition Examination Survey (2013–2015). A stratified and cross-sectional analysis was used to figure out seatbelt use rates according to BMI, and a multivariable logistic regression analysis was used to determine the odds ratio (OR) of seatbelt use by BMI groups.
Results: Increase in BMI resulted in a decrease in seatbelt use. The extremely obese group particularly had much lower rates of seatbelt use compared to other groups. After adjusting other variables, only the extremely obese group had much lower rates of seatbelt use (OR 0.68, 95% confidence interval 0.53–0.87).
Conclusion: Seatbelt use rates according to BMI had no significant differences between the non-obese group, the overweight group, and the obese group. However, the extremely obese group had a tendency to not wear seatbelts when driving a car.
Keywords: Seatbelt Use; Obesity; Body Mass Index; Accidents; Korea
여혜정 외. 국내 성인에서 체질량지수에 따른 안전벨트 착용률 Korean Journal of Family Practice
KJFP
CDC
)는 안전벨트 미착용 위험요인으로 ‘18–24
세의 젊은 나이’, ‘남 자’, ‘교외지역’, ‘관대한 주 법률(State Laws-secondary enforcement
)’,‘뒷좌석 착석’의 경우만 제시하고 있으나,7) 외국의 기존 연구결과들 에 의하면 안전벨트의 미착용은 비만한 사람에게서 더 많이 나타나 는 경향이 있다고 보고되고 있다.8-15)
국내의 비만 유병률은 지속적 증가 추세를 보이고 있는데, 체질 량지수가
25 kg
/m
2 이상으로 정의되는 비만의 유병률은 국내 남성 에서1998
년25
.7
% 이후,2014
년 약37
.9
%로 증가하였고, 특히 고도 비만에 해당하는 체질량지수30 kg
/m
2 이상의 경우는 같은 기간 동 안1
.7
%에서5
.3
%로 눈에 띄게 높아졌다.16-18)교통사고 발생 시 치명적인 결과를 야기할 수 있는 안전벨트 미착 용률이 비만에 의해 영향 받을 수 있다는 점에서, 비만과 안전벨트 착용률의 관계는 중요한 사회적 문제가 될 수 있다. 하지만, 서양의 국가들과는 법과 문화, 사회적 통념, 그리고 비만에 대한 체질량지 수 기준치 또한 다르게 적용되는 국내에서는, 지금껏 이와 관련된 연구가 전혀 진행되지 않았기에 실제 국내환경에서 비만이 안전벨 트 착용에 어떠한 영향을 미치는지 알아보기 위해 연구를 진행하게 되었다.
방 법
1. 연구대상
본 연구는 제
6
기(2013–2015
년) 국민건강영양조사 원시자료를 활 용하였다. 제6
기(2013–2015
년) 국민건강영양조사 대상자는29
,321
명 으로 검진조사, 건강설문조사, 영양조사 중1
개 이상 조사에 참여한 대상자는22
,948
명이었으며, 이 중 건강설문지 항목 중 “운전할 때 안전벨트를 맵니까?”에 적절하게 응답한 만19
세 이상 성인에 해당 하는8
,994
명이1
차 대상자였다. 본 연구의 독립변수인 체질량지수, 성별, 연령, 교육수준, 소득수준, 지역, 직업에 대한 자료가 없거나 무응답인 자를 제외하고 최종8
,556
명(남자4
,986
명, 여자3
,570
명) 을 본 연구의 대상으로 선정하였다.본 연구는 중앙보훈병원 윤리심사위원회의 승인을 받아 진행하 였다(
IRB No
.2017-09-013
).2. 변수의 정의
체질량지수(
body mass index
,BMI
)는 세계보건기구(World Health Organization
,WHO
)의 아시아태평양지역 비만 기준에 따라서19,20)23
.0
미만을 정상군,23
.0
부터25
.0
미만을 과체중군,25
.0
부터30
.0
미만을 비만군,30
.0
이상을 고도비만군으로 네 그룹으로 분류하였 으며, “운전할 때 안전벨트를 맵니까?”의 질문에 해당하는 안전벨트착용여부는 대상자들이 설문에 응할 때 평소 본인이 안전벨트를 얼 마나 자주 매는지 애매할 경우, 실제보다 과장해서 체크하는 경향 이 있기 때문에, 이러한 오분류 비뚤림(
misclassification bias
)을 줄이 기 위해서 “전혀 매지 않는다”, “거의 매지 않는다”, “가끔 매는 편이 다”, 그리고 “대체로 매는 편이다”로 답변한 경우를 ‘미착용(less than always
)’으로, “항상 맨다”를 ‘착용(always
)’으로 이분법적 분류하였다.연령 변수의 경우는
30
세 미만,30–39
세,40–49
세,50–59
세,60
세 이상으로 분류하였고, 교육수준은 “초등학교 졸업 이하”, “중학교 졸업 이하”, “고등학교 졸업 이하”로 답변한 것을 대학교 졸업 미만 으로, “대학교 졸업 이상”으로 답변한 것을 대학교 졸업 이상으로 분류하였다. 소득수준은 가구소득 사분위수를 사용하여 하, 중하, 중상, 상의4
단계로 나눠 분류하였다. 지역의 경우는 서울, 부산, 대 구, 인천, 광주, 대전, 울산의 경우를 특별시 및 광역시로, 경기, 강 원, 충북, 충남, 전북, 전남, 경북, 경남, 제주를 그 외 지역으로 분류 하였다.직업변수의 경우는 건강설문조사 항목의 직업 재분류 항목을 사 용하여 화이트칼라(관리자, 전문가, 사무종사자), 블루칼라(서비스 및 판매직, 농림어업, 기능원, 장치기계조작, 조립종사자, 단순노무 종사자), 무직(주부, 학생)으로 분류하였다.
3. 통계분석
통계 프로그램은
IBM SPSS Statistics for Windows
,Version 20
.0
(IBM Co
.,Armonk
,NY
,USA
)을 이용하였으며, 본 연구의 자료인 국 민건강영양조사는 복합표본설계로 수집되었으므로,2013–2015
국 민건강통계에 사용된 방법과 동일하게 집락추출변수(Psu
), 층화변 수(Kstrata
) 및 개인별, 연도별 가중치를 적용하여 분석하였다. 정상 군, 과체중군, 비만군, 고도비만군에 따른 안전벨트 착용률 비교를 위하여 교차 분석을 시행하였으며, 그룹간 차이에 대한 유의성은 카이제곱(chi-square
) 방법을 이용하여 검정하였으며, 통계적 유의 수준은0
.05
미만으로 정하였다. 또한, 다변량 로지스틱 회귀분석을 통하여, 안전벨트 착용률에 영향을 미칠 수 있는 다른 독립변수(연 령, 성별, 교육수준, 소득, 지역, 직업)들의 효과를 보정하여 체질량 지수에 따른 안전벨트 착용률에 대한 보정된 승산비(adjusted odds ratios [ORs]
)와95
% 신뢰구간(95
%confidence intervals [CIs]
)을 구하였 다.결 과
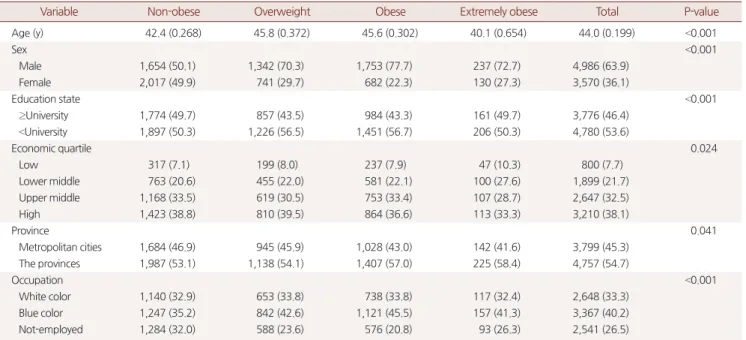
만
19
세 이상 성인 운전자를 대상으로 한 일반사항을 분석한 결 과는Table 1
과 같다. 최종8
,556
명 중 체질량지수에 따른 네 가지 분Original Article
Korean Journal of Family Practice
Hyejeong Yeo, et al. Body Mass Index and Seatbelt Use in Korea
Korean Journal of Family Practice
KJFP
류는 정상군
3
,671
명(42
.5
%), 과체중군2
,083
명(24
.2
%), 비만군2
,435
명(28
.7
%), 고도비만군367
명(4
.6
%)으로 비만이상의 인구집단 비율 은33
.3
%로 나타났으며, 평균연령은 전체44
.0
세로 정상군에서42
.4
세, 과체중군45
.8
세, 비만군45
.6
세, 고도비만군40
.1
세로 정상 및 고도비만군의 연령이 과체중 및 비만군의 연령보다 유의하게 적은 것으로 나타났다(P<0
.001
).정상에서 과체중 및 비만으로 체질량지수가 증가함에 따라 남성 의 비율이 여성보다 높아지는 결과가 나왔으며(
P<0
.001
), 대학교 졸 업 이상의 비율이 정상 및 고도비만군에서 과체중 및 비만군보다 유의하게 더 높은 결과를 보였다(P<0
.001
).소득수준의 경우는, 소득이 낮은 하 군의 정상체중 비율은
7
.1
% 였으나, 고도비만에서는10
.3
%로 증가하였고, 소득이 높은 상 군의 비율은 반대로38
.8
%에서33
.3
%로 줄어드는 모습 을 보였다 (P=0
.024
). 지역별로는 특별시 및 광역시에 거주하는 인구집단보다 그 외 지역에 사는 인구집단이, 그리고 직업군에서는 화이트칼라 직 업군보다 블루칼라 직업군이 체질량지수가 증가함에 따라 그 비율 이 유의미하게 증가하는 모습을 보였다(P=0
.041
,P<0
.001
).체질량지수에 따른 안전벨트 착용률을 살펴본 결과는
Table 2
와 같다. 정상군, 과체중군, 비만군, 고도비만군으로 체질량지수가 증 가할수록 안전벨트 착용률은72
.0
%,70
.1
%,69
.3
%,60
.1
%로 점점 떨 어지는 결과가 나타났으며, 특히 고도비만군의 경우는60
.1
%로 정상군, 과체중군, 비만군의 경우보다 큰 차이로 낮은 착용률을 보였 다(
P<0
.001
).체질량지수가 증가함에 따라 안전벨트 착용률이 유의미하게 떨 어지는지 계층별로 층화하여 확인해 본 결과,
30
대,50
대 그리고60
대의 연령군, 남성, 대학교 졸업 미만, 소득 중하위권 및 상위권, 특 별시 및 광역시 거주자, 그리고 그 외 지역 거주자 집단에서 통계적 으로 유의미한 결과를 보였다.Table 3
의 경우는 연령, 성별, 교육, 소득, 지역, 직업에 대한 영향 을 보정한, 정상군에 대한 과체중군, 비만군, 고도비만군의 안전벨 트 착용률의 보정된 승산비와95
% 신뢰구간을 나타낸다. 과체중군 (adjusted OR 1
.00
,95
%CI 0
.88–1
.14
)과 비만군(adjusted OR 1
.02
,95
%CI 0
.89–1
.17
)의 경우 유의미한 차이가 없었으나, 고도비만군의 경우 (adjusted OR 0
.68
,95
%CI 0
.53–0
.87
), 정상군에 비해 안전벨트 착용 률에 대한 유의한 차이를 보였다.고 찰
OECD
국가들의 안전벨트 착용률은94
%인데 비해, 국내의 안전 벨트 착용률은79
.8
%로 크게 낮은 편으로,21-23) 이것은 안전벨트 미 착용으로 인한 경제적, 사회적 손실과 사망의 위험성이 선진국들에 비해 그만큼 크다는 것을 의미한다.Table 1. Basic characteristics with BMI classifications
Variable Non-obese Overweight Obese Extremely obese Total P-value
Age (y) 42.4 (0.268) 45.8 (0.372) 45.6 (0.302) 40.1 (0.654) 44.0 (0.199) <0.001
Sex <0.001
Male 1,654 (50.1) 1,342 (70.3) 1,753 (77.7) 237 (72.7) 4,986 (63.9)
Female 2,017 (49.9) 741 (29.7) 682 (22.3) 130 (27.3) 3,570 (36.1)
Education state <0.001
≥University 1,774 (49.7) 857 (43.5) 984 (43.3) 161 (49.7) 3,776 (46.4)
<University 1,897 (50.3) 1,226 (56.5) 1,451 (56.7) 206 (50.3) 4,780 (53.6)
Economic quartile 0.024
Low 317 (7.1) 199 (8.0) 237 (7.9) 47 (10.3) 800 (7.7)
Lower middle 763 (20.6) 455 (22.0) 581 (22.1) 100 (27.6) 1,899 (21.7)
Upper middle 1,168 (33.5) 619 (30.5) 753 (33.4) 107 (28.7) 2,647 (32.5)
High 1,423 (38.8) 810 (39.5) 864 (36.6) 113 (33.3) 3,210 (38.1)
Province 0.041
Metropolitan cities 1,684 (46.9) 945 (45.9) 1,028 (43.0) 142 (41.6) 3,799 (45.3)
The provinces 1,987 (53.1) 1,138 (54.1) 1,407 (57.0) 225 (58.4) 4,757 (54.7)
Occupation <0.001
White color 1,140 (32.9) 653 (33.8) 738 (33.8) 117 (32.4) 2,648 (33.3)
Blue color 1,247 (35.2) 842 (42.6) 1,121 (45.5) 157 (41.3) 3,367 (40.2)
Not-employed 1,284 (32.0) 588 (23.6) 576 (20.8) 93 (26.3) 2,541 (26.5)
Values are presented as mean (standard error) or unweighted number (weighted %). Unweighted total number of study participants in each substratum.
Proportions weighted using ‘wt_itvex’ of Korean National Health and Nutrition Examination Survey to account for complex survey sampling strategy.
Non-obese (BMI<23), overweight (BMI 23–24.9), obese (BMI 25–29.9), extremely obese (BMI≥30).
BMI, body mass index.
여혜정 외. 국내 성인에서 체질량지수에 따른 안전벨트 착용률 Korean Journal of Family Practice
KJFP
본 연구는
2013–2015
년 국민건강영양조사 원시자료를 활용하여19
세 이상 성인 운전자를 대상으로 체질량지수에 따른 안전벨트 착 용률을 비교하여, 국내 인구집단에서 비만 정도에 따른 교통사고 위험성을 확인하고자 진행하였다. 안전벨트 착용률에 영향을 미칠 수 있는 변수로는 연령, 성별, 교육, 소득, 지역, 직업, 체질량지수가 모두 해당되었으며, 이 중 체질량지수의 경우, 그 수치가 증가할수 록 안전벨트 착용률이 감소한다는 기존의 연구결과8,9)들과 일치하 는 결과를 보였는데(정상군71
.9
%; 과체중군70
.0
%; 비만군69
.4
%;고도비만군
60
.7
%,P<0
.001
), 특히 이러한 결과는 고도비만군에서 큰 차이를 나타냈다.그러나, 연령, 성별, 교육, 소득, 지역, 직업에 대한 영향을 보정한 후, 체질량지수에 따른 안전벨트 착용률을 살펴보면, 과체중군 (
adjusted OR 1
.00
,95
%CI 0
.88–1
.14
)과 비만군(adjusted OR 1
.02
,95
%CI 0
.89–1
.17
)의 경우 정상군에 비해서 유의미한 차이가 보이지 못하 였고, 고도비만군의 경우(adjusted OR 0
.68
,95
%CI 0
.53–0
.87
), 정상 군에 비해 안전벨트 착용률이 유의하게 낮은 결과가 나타났다.이러한 결과는 기존 외국 연구결과들과는 약간의 다른 차이를 보 였는데,
Schlundt
등9)은 연령, 성별, 인종, 교육, 주(state
)법률의 변수 들을 보정한 결과, 체질량지수에 따른 안전벨트 착용률의 보정된 승 산비와95
% 신뢰구간은, 정상군(BMI 25
미만)에 비해, 과체중군 (BMI 25–29
.9
)의 경우adjusted OR 0
.89
,95
%CI 0
.85–0
.93
, 비만군 (BMI 30–39
.9
)의 경우adjusted OR 0
.69
,95
%CI 0
.66–0
.73
, 그리고 고 도비만군(BMI 40
이상)의 경우adjusted OR 0
.45
,95
%CI 0
.40–0
.50
로 선형적으로 점차 감소한다는 결과가 있으며,Jehle
등8)에서도 마찬가 지로, 연령, 탑승자수, 차량의 휠베이스 크기, 날씨, 주변밝기, 차량 소유여부, 운전면허여부, 법규제, 음주상태, 주(state
) 등의 변수를 보 정한 결과, 체질량지수에 따른 비만 단계(normal
,overweight
,slightly obese
,moderatetly obese
,morbidilty obese
)가 한 단계 내려갈수록 안 전벨트 착용률은13
%씩 선형적으로 증가한다는 결과를 보였다.이것은, 본 연구의 비만(
obese
)과 고도비만(extremly obese
)에 대한 정의가WHO
의 아시아태평양지역 비만 기준을 따랐고 기존 서양의 연구결과들은 비만 정도를 정의하는 체질량지수 기준치가 아시아 Table 2. Weighted proportions of seatbelt users by BMI classificationsVariable Non-obese Overweight Obese Extremely obese
P-value
N Use (%) N Use (%) N Use (%) N Use (%)
Overall 3,671 72.0 2,083 70.1 2,435 69.3 367 60.1 <0.001
Age (y)
<30 475 62.3 151 64.1 176 69.6 48 57.9 0.360
30–39 913 73.3 375 71.8 478 68.8 115 55.2 0.003
40–49 904 73.9 525 71.9 586 68.0 89 73.0 0.209
50–59 717 73.4 533 67.4 629 70.9 64 50.0 0.002
>60 662 78.7 499 73.7 566 69.2 50 63.6 0.003
Sex
Male 1,654 66.6 1,342 67.4 1,753 67.0 237 54.9 0.015
Female 2,017 77.4 741 76.6 682 77.1 130 73.9 0.696
Education state
≥University 1,774 76.3 857 76.2 984 72.9 161 70.1 0.164
<University 1,897 67.7 1,226 65.4 1,451 66.4 206 50.3 <0.001
Economic quartile
Low 317 69.8 199 70.4 237 68.6 47 69.8 0.979
Lower middle 763 68.4 455 61.2 581 67.7 100 55.8 0.020
Upper middle 1,168 70.8 619 71.9 753 66.6 107 55.8 0.068
High 1,423 75.4 810 73.7 864 72.7 113 64.4 0.041
Province
Metropolitan cities 1,684 77.7 945 76.0 1,028 72.5 142 66.1 0.004
The provinces 1,987 66.9 1,138 65.1 1,407 66.8 225 55.8 0.047
Occupation
White color 1,140 75.5 653 74.1 738 74.9 117 62.5 0.061
Blue color 1,247 63.2 842 61.8 1,121 62.8 157 52.0 0.111
Not-employed 1,284 78.1 588 79.3 576 74.1 93 70.0 0.150
Values are presented as unweighted number or weighted %. Unweighted total number of study participants in each substratum.
Proportions weighted using ‘wt_itvex’ of Korean National Health and Nutrition Examination Survey (KNAHANES) to accout for complex survey sampling strategy.
KNAHANES 2013–2015.
BMI, body mass index.
Hyejeong Yeo, et al. Body Mass Index and Seatbelt Use in Korea
Korean Journal of Family Practice
KJFP
지역보다 관대하게 적용하였기에 발생한 차이로 보이며, 실제로 체 질량지수
30–39
.9
만을 대상으로 결과를 살펴보면, 본 연구의 결과인 보정된 승산비(adjusted OR
)0
.68
배와Schlundt
의 연구결과9)인0
.69
배 는 일관된 결과를 나타냈다고 볼 수 있다.이번 연구의 제한점은 다음과 같다.
첫째, 체질량지수가 몸의 체지방비율을 전적으로 반영하지 못한 다는 한계점이 있다. 근력운동을 많이 해서 근육이 많은 사람의 경 우, 체질량지수가 일반인에 비해 높지만, 그 사람이 실제로 비만하 다는 것을 의미하지는 않는다.
둘째, 미국
CDC
에서 제시하는 안전벨트 미착용 요인 중 하나인“뒷좌석 착석”에 대한 변수가 포함되지 않았다. 또한, 탑승차량 종 류(
Sedan
,SUV
,Truck
), 탑승차량 크기(wheelbase
), 알콜사용여부, 날 씨에 따라서도 안전벨트 착용률이 달라질 수 있으므로, 향후 추가 적인 변수들이 포함된 데이터를 확보할 수 있다면, 후속 연구가 진 행될 필요가 있다고 보인다.셋째, 안전벨트 착용여부에 대한 문항은 자가 기입식 설문자료 (
self-reporting data
)이므로, 변수를 정의할 때 “대체로 매는 편이다”를 안전벨트 미착용으로, “항상 매는 편이다”를 안전벨트 착용으로
분류함으로서, 실제 안전벨트 착용여부가 정확하지 않을 수 있다는 점이다.
하지만 이러한 제한점들에도 불구하고, 본 연구는 기존의 외국 연구결과와는 다르게 국내 인구집단에 맞는 비만 기준을 최초로 적 용한 연구이며, 또한 국내 법규와 환경에 맞게 필요한 변수들을 적 용하여 진행한 연구로, 체질량지수와 안전벨트의 착용률의 관계를 국내에서 처음으로 밝힌 연구로 그 결과의 의의가 크다고 본다. 본 연구결과에 의하면, 비만 중에서도 특히 고도비만을 가진 인구집단 의 경우, 정상 체중의 인구집단에 비해 유의미하게 안전벨트 착용률 이 떨어진다는 결과를 보여주었고, 이것은 고도비만 운전자들이 교 통사고 사망이나 상해로 병원 치료를 받을 위험이 그만큼 높다는 것을 의미한다.
향후 자동차제조회사에서는 고도비만 인구집단이나 혹은 임산 부까지도 고려할 수 있는 새로운 방식의 전용 안전벨트를 개발하여 신체적으로 차이가 있는 인구집단에서 보다 편리하고 적극적으로 안전벨트를 착용할 수 있는 환경을 조성해야 하고, 정부에서도 이와 관련된 교통법규를 재정비할 필요가 있을 것으로 보인다. 또한 의료 기관의 의사들도 비만한 환자들에게 신체적 불편함으로 안전벨트 Table 3. Adjusted odds ratios and 95% confidence intervals for seatbelt use compared with non-obesity
Variable Overweight Obese Extremely obese
Overall 1.00 (0.88–1.14) 1.02 (0.89–1.17) 0.68 (0.53–0.87)
Age (y)
<30 1.16 (0.75–1.82) 1.45 (0.96–2.19) 0.82 (0.44–1.53)
30–39 1.12 (0.83–1.51) 1.02 (0.75–1.38) 0.55 (0.34–0.89)
40–49 0.99 (0.74–1.34) 0.96 (0.73–1.26) 1.19 (0.71–2.01)
50–59 0.87 (0.67–1.14) 1.09 (0.83–1.43) 0.41 (0.23–0.70)
>60 0.77 (0.57–1.03) 0.63 (0.47–0.83) 0.52 (0.23–1.18)
Sex
Male 1.01 (0.84–1.20) 1.01 (0.85–1.20) 0.62 (0.45–0.85)
Female 0.93 (0.75–1.15) 1.02 (0.79–1.31) 0.89 (0.59–1.36)
Education state
≥University 1.03 (0.82–1.29) 0.93 (0.74–1.18) 0.85 (0.57–1.27)
<University 0.98 (0.82–1.16) 1.07 (0.89–1.26) 0.53 (0.37–0.76)
Economic quartile
Low 1.02 (0.65–1.61) 0.97 (0.62–1.53) 0.97 (0.43–2.17)
Lower middle 0.80 (0.61–1.05) 1.06 (0.79–1.42) 0.63 (0.37–1.05)
Upper middle 1.08 (0.82–1.42) 0.90 (0.72–1.14) 0.59 (0.37–0.93)
High 1.10 (0.87–1.38) 1.12 (0.89–1.43) 0.76 (0.47–1.21)
Province
Metropolitan cities 0.97 (0.79–1.20) 0.85 (0.68–1.05) 0.67 (0.43–1.04)
The provinces 1.01 (0.86–1.19) 1.14 (0.96–1.37) 0.68 (0.50–0.93)
Occupation
White color 0.95 (0.74–1.22) 1.04 (0.78–1.38) 0.59 (0.38–0.91)
Blue color 0.97 (0.79–1.19) 1.05 (0.87–1.27) 0.69 (0.47–1.01)
Not-employed 1.10 (0.82–1.46) 0.89 (0.67–1.18) 0.79 (0.44–1.41)
Adjusted odds ratios and 95% confidence intervals for seatbelt use with body mass index classifications of overweight, obesity, and extreme obese compared with non- obesity, and stratified results with age, sex, education, economic quartile, province, and occupation.
여혜정 외. 국내 성인에서 체질량지수에 따른 안전벨트 착용률 Korean Journal of Family Practice
KJFP
를 미착용하기보다는, 사고로 인한 사망이나 건강 위험성을 보다 강 력히 인지시켜주고, 적극적으로 체중관리와 안전벨트 착용의 중요 성에 대해 교육할 필요가 있다.
요 약
연구배경: 국내 비만 유병률은 지속적으로 증가하는 추세이며, 비 만한 운전자들은 정상 체질량지수를 가진 운전자들보다 안전벨트 착용률이 떨어진다는 연구결과들이 외국에서 꾸준히 제기되어 왔 다. 국내의 경우, 성인의 안전벨트 착용률은
79
.8
%로 크게 낮은 편임 에도 불구하고, 이와 관련된 연구는 전무한 상황이다. 서양과는 비 만에 대한 체질량지수 기준치, 법과 문화, 사회적 통념이 다르게 적 용되는 국내환경에서의 체질량지수와 안전벨트 착용률의 관계를 확 인하고자 연구를 진행하였다.방법: 본 연구는 제
6
기 국민건강영양조사(2013–2015
년) 원시자료를 활용하여19
세 이상 성인 운전자8
,556
명을 대상으로 하였다. 체질 량지수에 따른 안전벨트 착용률을 교차분석 및 층화분석을 통해 확인해보고, 독립변수로 체질량지수, 성별, 연령, 교육수준, 소득수 준, 지역, 직업변수를 보정하여 체질량지수 정상군에 대한 과체중 군, 비만군, 그리고 고도비만군의 안전벨트 착용률의 승산비를 로지 스틱 회귀분석을 통해 평가하고자 하였다.결과: 정상군, 과체중군, 비만군, 고도비만군으로 체질량지수가 증 가할수록 안전벨트 착용률은
72
.0
%,70
.1
%,69
.3
%,60
.1
%로 점점 떨 어지는 결과가 나타났으며, 특히 고도비만군의 경우는60
.1
%로 정 상군, 과체중군, 비만군의 경우보다 큰 차이로 낮은 착용률을 보였 다(P<0
.001
). 다른 변수들을 보정한 후의 과체중군(adjusted OR 1
.00
,95
%CI 0
.88–1
.14
), 비만군(adjusted OR 1
.02
,95
%CI 0
.89–1
.17
)의 안 전벨트 착용률은 정상군에 비해 유의미한 차이가 없었으며, 고도비 만군의 경우에만 착용률이 크게 떨어지는 결과를 보였다(adjusted OR 0
.68
,95
%CI 0
.53–0
.87
).결론: 국내 체질량지수에 따른 안전벨트 착용률은 과체중군과 비 만군에서는 정상군과 큰 차이가 없으나, 고도비만군의 경우 착용률 이 크게 떨어지므로, 이에 대한 사회적 관심과 대책이 필요할 것으 로 보인다.
중심단어: 안전벨트 착용; 비만; 체질량지수; 교통사고; 한국 CONFLICT OF INTEREST
No potential conflict of interest relevant to this article was reported
.ORCID
Hyejeong Yeo
,http
://orcid
.org
/0000-0001-7377-1875 Gayoon Park
,http
://orcid
.org
/0000-0002-3042-6403 Dongyeon Kang
,http
://orcid
.org
/0000-0001-9471-3260 Nayeon Moon
,http
://orcid
.org
/0000-0003-1578-4947
REFERENCES1. Korea Centers for Disease Control and Prevention. 2008-2015 community health survey. Cheongju: Korea Centers for Disease Control and Preven- tion; 2016 May. Report No.: 11-1352159-000033-10. 641 p.
2. Korea Road Traffic Authority. 2016 summary of traffic accident analysis.
Wonju: KoROAD; 2016 Sep. Report No.: 2016-0215-026. 230 p.
3. Kahane CJ. Fatality reduction by safety belts for front-seat occupants of cars and light trucks: updated and expanded estimates based on 1986-99 FARS data. Washington (DC): National Highway Traffic Safety Administration;
2000 Dec. Report No.: DOT HS 809 199. 80 p.
4. Beck LF, Downs J, Stevens MR, Sauber-Schatz EK. Rural and urban differ- ences in passenger-vehicle-occupant deaths and seat belt use among adults - United States, 2014. MMWR Surveill Summ 2017; 66: 1-13.
5. Lee LK, Monuteaux MC, Burghardt LC, Fleegler EW, Nigrovic LE, Meehan WP, et al. Motor vehicle crash fatalities in states with primary versus second- ary seat belt laws: a time-series analysis. Ann Intern Med 2015; 163: 184-90.
6. National Highway Traffic Safety Administration. 2015 motor vehicle crash- es: overview. Traffic safety facts research note. Washington (DC): NHTSA;
2016 Aug. Report No.: DOT HS 812 318. 9 p.
Center for Diseases Control and Prevention. Seat belts: get the facts [Inter- net]. Atlanta (GA): Center for Diseases Control and Prevention; 2017 [cited 2017 Jun 11]. Available from: https://www.cdc.gov/motorvehiclesafety/seat- belts/facts.html.
7. Jehle D, Doshi C, Karagianis J, Consiglio J, Jehle G. Obesity and seatbelt use:
a fatal relationship. Am J Emerg Med 2014; 32: 756-60.
8. Schlundt DG, Briggs NC, Miller ST, Arthur CM, Goldzweig IA. BMI and seatbelt use. Obesity (Silver Spring) 2007; 15: 2541-5.
9. Lichtenstein MJ, Bolton A, Wade G. Body mass as a determinant of seat belt use. Am J Med Sci 1989; 297: 233-7.
10. Price JH, Dake JA, Balls-Berry JE, Wielinski M. Seat belt use among over- weight and obese adolescents. J Community Health 2011; 36: 612-5.
11. Behzad B, King DM, Jacobson SH. Seatbelt usage: is there an association with obesity? Public Health 2014; 128: 799-803.
12. Whitlock G, Norton R, Clark T, Jackson R, MacMahon S. Is body mass in- dex a risk factor for motor vehicle driver injury? A cohort study with pro- spective and retrospective outcomes. Int J Epidemiol 2003; 32: 147-9.
13. Zhu S, Layde PM, Guse CE, Laud PW, Pintar F, Nirula R, et al. Obesity and risk for death due to motor vehicle crashes. Am J Public Health 2006; 96:
734-9.
14. Glassbrenner D. Safety belt use in 2005--use rates in the states and territo- ries. Traffic safety facts research note. Washington (DC): NHTSA; 2006 Mar.
Report No.: DOT HS 809 970. 7 p.
Hyejeong Yeo, et al. Body Mass Index and Seatbelt Use in Korea
Korean Journal of Family Practice
KJFP
15. Shin HY, Kang HT. Recent trends in the prevalence of underweight, over- weight, and obesity in Korean adults: the Korean National Health and Nu- trition Examination Survey from 1998 to 2014. J Epidemiol 2017; 27: 413-9.
16. World Health Organization. Obesity: preventing and managing the global epidemic. Geneva: WHO; 2000.
17. Gillum RF, Sempos CT. Ethnic variation in validity of classification of over- weight and obesity using self-reported weight and height in American women and men: the Third National Health and Nutrition Examination Survey. Nutr J 2005; 4: 27.
18. World Health Organization (WHO). The Asia-Pacific perspective: redefin- ing obesity and its treatment. Sydney: Health Communications Australia;
2000. 55 p.
19. WHO Expert Consultation. Appropriate body-mass index for Asian popu- lations and its implications for policy and intervention strategies. Lancet 2004; 363: 157-63.
20. Korea Road Traffic Authority. 2015 comparative analysis of traffic accidents in OECD countries. Wonju: KoROAD; 2015 Dec. Report No.: 2015-0253- 089. 70 p.
21. Centers for Disease Control (CDC). Comparison of observed and self-re- ported seat belt use rates--United States. MMWR Morb Mortal Wkly Rep 1988; 37: 349-51.
22. Sunshine J, Dwyer-Lindgren L, Chen A, Mokdad AH. Seat-belt use in US counties: limited progress toward healthy people 2020 objectives. Health Aff (Millwood) 2017; 36: 636-9.