© 2017 The Korean Ophthalmological Society
This is an Open Access article distributed under the terms of the Creative Commons Attribution Non-Commercial License (http://creativecommons.org/licenses /by-nc/3.0/) which permits unrestricted non-commercial use, distribution, and reproduction in any medium, provided the original work is properly cited.
Original Article
Epiretinal Membrane: Prevalence and Risk Factors from the Korea National Health and Nutrition Examination Survey,
2008 through 2012
Jong Min Kim1, Hoyoung Lee1, Jae Pil Shin2, Jeeyun Ahn3, Je Moon Yoo1, Su Jeong Song4, Sang Jin Kim1, Se Woong Kang1 on behalf of Epidemiologic Survey Committee of the Korean Ophthalmologic Society
1Department of Ophthalmology, Samsung Medical Center, Sungkyunkwan University School of Medicine, Seoul, Korea
2Department of Ophthalmology, Kyungpook National University Hospital, Daegu, Korea
3Department of Ophthalmology, SMG-SNU Boramae Medical Center, Seoul, Korea
4Department of Ophthalmology, Kangbuk Samsung Hospital, Sungkyunkwan University School of Medicine, Seoul, Korea
Purpose: To investigate the prevalence and risk factors for an epiretinal membrane (ERM) in Korean popula- tion.
Methods: Using the database of the Korea National Health and Nutrition Examination Survey from 2008 through 2012, 14,772 participants 40 years of age or older with gradable fundus photographs were included.
The presence of ERM was determined by using fundus photographs. The prevalence of ERM was estimated and possible risk factors including systemic factors, nutritional status, and blood tests were analyzed via multiple logistic regression analyses.
Results: The prevalence of ERM was 2.9% (95% confidence interval [CI], 2.6% to 3.3%). On multiple logistic regression analysis, the prevalence of ERM was affected by age. The odds ratios (ORs) against the forties were 2.70, 5.48, and 5.69 in the fifties, sixties, and seventies, respectively. ERM was also significantly affect- ed by cataract surgery (OR, 2.82; 95% CI, 2.08 to 3.81) and by the increase in intake of 100-mg calcium (OR, 1.05; 95% CI, 1.00 to 1.11). ERM had negative associations with red blood cell count (OR, 0.66; 95% CI, 0.45 to 0.95).
Conclusions: The estimated nation-wide prevalence of ERM in Korea is 2.9%. The presence of ERM in the general population is associated with age, cataract surgery, increased dietary calcium, and a low red blood cell count.
Key Words: Epiretinal membrane, Korea National Health and Nutrition Examination Survey, Prevalence, Risk factors
Epiretinal membrane (ERM) is the most common type of fibrocellular proliferation which is found at the vitreo- retinal interface. With aging population, the number of pa- tients undergoing surgical intervention for ERM is increas- ing. Previous epidemiologic studies addressed the prevalence of ERM, and the findings from those studies
Received: September 20, 2016 Accepted: January 13, 2017
Corresponding Author: Se Woong Kang, MD. Department of Ophthal- mology, Samsung Medical Center, Sungkyunkwan University School of Medicine, #81 Irwon-ro, Gangnam-gu, Seoul 06351, Korea. Tel: 82-2- 3410-3562, Fax: 82-2-3410-0074, E-mail: [email protected]
indicate a range from 1.0% to 28.9% [1-15]. However, as far as the present authors know, there has been no study repre- senting a nationwide population in Asia. Difference in prevalence of ERM by country and ethnicity is widely known and is thought to be caused by genetic or lifestyle factors [16]. ERM contains cells whose functionality is re- flected through calcium dynamics upon acetylcholine and mechanical stimulation [17]. Kokavec et al. [18] have re- ported that the concentration of glucose in the vitreous was correlated with that in the serum. Animal studies have reported that dietary protein imbalance and cholesterol-en- riched diet can be toxic to retinal tissue or result in changes to retinal structures [19,20]. Some epidemiological studies have indicated that ERM is associated with retinal arterio- lar narrowing [6,11], which, in turn, could be influenced by sodium intake [21]. Based on these results, it is suspected that some systemic and nutrition factors influence the oc- currence of ERM. However, there has been no study inves- tigating risk factors for ERM, including socioeconomic conditions and nutrition status. The Korea National Health and Nutrition Examination Survey (KNHANES) is a na- tionwide cross-sectional survey which represents entire Korean population of approximately 50 million. The pur- pose of the current study was to investigate the prevalence and risk factors of ERM in Korea utilizing the data from the KNHANES.
Materials and Methods
Study design and population
The KNHANES is an ongoing, population-based, cross-sectional survey in South Korea conducted by the Korea Centers for Disease Control and Prevention and the Korean Ministry of Health and Welfare. The present study analyzed the data of the 2008 through 2012 KNHANES.
This survey represented the civilian, non-institutionalized Korean population by using rolling sampling design with a complex, stratified, multistage, probability-cluster survey.
Not a simple random sample, but the quoted design is used widely in health surveys to sample a fraction of large finite population while accounting for its size and characteristics.
In this design, sampling is always multistage, using strata (separate sampling from population subgroups), cluster (considering the possibility of groups of observations), and
weight (considering oversampling or undersampling) [22].
In KNHANES, both the 1-year data surveys and the inte- grated data of the 2008 through 2012 surveys represent the entire population of Korea. In this study, data from a total of 20,419 eligible subjects 40 years of age or older during the 5-year study period was analyzed. The institutional re- view board of the Samsung Medical Center (no. 2016-02- 091) approved the present study, which was conducted in accordance with the Declaration of Helsinki.
Data collection
The KNHANES consisted of three components: the health interview survey, the nutrition survey, and the health examination. Health interview data were composed of basic demographics, socioeconomic status, and stan- dardized questionnaires regarding health-related problems.
For the nutrition survey, trained interviewers asked partic- ipants about dietary behavior and food frequency ques- tionnaires. From this data, the amount of intake of each nutrient was estimated according to the composition table of the Rural Developmental Administration. Nutrient vari- ables analyzed included calories, carbohydrates, proteins, fat, fiber, ash, calcium, phosphorus, Fe, sodium, potassium, vitamin A, beta-carotene, retinol, thiamin (B1), riboflavin (B2), niacin, and vitamin C. Health examination surveys consisted of basic body measurements, laboratory tests for blood and urine, chest X-ray, a bone density test, and phys- ical examinations such as otorhinolaryngologic and oph- thalmic examinations. Ophthalmic examination included corrected visual acuity test along with refraction, intraocu- lar pressure measurement, slit lamp examination, visual fields test, and fundus photography. Fundus photographs were obtained with a nonmydriatic fundus camera (TRC- NW6S; Topcon, Tokyo, Japan). Patients were defined as having ERM if a cellophane macular reflex or premacular fibrosis was observed in the fundus photograph. A cello- phane macular reflex was defined as a patchy, irregular, or increased light reflection on the inner retinal surface.
Premacular fibrosis was defined as the presence of a gray- ish or opaque appearance with superficial retinal folds on the inner retinal surface. Each fundus photograph was graded by two experienced retinal specialists (SJP and JSS). The present study used the data from all of these sur- veys; basic demographics, socioeconomic status, medical histories, anthropometric investigations, nutritional status,
blood tests, ophthalmic surveys, and ophthalmic examina- tions including fundus photography.
Variable definitions and statistical analysis
The variables analyzed in this study were defined and cat- egorized as follows: the first category among the categories of each variable defined below was selected as a reference in logistic regression analysis (LRA). Participants were divided into 4groups according to their ages: 40 to 49 years, 50 to 59 years, 60 to 69 years, and 70 years of age or older. Education status was divided into three groups. House income status was divided into three groups. Residence was categorized as an urban or rural area based on the address of the partici- pants. Smoking status was defined as a never smoker, a for- mer smoker, or a current smoker. Drinking status was de- fined as a non-drinker or drinker. Comorbidity status was based on the presence or absence of any comorbid condition.
Red blood cells (RBCs) were measured by a XE-2100D (Sysmex, Kobe, Japan). Other blood tests obtained included measurement of the blood urea nitrogen, creatinine, vitamin D, alkaline phosphatase, and parathyroid hormone.
Comparative analysis was conducted of participants in- cluded and excluded for this study and the prevalence of ERM was estimated. Simple LRAs and the chi-square test were conducted to investigate the associations between ERM prevalence and a set of variables. Then, the LRAs adjusted for age group and gender were performed. Co- variates that had a p-value of less than 0.200 in each LRA adjusted for age group and gender were chosen for multi- ple LRAs. The data were analyzed with PASW Statistics ver. 18 (SPSS Inc., Chicago, IL, USA) using proc survey procedures, which can analyze the presented data properly using the variable of strata, cluster, and weight. This study used the KNHANES sample weight adjusted for oversam- pling and nonresponse in the Korean population from 2008 to 2012 [23]. General linear modeling and chi-square tests were conducted for the comparison of demographic characteristics according to the presence of ERM. A p-val- ue less than 0.050 was considered statistically significant.
Results
Among all participants of the KNHANES from 2008 through 2012, 20,419 subjects were 40 years of age or older
and underwent ophthalmologic examinations. A total of 5,647 subjects did not have a gradable fundus photograph due to reasons including cataracts and lack of cooperation.
The demographic characteristics of participants according to presence of an ERM are provided in Table 1. Of the 14,772 participants 40 years of age or older, an ERM was observed in 507 (Fig. 1). The estimated prevalence of ERM, adjusted by demographic structure in Korea, was 2.9% (95% confidence interval [CI], 2.6% to 3.3%) among the subjects aged more than 40 years. The estimated prev- alence in the population aged more than 50 and 60 years was 4.2% (95% CI, 3.7% to 4.8%) and 6.0% (95% CI, 5.3%
to 6.9%), respectively. Seventy-three subjects were found to have an ERM in both eyes (14.3%).
The distribution of visual acuity in the subjects with an ERM is demonstrated in Fig. 2. If both eyes were in- volved with ERM, the eye with worse vision was taken into account. As a whole, 65.7% (330 / 502) of the eyes had a decreased visual acuity ranging from 20 / 25 to 20 / 40. The age distribution among subjects with ERM was as follows: 12.5% (95% CI, 8.4% to 18.2%) of subjects in their forties; 24.0% (95% CI, 19.4% to 29.1%) in their fif- ties; 32.9% (95% CI, 28.2% to 38.0%) in their sixties; and 30.6% (95% CI, 26.0% to 35.7%) in their seventies. For subjects in their forties compared to the older age groups, the odds ratios (ORs) adjusted for age and gender were as follows: 2.28 for subjects in their fifties (p < 0.001), 6.62 in their sixties (p < 0.001), and 7.48 in their seventies (p <
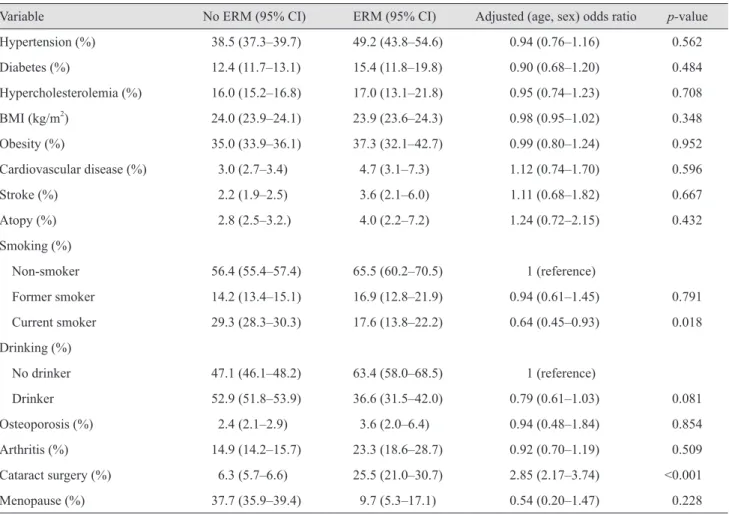
0.001). The gender distribution of ERM was 37.5% in men and 62.5% in women. The age-adjusted OR in women was 1.39 (95% CI, 1.14 to 1.68; p = 0.001) (Table 1). The prevalence of ERM according to comorbidities is provid- ed in Table 2. The proportion of current smokers was 29.3% (95% CI, 28.3% to 30.3%) in participants without ERM and 17.6% (95% CI, 13.8% to 22.2%) in those with ERM. The age and sex adjusted OR of being a current smoker compared with nonsmokers was 0.64 (95% CI, 0.45 to 0.93; p = 0.018). The proportion of participants with a history of cataract surgery was 25.5% (137 / 507) in subjects with ERM and 6.3% (1,217 / 14,265) in those without ERM. The adjusted OR of cataract surgery was 2.85 (95% CI, 2.17 to 3.74; p < 0.001) (Table 2). The results of the age and sex adjusted OR for the intake of nutrients are provided in Table 3.
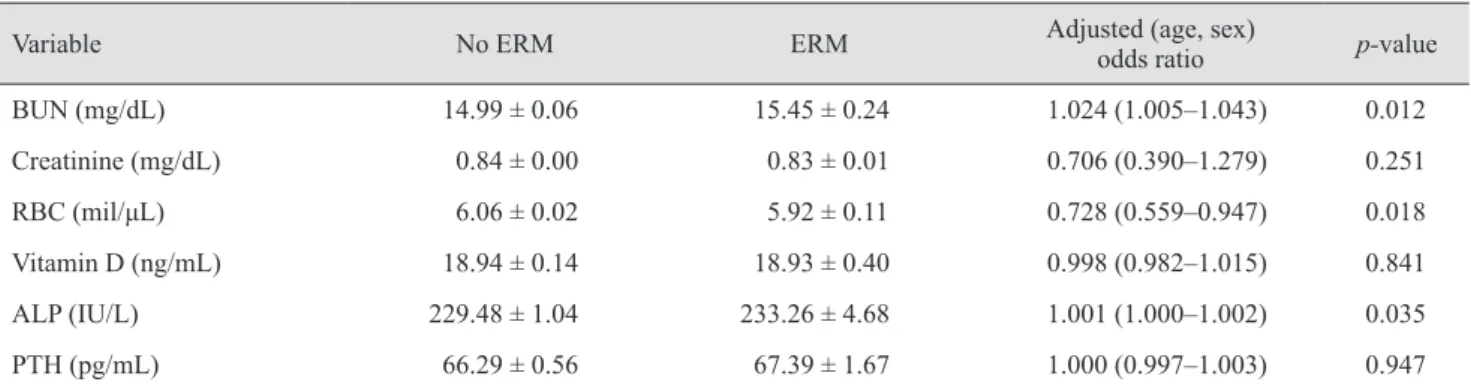
With lower intake of energy, water, protein, fat and car- bohydrates was, there was higher the risk of ERM. Blood
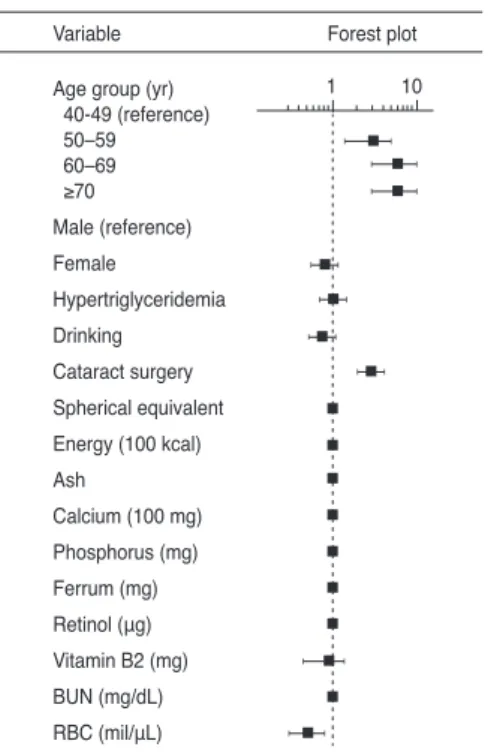
urea nitrogen and alkaline phosphatase levels had a signif- icant OR in blood tests (Table 4). Multiple LRAs were per- formed to investigate the complex risk of ERM according to the variables with a p-value less than 0.200 after LRA (Table 5). For subjects in their forties compared to the old- er age groups, the prevalence of ERM had the following association by OR (95% CI): an OR of 2.70 (1.47 to 4.96) for patients in their fifties; an OR of 5.48 (3.02 to 9.94) for patients in their sixties; and an OR of 5.69 (3.06 to 10.56) for patients in their seventies. ERM was also significantly affected by a history of cataract surgery (OR, 2.82; 95%
CI, 2.08 to 3.81) and the increase in intake of 100 mg of calcium (OR, 1.05; 95% CI, 1.00 to 1.11). The prevalence of ERM in women was more strongly associated with the in-
take of calcium compared to men, men having an OR of 1.02 (p = 0.593) and women having an OR of 1.08 (p = 0.010). RBC count was also associated with the prevalence of ERM. If the RBC count was 1 million/μL higher, the risk of ERM was 0.66 times lower (p = 0.027). However, this result differed by the gender (men, OR 0.51 [p = 0.006]; women, OR 0.80 [p = 0.343]) (Table 5 and Fig. 3).
Discussion
The prevalence of ERM in Beaver Dam Eye Study and Blue Mountains Eye Study was 11.8% and 7.0%, respec- tively [1,15]. In Japan, the Hisayama Study reported a prev- Table 1. Demographic characteristics of participants according to the presence of ERM, and the result of age and sex adjusted uni- variate analysis
Variable No ERM % (95% CI)
(n = 14,265) ERM % (95% CI)
(n = 507) Adjusted (age, sex)
odds ratio (95% CI) p-value
Prevalence % (95% CI) 97.1 (96.7–97.4) 2.9 (2.6–3.3) - -
Proportion of age group % (95% CI)
40–49 39.9 (38.4–41.4) 12.5 (8.4–18.2) 1 (reference)
50–59 30.6 (29.4–31.7) 24.0 (19.4–29.1) 2.28 (1.49–3.49) <0.001
60–69 16.8 (16.1–17.6) 32.9 (28.2–38.0) 6.62 (4.51–9.72) <0.001
>70 12.7 (12.1–13.4) 30.6 (26.0–35.7) 7.48 (5.06–11.05) <0.001
Proportion of sex distribution
Male 48.5 (47.7–49.4) 37.5 (32.8–42.4) 1 (reference)
Female 51.5 (50.6–52.3) 62.5 (57.6–67.2) 1.39 (1.14–1.68) 0.001
Refractive error by spherical equivalent
(mean ± standard deviation) -0.54 ± 0.02 D -1.0 ± 0.10 D 0.95 (0.90–1.00) 0.035
Urban 76.0 (72.6–79.1) 71.7 (64.9–77.6) 1 (reference)
Rural 24.0 (20.9–27.4) 28.3 (22.4–35.1) 1.02 (0.82–1.28) 0.849
Distribution of education
Elementary school graduate or lower 27.7 (43.4–46.4) 71.3 (52.2–85.0) 1 (reference) High school graduate or middle school
graduate 48.2 (47.0–49.4) 36.8 (31.9–41.9) 1.08 (0.84–1.38) 0.553
University graduate or higher 22.9 (21.5–24.3) 14.1 (10.3–18.9) 1.36 (0.98–1.89) 0.071 Distribution of income
1st quartile 24.9 (23.7–26.2) 24.8 (20.7–29.3) 1 (reference)
2nd–3rd quartile 50.8 (49.5–52.1) 53.1 (47.4–58.7) 1.19 (0.98–1.49) 0.115
4th quartile 24.3 (22.9–25.7) 22.2 (17.8–27.3) 1.05 (0.80–1.37) 0.740
ERM = epiretinal membrane; CI = confidence interval.
alence of 4.0%. In Shanghai Study of China and the Bei- jing Eye Study reported the prevalence of ERM as 1.02%
and 2.2%, respectively [3,12]. The present study provided
detailed data on the prevalence and risk factors of ERM based on a larger sample representing nationwide popula- tion in Korea [7]. The estimated prevalence of ERM was
Table 2. Mean value or frequency of clinical features in the group without ERM and with ERM, and the result of age and sex ad- justed univariate analysis
Variable No ERM (95% CI) ERM (95% CI) Adjusted (age, sex) odds ratio p-value
Hypertension (%) 38.5 (37.3–39.7) 49.2 (43.8–54.6) 0.94 (0.76–1.16) 0.562
Diabetes (%) 12.4 (11.7–13.1) 15.4 (11.8–19.8) 0.90 (0.68–1.20) 0.484
Hypercholesterolemia (%) 16.0 (15.2–16.8) 17.0 (13.1–21.8) 0.95 (0.74–1.23) 0.708
BMI (kg/m2) 24.0 (23.9–24.1) 23.9 (23.6–24.3) 0.98 (0.95–1.02) 0.348
Obesity (%) 35.0 (33.9–36.1) 37.3 (32.1–42.7) 0.99 (0.80–1.24) 0.952
Cardiovascular disease (%) 3.0 (2.7–3.4) 4.7 (3.1–7.3) 1.12 (0.74–1.70) 0.596
Stroke (%) 2.2 (1.9–2.5) 3.6 (2.1–6.0) 1.11 (0.68–1.82) 0.667
Atopy (%) 2.8 (2.5–3.2.) 4.0 (2.2–7.2) 1.24 (0.72–2.15) 0.432
Smoking (%)
Non-smoker 56.4 (55.4–57.4) 65.5 (60.2–70.5) 1 (reference)
Former smoker 14.2 (13.4–15.1) 16.9 (12.8–21.9) 0.94 (0.61–1.45) 0.791
Current smoker 29.3 (28.3–30.3) 17.6 (13.8–22.2) 0.64 (0.45–0.93) 0.018
Drinking (%)
No drinker 47.1 (46.1–48.2) 63.4 (58.0–68.5) 1 (reference)
Drinker 52.9 (51.8–53.9) 36.6 (31.5–42.0) 0.79 (0.61–1.03) 0.081
Osteoporosis (%) 2.4 (2.1–2.9) 3.6 (2.0–6.4) 0.94 (0.48–1.84) 0.854
Arthritis (%) 14.9 (14.2–15.7) 23.3 (18.6–28.7) 0.92 (0.70–1.19) 0.509
Cataract surgery (%) 6.3 (5.7–6.6) 25.5 (21.0–30.7) 2.85 (2.17–3.74) <0.001
Menopause (%) 37.7 (35.9–39.4) 9.7 (5.3–17.1) 0.54 (0.20–1.47) 0.228
ERM = epiretinal membrane; CI = confidence interval; BMI = body mass index.
Fig. 2. Cumulative frequency of visual acuity in the eyes with an epiretinal membrane.
Cumulative frequency (%)
Visual acuity 100
50
0
0 0.1 0.5 0.8 1
Fig. 1. Flow chart of subjects excluded and included for analysis in the current study. KHNANES = Korea National Health and Nutrition Examination Survey; ERM = epiretinal membrane.
2008 Through 2012 KNHANES subjects > 40 years old
n = 20,419 (subjects eligible to participate)
n = 14,772 (subjects recruited)
n = 5,647 subjects
(not avaiable gradable fundus photograph)
ERM (+)
n = 507 ERM (-)
n = 14,265
Table 3. The difference of nutrient intake between no ERM group and ERM group, and the result of age and sex adjusted univari- ate analysis
Intake/day No ERM ERM Adjusted (age, sex)
odds ratio p-value
Energy (kcal) 1,965.6 ± 10.8 1,728.4 ± 36.8 1.000 (0.999–1.000) <0.001
Water (g) 988.2 ± 9.5 818.7 ± 32.9 1.000 (0.999–1.000) 0.002
Protein (g) 69.1 ± 0.5 58.2 ± 1.6 0.991 (0.987–0.994) <0.001
Fat (g) 35.2 ± 0.4 26.6 ± 1.4 0.986 (0.980–0.992) <0.001
Carbohydrate (g) 325.8 ± 1.8 304.4 ± 5.7 0.999 (0.998–1.000) 0.005
Fiber (g) 8.1 ± 0.1 7.3 ± 0.3 0.984 (0.950–1.019) 0.366
Ash (g) 20.9 ± 0.1 20.5 ± 0.4 0.997 (0.987–1.008) 0.651
Ca (100mg) 518.7 ± 3.8 544.1 ± 18.0 1.000 (1.000–1.001) 0.075
Phosphorus (mg) 1,204.0 ± 3.6 1,193.0 ± 13.2 1.000 (1.000–1.000) 1.000
Fe (mg) 16.0 ± 0.1 16.2 ± 0.6 1.005 (1.001–1.010) 0.041
Na (mg) 5,119.6 ± 31.6 4,977.1 ± 127.1 1.000 (1.000–1.000) 0.369
K (mg) 3,210.3 ± 16.9 3,110.7 ± 54.8 1.000 (1.000–1.000) 0.325
Beta carotene (100 μg) 4,707.8 ± 105.1 4,452.8 ± 217.9 1.000 (1.000–1.000) 0.399
Retinol (μg) 96.1 ± 3.3 120.1 ± 16.6 1.000 (1.000–1.000) 0.092
Vitamin B1 (mg) 1.3 ± 0.0 1.3 ± 0.0 0.990 (0.828–1.184) 0.916
Vitamin B2 (mg) 1.2 ± 0.0 1.2 ± 0.0 0.908 (0.740–1.114) 0.354
Niacin (mg) 17.1 ± 0.1 16.6 ± 0.3 0.985 (0.967–1.003) 0.107
Vitamin C (mg) 112.8 ± 1.3 110.6 ± 4.1 1.000 (0.999–1.001) 0.613
Values are presented as mean ± standard deviation.
ERM = epiretinal membrane.
Table 4. The difference of blood test findings between two groups, and the result of age and sex adjusted univariate analysis
Variable No ERM ERM Adjusted (age, sex)
odds ratio p-value
BUN (mg/dL) 14.99 ± 0.06 15.45 ± 0.24 1.024 (1.005–1.043) 0.012
Creatinine (mg/dL) 0.84 ± 0.00 0.83 ± 0.01 0.706 (0.390–1.279) 0.251
RBC (mil/μL) 6.06 ± 0.02 5.92 ± 0.11 0.728 (0.559–0.947) 0.018
Vitamin D (ng/mL) 18.94 ± 0.14 18.93 ± 0.40 0.998 (0.982–1.015) 0.841
ALP (IU/L) 229.48 ± 1.04 233.26 ± 4.68 1.001 (1.000–1.002) 0.035
PTH (pg/mL) 66.29 ± 0.56 67.39 ± 1.67 1.000 (0.997–1.003) 0.947
ERM = epiretinal membrane; BUN = blood urea nitrogen; RBC = red blood cell; ALP = alkaline phosphatase; PTH = parathyroid hor- mone.
2.9% in the Korean population 40 years of age or older.
The result is similar to the results found in studies of the population of China and Japan. As previous studies indi- cated, the prevalence of ERM in East Asia was apparently lower than that in western countries. However, a higher prevalence of ERM in Asian ethnicities has been reported in some multi-ethnic studies [6,10]. Thus, whether the large variability in the prevalence of ERM was affected by the ethnicity or environment remains unclear.
As for the risk factors for ERM, some reports claimed that female gender was associated with an increased risk of ERM [3,6,14], while other reports claim that they could not find a gender-specific difference [5,8]. Analysis of refrac- tive errors also showed mixed results in previous studies [6-8,11,14]. In the univariate analysis of the current study, both female gender and myopic refractive errors were re-
lated to an increased risk of ERM. However, multiple LRA indicated that both factors had no significant association with ERM. In this regard, it is worth noting that only a few of the previously described epidemiologic studies of ERM prevalence adopted multiple LRA for their risk analysis.
There have been mixed results regarding the association between diabetes and ERM [1,9,12,15]. Hypercholesterol- emia [3,10,13] and a higher level of education [7,12] have also been reported as independent risk factors for ERM.
These associations were not corroborated by the current study.
Increased age was associated with the prevalence of ERM, as it was confirmed in most of the previous studies.
This may be due to the increase in posterior vitreous de- tachment (PVD) with aging. As in previous studies [1,2,4,15,24], an association between cataract surgery and Table 5. Multiple logistic regression model for risk factors of ERM
Variable Model
OR (95% CI) p-value Model for men
OR (95% CI) p-value Model for women
OR(95% CI) p-value Age group (yr)
40–49 1 (reference) 1 (reference) 1 (reference)
50–59 2.70 (1.47–4.96) 0.001 1.18 (0.49–2.82) 0.713 6.06 (2.40–15.28) <0.001
60–69 5.48 (3.02–9.94) <0.001 2.60 (1.17–5.81) 0.020 11.76 (4.63–29.89) <0.001
≥70 5.69 (3.06–10.56) <0.001 4.20 (1.86–9.46) 0.001 9.07 (3.37–24.39) <0.001
Male 1 (reference)
Female 0.83 (0.58–1.19) 0.317
Hypertriglyceridemia 1.01 (0.74–1.37) 0.953 0.73 (0.45–1.19) 0.210 1.26 (0.81–1.96) 0.297
Drinking 0.77 (0.55–1.08) 0.130 0.78 (0.45–1.36) 0.382 0.83 (0.55–1.25) 0.366
Cataract surgery 2.82 (2.08–3.81) <0.001 3.54 (2.13–5.89) <0.001 2.44 (1.62–3.67) <0.001 Spherical equivalent 0.99 (0.92–1.07) 0.857 0.94 (0.85–1.04) 0.250 1.02 (0.91–1.15) 0.685 Energy (100 kcal) 0.99 (0.98–1.01) 0.444 1.00 (0.98–1.02) 0.767 0.99 (0.97–1.02) 0.526
Ash 1.01 (0.99–1.02) 0.523 1.02 (1.00–1.04) 0.074 0.99 (0.97–1.02) 0.588
Calcium (100 mg) 1.05 (1.00–1.11) 0.049 1.02 (0.94–1.11) 0.593 1.08 (1.02–1.15) 0.010 Phosphorus (mg) 1.00 (1.00–1.00) 0.704 1.00 (0.93–1.08) 0.940 0.97 (0.89–1.06) 0.512
Ferrum (mg) 1.00 (0.98–1.01) 0.565 0.99 (0.96–1.01) 0.318 1.00 (0.99–1.01) 0.990
Retinol (μg) 1.00 (1.00–1.00) 0.063 0.99 (0.94–1.05) 0.772 1.03 (1.01–1.06) 0.011 Vitamin B2 (mg) 0.83 (0.59–1.18) 0.297 0.85 (0.51–1.43) 0.548 0.84 (0.56–1.26) 0.403
BUN (mg/dL) 0.98 (0.96–1.01) 0.177 0.99 (0.95–1.03) 0.566 0.97 (0.94–1.01) 0.195
RBC (mil/μL) 0.66 (0.45–0.95) 0.027 0.51 (0.31–0.83) 0.007 0.80 (0.51–1.27) 0.343 ERM = epiretinal membrane; BUN = blood urea nitrogen; RBC = red blood cell.
ERM prevalence was confirmed. Jahn et al. [24] reported that the prevalence of ERM increased from 14.8% to 25.3% six months after extracapsular cataract surgery.
They explained that this was associated with PVD induced by cataract surgery and the resulting mechanical traction on the vitreo-retinal interface. Although the correlation of extracapsular cataract surgery with the prevalence of ERM was identified in previous studies, it remains to be answered whether modern cataract surgery involving smaller incisions and phacoemulsification techniques would also be related to an increased prevalence of ERM.
The present study shows that modern cataract surgery can also be a risk factor for ERM.
According to the results of multiple LRA, increased in- take of calcium was associated with an increased risk of ERM. Tajima et al. [25] reported that the synthesis of col- lagen decreased in cell cultures under hypercalcemic con- ditions. Reduced synthesis of collagen induces vitreous liquefaction and this may result in PVD. In addition, calci- um itself may lead to changes in adhesion molecules at the vitreo-retinal interface, which may also result in PVD and subsequent ERM. Unrelated to PVD, a high intake of cal- cium may facilitate migration or proliferation of cellular components involved in ERM formation [26]. However,
these are mere hypotheses and further studies are needed.
Nevertheless, the present study showed that a high intake of calcium can be an independent risk factor for ERM.
This may have important clinical implications, since calci- um may act as a new therapeutic target for ERM preven- tion in the future.
RBC count was also associated with ERM. When RBC count decreased, the risk of ERM increased. Although it is hard to explain the relationship between anemia and ERM in men, a common mechanism found in the devel- opment of ERM in subjects with sickle cell anemia may work [27,28]. Although further investigation is required to reveal any definite associations, the current study indi- cates that restricting calcium intake in women, and ane- mia correction in men may help reduce the incidence of ERM.
This study has several limitations. First, the occurrence of PVD could not be investigated and correlated with ERM prevalence, because grading was done only with fundus photographs. The prevalence of ERM was 2.9% in this study, which might be underestimated by using only fundus photography not optical coherence tomography. It was possible to miss tiny ERM in some cases. Moreover, since this study is a cross-sectional study, it has inherent limitations in explaining the causal relationship of patho- genesis. Second, both idiopathic and secondary ERM were included without discrimination. Third, although a high intake of calcium or a low RBC count were inde- pendently related to the prevalence of ERM, there might be other confounding factors that could not be assessed or adjusted for this study. Nevertheless, this study has its own strength as a population-based study representing the demographic structure of one nation. Also, the num- ber of participants in this study is roughly fifteen thou- sand, which is large enough to conduct multiple LRAs for risk factor analysis. Moreover, as far as the authors are aware, this is the first study assessing risk factors for ERM with regard to socioeconomic conditions and nutri- ent intake.
In conclusion, the nation-wide prevalence of ERM was 2.9% in the Korean population aged 40 years or older.
Risk factors for ERM were aging, a history of cataract surgery, a high intake of calcium and a low RBC count.
Fig. 3. Forest plot in the multiple logistic regression model for risk factors of epiretinal membrane.
1 10
Age group (yr) 40-49 (reference) 50–59 60–69 ≥70 Male (reference) Female
Hypertriglyceridemia Drinking
Cataract surgery Spherical equivalent Energy (100 kcal) Ash
Calcium (100 mg) Phosphorus (mg) Ferrum (mg) Retinol (μg) Vitamin B2 (mg) BUN (mg/dL) RBC (mil/μL)
Variable Forest plot
Conflict of Interest
No potential conflict of interest relevant to this article was reported.
References
1. Mitchell P, Smith W, Chey T, et al. Prevalence and associa- tions of epiretinal membranes: the Blue Mountains Eye Study, Australia. Ophthalmology 1997;104:1033-40.
2. Fraser-Bell S, Guzowski M, Rochtchina E, et al. Five-year cumulative incidence and progression of epiretinal mem- branes: the Blue Mountains Eye Study. Ophthalmology 2003;110:34-40.
3. Miyazaki M, Nakamura H, Kubo M, et al. Prevalence and risk factors for epiretinal membranes in a Japanese popula- tion: the Hisayama Study. Graefes Arch Clin Exp Ophthal- mol 2003;241:642-6.
4. Fraser-Bell S, Ying-Lai M, Klein R, et al. Prevalence and associations of epiretinal membranes in latinos: the Los Angeles Latino Eye Study. Invest Ophthalmol Vis Sci 2004;45:1732-6.
5. McCarty DJ, Mukesh BN, Chikani V, et al. Prevalence and associations of epiretinal membranes in the visual impair- ment project. Am J Ophthalmol 2005;140:288-94.
6. Kawasaki R, Wang JJ, Mitchell P, et al. Racial difference in the prevalence of epiretinal membrane between Cauca- sians and Asians. Br J Ophthalmol 2008;92:1320-4.
7. You Q, Xu L, Jonas JB. Prevalence and associations of epiretinal membranes in adult Chinese: the Beijing eye study. Eye (Lond) 2008;22:874-9.
8. Duan XR, Liang YB, Friedman DS, et al. Prevalence and associations of epiretinal membranes in a rural Chinese adult population: the Handan Eye Study. Invest Ophthal- mol Vis Sci 2009;50:2018-23.
9. Kawasaki R, Wang JJ, Sato H, et al. Prevalence and associ- ations of epiretinal membranes in an adult Japanese popu- lation: the Funagata study. Eye (Lond) 2009;23:1045-51.
10. Ng CH, Cheung N, Wang JJ, et al. Prevalence and risk fac- tors for epiretinal membranes in a multi-ethnic United States population. Ophthalmology 2011;118:694-9.
11. Koh V, Cheung CY, Wong WL, et al. Prevalence and risk factors of epiretinal membrane in Asian Indians. Invest Ophthalmol Vis Sci 2012;53:1018-22.
12. Zhu XF, Peng JJ, Zou HD, et al. Prevalence and risk factors
of idiopathic epiretinal membranes in Beixinjing blocks, Shanghai, China. PLoS One 2012;7:e51445.
13. Aung KZ, Makeyeva G, Adams MK, et al. The preva- lence and risk factors of epiretinal membranes: the Mel- bourne Collaborative Cohort Study. Retina 2013;33:1026- 34.
14. Ye H, Zhang Q, Liu X, et al. Prevalence and associations of epiretinal membrane in an elderly urban Chinese popula- tion in China: the Jiangning Eye Study. Br J Ophthalmol 2015;99:1594-7.
15. Klein R, Klein BE, Wang Q, Moss SE. The epidemiology of epiretinal membranes. Trans Am Ophthalmol Soc 1994;92:403-25.
16. Bu SC, Kuijer R, Li XR, et al. Idiopathic epiretinal mem- brane. Retina 2014;34:2317-35.
17. Andjelic S, Lumi X, Yan X, et al. Characterization of ex vivo cultured neuronal- and glial-like cells from human id- iopathic epiretinal membranes. BMC Ophthalmol 2014;14:165.
18. Kokavec J, Min SH, Tan MH, et al. Biochemical analysis of the living human vitreous. Clin Exp Ophthalmol 2016;44:597-609.
19. Bonavolonta O, Ferrante P, Terracciano L, Vecchione R.
Further researches about retinal damages and dietary pro- tein imbalance in growing rats. Int J Vitam Nutr Res 1991;61:251-7.
20. Trivino A, Ramirez AI, Salazar JJ, et al. A cholester- ol-enriched diet induces ultrastructural changes in reti- nal and macroglial rabbit cells. Exp Eye Res 2006;83:357- 66.
21. Raff U, Harazny JM, Titze SI, et al. Salt intake determines retinal arteriolar structure in treatment resistant hyperten- sion independent of blood pressure. Atherosclerosis 2012;222:235-40.
22. Oyeyemi GM, Adewara AA, Adeyemi RA. Complex sur- vey data analysis: a comparison of SAS, SPSS and STATA.
Asian J Math Stat 2010;3:33-9.
23. Kim Y, Park S, Kim NS, Lee BK. Inappropriate survey de- sign analysis of the Korean National Health and Nutrition Examination Survey may produce biased results. J Prev Med Public Health 2013;46:96-104.
24. Jahn CE, Minich V, Moldaschel S, et al. Epiretinal mem- branes after extracapsular cataract surgery(1). J Cataract Refract Surg 2001;27:753-60.
25. Tajima T, Iijima K, Watanabe T, Yamaguchi H. The influ- ence of calcium ions on the synthesis of collagen and gly-
cosaminoglycans in human diploid cells in culture. Exp Pathol 1981;19:219-25.
26. Smith-Thomas L, Haycock JW, Metcalfe R, et al. Involve- ment of calcium in retinal pigment epithelial cell prolifera- tion and pigmentation. Curr Eye Res 1998;17:813-22.
27. Carney MD, Jampol LM. Epiretinal membranes in sickle cell retinopathy. Arch Ophthalmol 1987;105:214-7.
28. Rajagopal R, Apte RS. Full-thickness macular hole in a pa- tient with proliferative sickle cell retinopathy. Retina 2010;30:838-9.