ⓒ2011 The Korean Ophthalmological Society
This is an Open Access article distributed under the terms of the Creative Commons Attribution Non-Commercial License (http://creativecommons.org/licenses /by-nc/3.0/) which permits unrestricted non-commercial use, distribution, and reproduction in any medium, provided the original work is properly cited.
Original Article
Prevalence of Eye Diseases in South Korea: Data from the Korea National Health and Nutrition Examination Survey
2008-2009
Kyung-Chul Yoon1, Gui-Hyeong Mun1, Sang-Duck Kim2, Seung-Hyun Kim3, Chan Yun Kim4, Ki Ho Park5, Young Jeung Park6, Seung-Hee Baek7, Su Jeong Song8, Jae Pil Shin9, Suk-Woo Yang10, Seung-Young Yu11, Jong Soo Lee12, Key Hwan Lim13, Hye-Jin Park14, Eun-Young Pyo14, Ji-Eun Yang14, Young-Taek Kim14,
Kyung-Won Oh14, Se Woong Kang15
1Department of Ophthalmology, Chonnam National University Hospital, Chonnam National University Medical School, Gwangju, Korea
2Department of Ophthalmology, Wonkwang University College of Medicine, Iksan, Korea
3Department of Ophthalmology, Korea University College of Medicine, Ansan, Korea
4Institute of Vision Research, Department of Ophthalmology, Yonsei University College of Medicine, Seoul, Korea
5Department of Ophthalmology, Seoul National University College of Medicine, Seoul, Korea
6Department of Ophthalmology, Cheil Eye Hospital, Daegu, Korea
7Department of Ophthalmology, Kim’s Eye Hospital, Konyang University College of Medicine, Seoul, Korea
8Department of Ophthalmology, Kangbuk Samsung Hospital, Sungkyunkwan University School of Medicine, Seoul, Korea
9Department of Ophthalmology, Kyungpook National University School of Medicine, Daegu, Korea
10Department of Ophthalmology, The Catholic University of Korea College of Medicine, Seoul, Korea
11Department of Ophthalmology, Kyung Hee University School of Medicine, Seoul, Korea
12Department of Ophthalmology, Pusan National University College of Medicine, Busan, Korea
13Department of Ophthalmology, Ewha Womans University School of Medicine, Seoul, Korea
14Division of Chronic Disease Surveillance, Korea Centers for Disease Control & Prevention, Seoul, Korea
15Department of Ophthalmology, Samsung Medical Center, Sungkyunkwan University School of Medicine, Seoul, Korea
Purpose: The aim of this study is to report on preliminary data regarding the prevalence of major eye diseases in Korea.
Methods: We obtained data from the Korea National Health and Nutrition Examination Survey, a nation-wide cross-sectional survey and examinations of the non-institutionalized civilian population in South Korea (n = 14,606), conducted from July 2008 to December 2009. Field survey teams included an ophthalmologist, nurses, and interviewers, traveled with a mobile examination unit and performed interviews and ophthalmologic examinations.
Results: The prevalence of visual impairment, myopia, hyperopia and astigmatism in participants over 5 years of age was 0.4 ± 0.1%, 53.7 ± 0.6%, 10.7 ± 0.4%, and 58.0 ± 0.6%, respectively. The prevalence of strabismus and blepharoptosis in participants over 3 years of age was 1.5 ± 0.1% and 11.0 ± 0.8%, respectively. In participants over 40 years of age, the prevalence of cataract, pterygium, early and late age-related macular degeneration, dia- betic retinopathy and glaucoma was 40.2 ± 1.3%, 8.9 ± 0.5%, 5.1 ± 0.3%, 0.5 ± 0.1%, 13.4 ± 1.5%, and 2.1 ± 0.2%, respectively.
Conclusions: This is the first nation-wide epidemiologic study conducted in South Korea for assessment of the prev- alence of eye diseases by both the Korean Ophthalmologic Society and the Korea Center for Disease Control and Prevention. This study will provide preliminary information for use in further investigation, prevention, and management of eye diseases in Korea.
Key Words:Epidemiology, Eye diseases, Korea, Korea National Health and Nutrition Examination Survey, Prevalence
Received: July 18, 2011 Accepted: September 23, 2011
Corresponding Authors: Se Woong Kang, MD, PhD. Department of Ophthalmology, Samsung Medical Center, Sungkyunkwan University School of Medicine, #50 Irwon-dong, Gangnam-gu, Seoul 135-710, Korea. Tel: 82-2-3410-3562, Fax: 82-2-3410-0074, E-mail: [email protected].
Kyung Won Oh, PhD. Division of Chronic Disease Surveillance, Korea Centers for Disease Control & Prevention, #187 Osongsaengmyeong 2-ro, Gangoe-myeon, Cheongwon 363-951, Korea. Tel: 82-43-719-7460, Fax: 82-43-719-7527, E-mail: [email protected]
Epidemiological studies provide information on the pre- vention, treatment, and minimization of the impact of dis- eases on society. In the past two decades, a wide range of epi- demiologic studies in ophthalmology have provided im- portant information on the pattern of visual impairment and the major eye diseases that cause such vision loss [1].
Although several epidemiological studies of several age-re- lated eye diseases (e.g., glaucoma, age-related macular de- generation, and cataract) have been conducted in Korea [2-4], these studies were hospital-based or were conducted primarily in urban areas. Data on the prevalence of diseases based on the number of hospital visits or surveys conducted in limited areas are easy to obtain; however, substantial dif- ferences may exist between such data and that obtained in large-scale population studies, which are more accurate and can represent entire populations.
Large-scale population-based studies conducted over the past two decades in many countries, including the United States [5-14], Western Europe [15-17],Australia [18-21], Japan [22-26],Singapore [27-30], and China [31-35],have been used to guide public health policy and plan preventive strategies. However, these studies were conducted mostly with regard to major age-related eye diseases, such as cata- ract, glaucoma, age-related macular degeneration, and dia- betic retinopathy, which are major causes of vision loss.
Nation-wide epidemiological studies of all age groups for the prevalence of common eye diseases have not been performed.
The Korea Center for Disease Control and Prevention (CDC) conducted a series of Korea National Health and Nutrition Examination Surveys (KNHANES) in 1998, 2001, 2005 and 2007-2009 for examination of the general health and nutrition status of Koreans. As of the fourth KNHANES (2007-2009), an annual total of 4,600 households were se- lected, and the participating household members were inter- viewed regarding health and nutrition and underwent a basic health examination that included blood pressure measure- ments, blood and urine collection, a pulmonary function test, and a dental examination. Since the Korean Ophthalmologic Society has participated in this survey since 2008, oph- thalmologic interviews and examinations were also con- ducted with the same participants.
The purpose of this study is to investigate the national prevalence of common eye diseases in South Korea based on the survey data obtained from the KNHANES and to analyze the prevalence of diseases according to age and gender. Data
obtained from KNHANES may offer further insight into the etiology, ethnic differences, and public health impact of the most common eye diseases affecting Korean people living in Asia.
Materials and Methods
Study design and population
The KNHANES is an ongoing population-based, cross- sectional epidemiological survey conducted in South Korea.
Annually, 4,000 households in 200 enumeration districts were selected by a panel to represent the civilian, non-in- stitutionalized South Korean population using the stratified, multistage clustered sampling method based on the 2005 National Census Data. In KNHANES, sample design and size are estimated so that annual survey results represent the whole population in Korea. Therefore, annual survey re- sults can be used as statistics to represent the overall Korean population. All members of each selected household were asked to participate in the survey, and the rate of partic- ipation in the past several cycles ranged from 79% to 84%.
From July 2008, ophthalmologic interviews and examina- tions have been conducted. All examination and health in- terviews were conducted by trained teams in mobile cen- ters, while nutrition surveys were performed in individual households.
This survey is aimed to determine the prevalence of the following vision status and common eye diseases in a pop- ulation-based sample of Koreans: visual impairment and blindness, refractive errors, strabismus, blepharoptosis, cata- ract, pterygium, diabetic retinopathy, age-related macular de- generation (AMD), and glaucoma. The ophthalmologic sur- vey was designed to be conducted over 5 years from 2008 to 2013. The present study includes interim data from a survey conducted from July 2008 to December 2009.
Examination procedures
Examination procedures were stratified according to age group. Participants aged 3 to 4 years old only underwent test- ing for strabismus and blepharoptosis. Autorefraction and visual acuity testing and testing for strabismus and blephar- optosis were performed among the participants ranging in age from 5 to 18 years old. The participants over 19 years of age underwent full ocular examinations, including autore- fraction and visual acuity testing, testing for strabismus and blepharoptosis, slit lamp examinations, measurement of in- traocular pressure (IOP), and fundus photographs. IOP was measured with a Goldmann applanation tonometer. For par- ticipants meeting the glaucoma suspicion criteria, frequency doubling perimetry (FDT) was carried out. Phamacological pupil dilatation was performed for participants who had a history of diabetes mellitus or random blood glucose level of 200 mg/dL or higher and/or fundus photograph suspected di-
Ophthalmologic interview
Correction of visual acuity
Auto-refraction
Testing for strabismus & ptosis For 3 years or older participants For 5 years or older participants
Slit lamp examination
(cataract, pterygium, depth of anterior chamber) IOP measurement
Fundus photograph without pupil dilatation
① IOP ≥22 mmHg or
② Suspected glaucoma on fundus examination
① Participants with diabetes mellitus or random blood sugar ≥200 mg or
② Suspected DR on fundus examination or
③ Difficulty in checking the fundus photograph due to media opacity
Visual field examination Fundus photograph after pupil dilatation Visual acuity <0.8
Visual acuity
For 19 years or older participants
Fig. 1. Ophthalmologic ex- amination flowchart for Korea National Health and Nutrition Examination Surveys. IOP
= intraocular pressure; DR
= diabetic retinopathy.
abetic retinopathy and/or difficulty obtaining a fundus photo- graph due to media opacity (Fig. 1). All procedures described above except for fundus photography were performed before pupil dilatation.
Examination methods and definition of eye diseases 1) Questionnaire
A detailed interviewer-administered questionnaire was ad- ministered for collection of relevant sociodemographic and medical information. Collected data included marital status, education, occupation, current housing status, lifestyle fac- tors (including cigarette smoking history), optical symptoms, systemic medical and surgical history, and family history of eye diseases.
2) Visual acuity
Uncorrected visual acuity and/or best-corrected distance visual acuity (BCVA) were measured at a distance of 4 m us- ing an international standard vision chart based on the LogMAR Scale (Jin’s vision chart, Seoul, Korea) [36].
Visual impairment was defined as a BCVA of 0.32 or worse in the best eye. Blindness was defined as BCVA of 0.02 or worse in the right or left eye.
3) Autorefraction
An autorefractor-keratometer (KR8800; Topcon, Tokyo, Japan) was used for all measurement of refraction, which were converted to spherical equivalents calculated as the spherical value plus half of the astigmatic value. Myopia was defined as an spherical equivalents of worse than -0.75 diop- ters (D). Hyperopia was defined as spherical equivalents of worse than +1.0 D. Astigmatism was defined as a cylindrical error worse than +0.75 D.
4) Strabismus
Testing for strabismus included the cover-uncover test, prism and alternate cover test, and/or Krimsky test. Strabismus was defined as a manifest or latent ocular deviation at dis- tance or near fixation with or without spectacle correction, esodeviation of 10 or more prism diopters, exodeviation of 15 or more prism diopters, or any vertical deviation.
5) Blepharoptosis
Blepharoptosis was defined as presentation of a marginal reflex distance (MRD1) of 2 mm or less. Measurement of MRD1 was performed as follows: Positioned at the physi- cian’s eye level, participants were asked to look straight ahead and relax while focusing at a distance target. Shining the penlight into the participant’s eye, the distance from the corneal light reflex to the upper eyelid margin was measured in millimeters.
6) Slit lamp examination
A structured slit-lamp examination (Haag-Streit model BQ-900; Haag-Streit AG, Koeniz, Switzerland) was per- formed by study ophthalmologists. The slit lamp examina- tion was performed for determination of diseases in the ante- rior segment of the eye (e.g., pterygium and cataract) and measurement of the IOP and anterior chamber depth using the Van Herick method [37]. Cataract was defined as a nu- clear, cortical, or posterior subcapsular cataract in at least one eye. Pseudophakic and aphakic eyes were included as oper- ated cataracts for the purpose of statistical analysis. A ptery- gium was defined as a radially oriented fibrovascular lesion crossing over the nasal or temporal limbus. Grading was based on the visibility of the underlying episcleral blood ves- sels [38].
7) Fundus photography
A digital nonmydriatic fundus camera (TRC-NW6S, Topcon) and a Nikon D-80 digital camera (Nikon, Tokyo, Japan) were used to obtain the digital fundus images. Digital images were captured from all participants 19 years of age and older under physiological mydriasis. For each partic- ipant, one 45° nonmydriatic digital retinal image centered on the fovea (field 2) was taken per eye (2 images per person in total). Each image was graded twice (a preliminary grade and a detailed grade) using the grading protocol of the International Age-related Maculopathy Epidemiological Study Group [39]. Optic nerve configuration and any retinal pathologic findings were recorded. Patients were defined as having ear- ly AMD if they met any one of the following criteria: (1) the presence of soft indistinct drusen or reticular drusen, or (2) the presence of hard or soft distinct drusen with pigmentary abnormalities (increased pigmentation or hypopigmentation of the retinal pigment epithelium) in the absence of signs of late AMD. Late AMD included the presence of signs of wet AMD or geographic atrophy. Wet AMD was defined as reti- nal pigment epithelial detachment or serous detachment of the sensory retina, subretinal or sub-RPE hemorrhages, and subretinal fibrous scars. Geographic atrophy was defined as a circular discrete area (of 175 microns in diameter) of retinal depigmentation with visible choroidal vessels, in the absence of signs of wet AMD.
In participants who had a history of diabetes mellitus or random blood glucose level of 200 mg/dL or higher and/or suspicion of diabetic retinopathy in nonmydriatic fudndus photography, 7 standard photographs from the Early Treatment for Diabetic Retinopathy Study were obtained from each eye after pharmacological pupil dilatation [40,41]. Diabetic ret- inopathy was defined as the presence of 1 or more retinal mi- croaneurysms or retinal blot hemorrhages with or without more severe lesions (hard exudates, soft exudates, intraretinal microvascular abnormalities, venous bleeding, new retinal vessels, and fibroproliferations) [42,43]. The prevalence of diabetic retinopathy was estimated in persons with diabetes mellitus.
8) Visual field test
FDT (Humphrey Matrix; Carl Zeiss Meditec Inc., Dublin, CA, USA) testing with the screening program N-30-1 was performed if the participants had elevated IOP ≥22 mmHg or a glaucomatous optic disc. FDT testing was repeated once if deemed unreliable. Patients were defined as having primary open angle glaucoma (POAG) if they met any one of the fol- lowing category I or category II diagnostic criteria [44].
9) Category I diagnosis
The presence of FDT testing results, fixation error and false positive error ≤1: (1) elevated IOP ≥22 mmHg or (2) glaucomatous optic disc (loss of neuroretinal rim with verti- cal or horizontal cup-disc ratio ≥0.6 or presence of optic disc hemorrhage or presence of retinal nerve fiber layer defect or
asymmetry of vertical cup-disc ratio ≥0.2), (3) the presence of an abnormal FDT testing result (at least one location of re- duced sensitivity) and (4) the presence of an open angle (peripheral anterior chamber depth >1/4 corneal thickness)
10) Category II diagnosis
Absence of FDT testing results or fixation error or false positive error ≥2, (1) the presence of an open angle (peripheral anterior chamber depth >1/4 corneal thickness) and (2) loss of neuroretinal rim with vertical cup-disc ratio ≥0.9, (3) asym- metry of vertical cup-disc ratio ≥0.3 or (4) the presence of retinal nerve fiber layer defect and violation of the ISNT rule.
Normal tension glaucoma (NTG) was defined using the same criteria for POAG with IOP ≤21 mmHg. Primary angle closure glaucoma (PACG) was diagnosed when all of the fol- lowing four criteria were met: (1) the presence of a narrow, occludable angle (peripheral anterior chamber depth <1/4 corneal thickness), (2) elevated IOP ≥22 mmHg, (3) glaucom- atous optic disc (loss of neuroretinal rim with vertical or hori- zontal cup-disc ratio ≥0.6 or the presence of optic disc hemor- rhage or retinal nerve fiber layer defect), and (4) the presence of an abnormal FDT testing result (at least one location of re- duced sensitivity) and fixation error, false positive error ≤1.
Quality control and data analysis
A total of 308 surveys were conducted by four survey teams within a time span of 77 weeks. Each survey team in- cluded one ophthalmologist, one otolaryngologist, one den- tist, three nurses, two interviewers, and one coordinator. The team moved with a mobile examination unit to pre-assigned locations and performed surveys for three days. A total of 199 ophthalmology residents or ophthalmologists from 66 training hospitals participated in this project as ophthalmo- logic examiners.
The quality of the survey was verified by the Epidemiologic Survey Committee of the Korean Ophthalmologic Society.
Training of participating residents was periodically performed by acting staff members of the National Epidemiologic Survey Committee of the Korean Ophthalmologic Society.
Data were collected using a combination of paper and digital formats. Imaging data, including fundus photographs, were retrieved directly from the imaging equipment and stored in their respective computers. All variables of interest were en- tered into a password-protected Microsoft Office Access da- tabase by a data entry clerk. For all digital information, origi- nal data were copied into external hard disks daily and writ- ten onto DVDs for storage.
Statistical analyses were performed using SAS ver. 9.2 (SAS Institute, Cary, NC, USA). All estimates were obtained using the sample weight adjusted for oversampling, non- response and the Korean population in 2008 to 2009, and standard errors of estimates were estimated accounting for the complex design of the survey. Prevalence estimates for all outcomes were performed for the overall sample and then
Table 1. Number of participants according to age and gender
Age group (yr) Male Female Total
3-4 203 174 377
5-18 1,608 1,458 3,066
19-29 692 869 1,561
30-39 905 1,254 2,159
40-49 954 1,265 2,219
50-59 804 1,062 1,866
60-69 784 1,023 1,807
≥70 630 921 1,551
Total 6,580 8,026 14,606
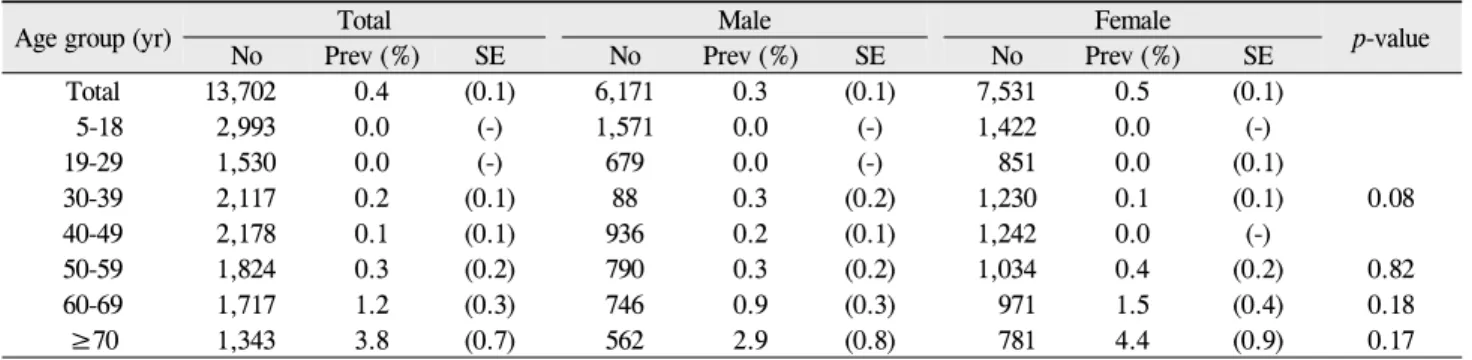
Table 2. Prevalence of visual impairment according to age and gender
Age group (yr) Total Male Female
p-value
No Prev (%) SE No Prev (%) SE No Prev (%) SE
Total 13,702 0.4 (0.1) 6,171 0.3 (0.1) 7,531 0.5 (0.1)
5-18 2,993 0.0 (-) 1,571 0.0 (-) 1,422 0.0 (-)
19-29 1,530 0.0 (-) 679 0.0 (-) 851 0.0 (0.1)
30-39 2,117 0.2 (0.1) 88 0.3 (0.2) 1,230 0.1 (0.1) 0.08
40-49 2,178 0.1 (0.1) 936 0.2 (0.1) 1,242 0.0 (-)
50-59 1,824 0.3 (0.2) 790 0.3 (0.2) 1,034 0.4 (0.2) 0.82
60-69 1,717 1.2 (0.3) 746 0.9 (0.3) 971 1.5 (0.4) 0.18
≥70 1,343 3.8 (0.7) 562 2.9 (0.8) 781 4.4 (0.9) 0.17
Visual impairment was defined as a best-corrected distance visual acuity of 0.32 or worse in the best eye.
No = number of participants; Prev = prevalence; SE = standard error.
in age- and gender-stratified groups. Chi-square tests were used for analysis of differences in prevalence between genders. Logistic regression was used for analysis of differ- ences in prevalence among age groups.
Results
During the period from July 2008 to December 2009, a to- tal of 14,606 participants from 5,986 households were re- cruited and underwent an eye examination. Ages of the study participants ranged from 3 to 95 years of age: 6,580 were men and 8,026 were women. Table 1 shows the age and gen- der distributions of the study population.
Visual impairment and blindness
The overall prevalence of visual impairment was 0.4 ± 0.1% (0.3 ± 0.1% in males, 0.5 ± 0.1% in females) (Table 2), while that in participants over 40 years of age was 0.9 ± 0.1%
(0.6 ± 0.1% in males, 1.1 ± 0.2% in females) and was higher in females than males (p = 0.04). The prevalence of visual impairment in participants over 70 years of age was 3.8 ± 0.7% (2.9 ± 0.8% in males, 4.4 ± 0.9% in females) and showed a significant increase with age (p < 0.01). The preva- lence of blindness in either eye of participants over 65 years of age was 0.2 ± 0.1% (0.3 ± 0.2% in males, 0.1 ± 0.1% in fe-
males), and there were no statistically significant differences in relation to gender (p > 0.05).
Refractive errors
The overall prevalence of myopia was 53.7 ± 0.6% (54.3 ± 0.8% in males, 53.1 ± 0.7% in females) (Table 3). The preva- lence of myopia in the group of participants ranging in age from 12 to 18 was 78.8 ± 1.3% (77.9 ± 1.7% in males, 79.9 ± 1.7% in females) and was highest among the age groups (p <
0.01). The prevalence of myopia was higher in females than in males in the 19 to 29 and over 70 years age groups (p <
0.05 for both).
The overall prevalence of hyperopia was 10.7 ± 0.4% (9.4
± 0.4% in males, 12.0 ± 0.5% in females) (Table 3). In the group of participants ranging in age from 5 to 11, the preva- lence of hyperopia was 5.3 ± 0.6% and then decreased with age. From the group of participants ranging in age from 40 to 49, the prevalence of hyperopia again increased with age.
The prevalence of hyperopia in the group of participants ranging in age from 60 to 69 and in the age group over 70 years was 43.8 ± 1.4% and 47.1 ± 1.5%, respectively. In all age groups, there was no statistically significant difference in relation to gender (p > 0.05).
The overall prevalence of astigmatism was 58.0 ± 0.6%
(57.6 ± 0.8% in males, 58.4 ± 0.7% in females) (Table 3), while that in the 70 years or older age group was 92.0 ± 0.8%
(92.9 ± 1.2% in males, 91.5 ± 1.1% in females), illustrating a significant increase with age (p < 0.01). In the group of par- ticipants ranging in age from 30 to 39, the prevalence of as- tigmatism was higher in males than in females (p < 0.01).
Strabismus
The overall prevalence of strabismus was 1.5 ± 0.1% (1.5
± 0.2% in males, 1.5 ± 0.2% in females) (Table 4). The preva- lence of strabismus in participants over 40 years of age was 1.4 ± 0.2% (1.5 ± 0.2% in males, 1.2 ± 0.2% in females). In the group of participants ranging in age from 3 to 5 years, the prevalence of strabismus was 1.8 ± 0.7% (0.5 ± 0.4% in
Table 3. Prevalence of refractive errors according to age
Age group (yr) Myopia Hyperopia Astigmatism
No Prev (%) SE No Prev (%) SE No Prev (%) SE
Total 13,636 53.7 (0.6) 13,636 10.7 (0.4) 13,636 58.0 (0.6)
5-11 1,560 50.0 (1.5) 1,560 5.3 (0.6) 1,560 38.7 (1.4)
12-18 1,429 78.8 (1.3) 1,429 2.5 (0.4) 1,429 61.6 (1.6)
19-29 1,529 75.3 (1.2) 1,529 1.9 (0.4) 1,529 53.9 (1.4)
30-39 2,091 67.4 (1.2) 2,091 1.1 (0.3) 2,091 49.5 (1.3)
40-49 2,147 51.1 (1.3) 2,147 3.1 (0.4) 2,147 51.8 (1.4)
50-59 1,786 29.3 (1.3) 1,786 16.5 (1.0) 1,786 63.0 (1.3)
60-69 1,702 18.2 (1.1) 1,702 43.8 (1.5) 1,702 79.4 (1.1)
≥70 1,392 28.4 (1.2) 1,392 47.1 (1.5) 1,392 92.0 (0.8)
Myopia was defined as spherical equivalents of worse than -0.75 diopter. Hyperopia was defined defined as spherical equivalents of worse than +1.0 diopter. Astigmatism was defined as a cylindrical error worse than +0.75 diopter.
No = number of participants; Prev = prevalence; SE = standard error.
Table 4. Prevalence of strabismus according to age and gender
Age group (yr) Total Male Female
p-value
No Prev (%) SE No Prev (%) SE No Prev (%) SE
Total 14,464 1.5 (0.1) 6,517 1.5 (0.2) 7,947 1.5 (0.2) 0.93
3-5 583 1.8 (0.7) 314 0.5 (0.4) 269 3.4 (1.4) 0.01
6-11 1,385 1.8 (0.3) 725 1.7 (0.4) 660 1.9 (0.6) 0.75
12-18 1,448 1.9 (0.4) 756 1.7 (0.6) 692 2.1 (0.5) 0.65
19-29 1,543 1.5 (0.4) 687 1.1 (0.4) 856 2.0 (0.6) 0.18
30-39 2,138 1.7 (0.3) 898 2.1 (0.5) 1,240 1.2 (0.3) 0.09
40-49 2,197 1.0 (0.2) 942 1.0 (0.3) 1,255 0.9 (0.3) 0.86
50-59 1,852 1.4 (0.3) 797 1.5 (0.4) 1,055 1.3 (0.4) 0.68
60-69 1,787 1.6 (0.3) 776 2.2 (0.5) 1,011 1.1 (0.4) 0.07
≥70 1,531 1.9 (0.5) 622 2.2 (0.7) 909 1.8 (0.6) 0.69
Strabismus was defined as a heterotropia at distance and/or near fixation with or without spectacle correction, esodeviation of 10 or more prism diopters, exodeviation of 15 or more prism diopters, or any vertical deviation.
No = number of participants; Prev = prevalence; SE = standard error.
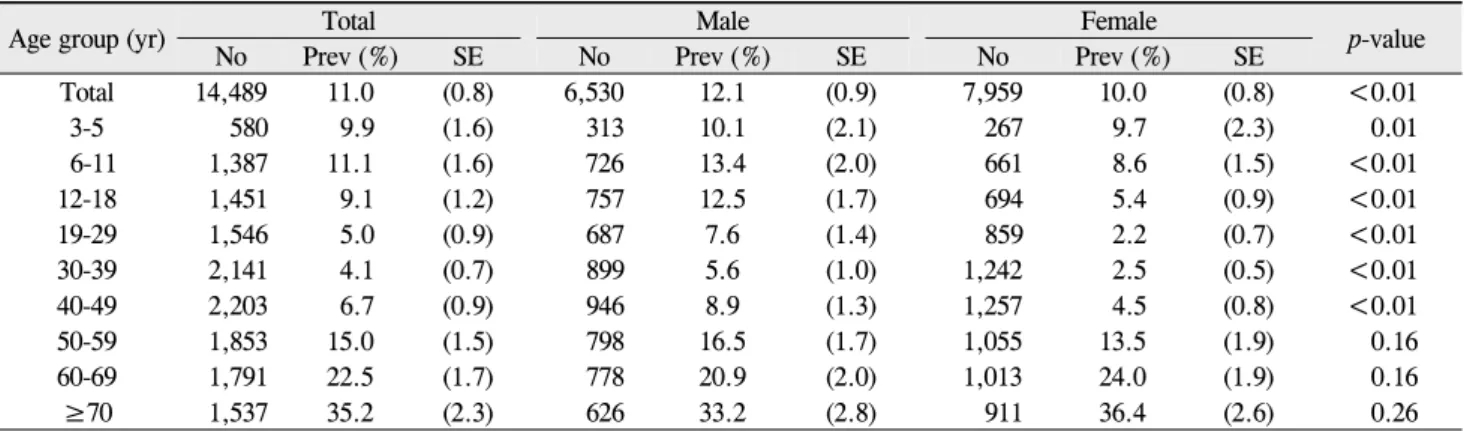
Table 5. Prevalence of blepharoptosis according to age and gender
Age group (yr) Total Male Female
p-value
No Prev (%) SE No Prev (%) SE No Prev (%) SE
Total 14,489 11.0 (0.8) 6,530 12.1 (0.9) 7,959 10.0 (0.8) <0.01
3-5 580 9.9 (1.6) 313 10.1 (2.1) 267 9.7 (2.3) 0.01
6-11 1,387 11.1 (1.6) 726 13.4 (2.0) 661 8.6 (1.5) <0.01
12-18 1,451 9.1 (1.2) 757 12.5 (1.7) 694 5.4 (0.9) <0.01
19-29 1,546 5.0 (0.9) 687 7.6 (1.4) 859 2.2 (0.7) <0.01
30-39 2,141 4.1 (0.7) 899 5.6 (1.0) 1,242 2.5 (0.5) <0.01
40-49 2,203 6.7 (0.9) 946 8.9 (1.3) 1,257 4.5 (0.8) <0.01
50-59 1,853 15.0 (1.5) 798 16.5 (1.7) 1,055 13.5 (1.9) 0.16
60-69 1,791 22.5 (1.7) 778 20.9 (2.0) 1,013 24.0 (1.9) 0.16
≥70 1,537 35.2 (2.3) 626 33.2 (2.8) 911 36.4 (2.6) 0.26
Blepharoptosis was defined as a marginal reflex distance 1 of 2 mm or less.
No = number of participants; Prev = prevalence; SE = standard error.
males, 3.4 ± 1.4% in females), and it was higher in females than in males (p < 0.01). There were no significant differ- ences in relation to age (p > 0.05). The overall prevalence of esodeviation, exodeviation and vertical deviation was 0.2 ± 0.0%, 1.1 ± 0.1% and 0.3 ± 0.0%, respectively.
Blepharoptosis
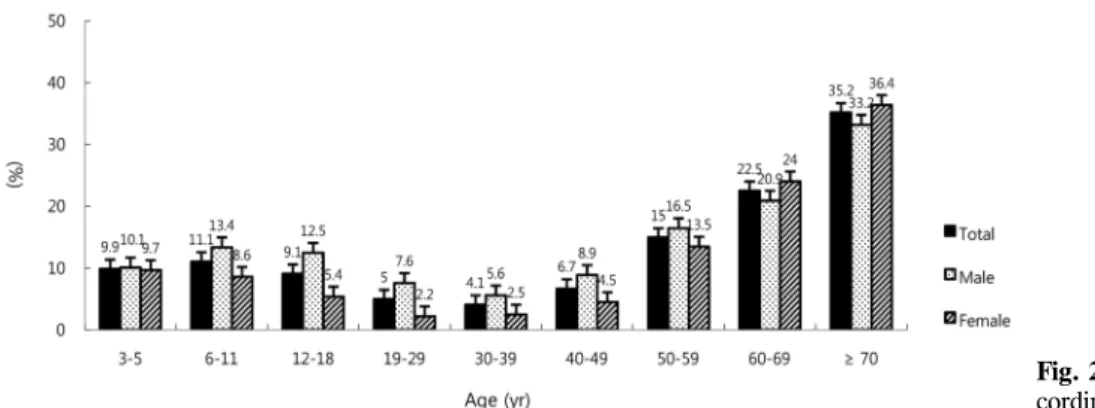
The overall prevalence of blepharoptosis was 11.0 ± 0.8%
(12.1 ± 0.9% in males, 10.0 ± 0.8% in females) (Table 5 and Fig. 2). The prevalence of blepharoptosis in participants over
Fig. 2. Prevalence of blepharoptosis ac- cording to age and gender.
Table 6. Prevalence of cataract according to age and gender
Age group (yr) Total Male Female
p-value
No Prev (%) SE No Prev (%) SE No Prev (%) SE
Total 11,037 24.1 (0.9) 4,718 21.9 (1.0) 6,319 26.2 (1.0) <0.01
19-29 1,542 1.1 (0.3) 685 0.9 (0.4) 857 1.3 (0.5) 0.49
30-39 2,137 2.5 (0.4) 898 2.8 (0.7) 1,239 2.2 (0.4) 0.34
40-49 2,198 10.3 (1.1) 943 10.6 (1.3) 1,255 10.0 (1.3) 0.66
50-59 1,850 33.8 (2.0) 797 35.1 (2.7) 1,053 32.5 (2.2) 0.31
60-69 1,785 69.4 (2.1) 774 67.4 (2.7) 1,011 71.2 (2.2) 0.12
≥70 1,525 93.7 (0.8) 621 90.9 (1.6) 904 95.4 (0.8) <0.01
Any cataract in at least one eye: pseudophakic and aphakic eyes were also included as cataract.
No = number of participants; Prev = prevalence; SE = standard error.
Fig. 3. Prevalence of cataract according to age and gender.
40 years of age was 16.2 ± 1.1%. From the age of 40, the prevalence of blepharoptosis was increased with age, and it was highest in the age group over 70 years (35.2 ± 2.3%, p <
0.01). The prevalence of blepharoptosis was higher in males than in females in participants from 6 to 49 years of age (p <
0.05).
Cataract
The prevalence of cataract in participants over 19 years of age was 24.1 ± 0.9% (21.9 ± 1.0% in males, 26.2 ± 1.0% in females) (Table 6 and Fig. 3), that in participants over 40 years of age was 40.2 ± 1.3% (37.5 ± 1.5% in males, 42.6 ± 1.3% in females), and that in participants over 60 years of age
was 80.5 ± 1.3% (76.9 ± 1.8% in males, 83.2 ± 1.3% in fe- males). These results indicate that prevalence of cataract tended to increase with age (p < 0.01). The prevalence of cat- aract in participants over 40 years of age was higher in fe- males than in males (p < 0.01).
Pterygium
The prevalence of pterygium in participants over 19 years of age was 5.4 ± 0.3% (6.1 ± 0.5% in males, 4.7 ± 0.3% in fe- males) (Table 7 and Fig. 4). The prevalence of pterygium in participants over 40 years of age was 8.9 ± 0.5% (10.1 ± 0.8% in males, 7.7 ± 0.5% in females), while that in partic- ipants over 60 years of age was 16.0 ± 0.8% (17.7 ± 1.3% in
Table 7. Prevalence of pterygium according to age and gender
Age group (yr) Total Male Female
p-value
No Prev (%) SE No Prev (%) SE No Prev (%) SE
Total 11,014 5.4 (0.3) 4,716 6.1 (0.5) 6,298 4.7 (0.3) <0.01
19-29 1,543 0.1 (0.1) 685 0.1 (0.1) 858 0.0 (0.0) -
30-39 2,130 0.9 (0.2) 896 1.5 (0.4) 1,234 0.3 (0.1) <0.01
40-49 2,192 3.9 (0.6) 943 5.0 (0.9) 1,249 2.8 (0.6) 0.03
50-59 1,845 7.2 (0.9) 797 9.6 (1.5) 1,048 4.8 (0.7) <0.01
60-69 1,780 13.6 (1.0) 773 14.9 (1.6) 1,007 12.5 (1.4) 0.07
≥70 1,524 18.9 (1.3) 622 21.8 (2.2) 902 17.1 (1.5) 0.07
No = number of participants; Prev = prevalence; SE = standard error.
Fig. 4. Prevalence of pterygium accord- ing to age and gender.
Table 8. Prevalence of age-related macular degeneration according to age and gender group Age
(yr)
Early AMD
p-value
Late AMD
p-value
Total Male Female Total Male Female
No Prev(%) SE No Prev(%) SE No Prev(%) SE No Prev(%) SE No Prev(%) SE No Prev(%) SE Total 6,453 5.1 (0.3) 2,737 5.2 (0.5) 3,716 5.0 (0.4) 0.76 6,453 0.5 (0.1) 2,737 0.6 (0.2) 3,716 0.4 (0.1) 0.19 40-49 2,071 1.6 (0.3) 885 1.9 (0.5) 1,186 1.2 (0.4) 0.23 2,071 0.3 (0.1) 885 0.5 (0.3) 1,186 0.0 (-) - 50-59 1,706 4.1 (0.5) 737 4.7 (0.9) 969 3.5 (0.6) 0.31 1,706 0.1 (0.1) 737 0.2 (0.2) 969 0.0 (-) 0.14 60-69 1,527 8.8 (0.9) 660 9.6 (1.4) 867 8.1 (1.1) 0.42 1,527 0.9 (0.3) 660 0.8 (0.3) 867 0.9 (0.5) 0.84
≥70 1,149 13.6 (1.2) 455 13.3 (1.8) 694 13.8 (1.5) 0.82 1,149 1.5 (0.4) 455 1.9 (0.7) 694 1.3 (0.4) 0.38 Patients were defined as having early AMD if they met any one of the following criteria: 1) the presence of soft indistinct drusen or reticular drusen or, 2) the presence of hard or soft distinct drusen with pigmentary abnormalities (increased pigmentation or hypopigmentation of the retinal pigment epithelium) in the absence of signs of late AMD.
AMD = age-relaged macular degeneration; No. = numberof participants; Prev = prevalence; SE = standard error.
Fig. 5. Prevalence of early and late age-related macular degeneration ac- cording to age and gender.
males, 14.8 ± 1.1% in females). The prevalence of pterygium increased with age (p < 0.01). The prevalence of pterygium
in participants over 40 years of age was higher in males than females (p < 0.01).
Table 9. Prevalence of diabetic retinopathy in persons with diabetes mellitus according to age and gender
Age group (yr) Total Male Female
p-value
No Prev (%) SE No Prev (%) SE No Prev (%) SE
Total 746 13.4 (1.5) 352 12.0 (1.9) 394 15.1 (2.2) 0.27
19-29 8 - - 3 - - 5 - -
30-39 33 - - 14 - - 19 - -
40-49 100 12.4 (3.6) 59 12.9 (5.0) 41 11.5 (5.1) 0.85
50-59 160 10.2 (2.6) 83 7.6 (2.8) 77 14.6 (5.2) 0.21
60-69 269 18.0 (2.8) 127 20.8 (4.2) 142 15.2 (3.2) 0.26
≥70 176 12.3 (3.1) 66 7.5 (3.6) 110 14.6 (4.3) 0.23
Diabetic retinopathy was defined as the presence of 1 or more retinal microaneurysm or retinal blot hemorrhages with or without more severe lesions (hard exudates, soft exudates, intraretinal microvascular abnormalities, venous bleeding, retinal new vessels, and fibroproliferations).
No = number of participants; Prev = prevalence; SE = standard error.
Fig. 6. Prevalence of diabetic retinop- athy in persons with diabetes mellitus ac- cording to age and gender.
Age-related macular degeneration
The overall prevalence of early AMD over 40 years of age was 5.1 ± 0.3% (5.2 ± 0.5% in males, 5.0 ± 0.4% in females) (Table 8 and Fig. 5). The prevalence of early AMD in partic- ipants over 60 years of age was 10.9 ± 0.7% (10.9 ± 1.2% in males, 10.8 ± 0.9% in females). The overall prevalence of late AMD over 40 years of age was 0.5 ± 0.1% (0.6 ± 0.2% in males, 0.4 ± 0.1% in females). The prevalence of late AMD in participants over 60 years of age was 1.1 ± 0.2% (1.2 ± 0.3% in males, 1.1 ± 0.3% in females). The prevalence of AMD increased with age (p < 0.01). There were no statisti- cally significant differences in relation to gender (p > 0.05).
Diabetic retinopathy
The prevalence of diabetic retinopathy in participants over 19 years of age was 13.4 ± 1.5% (12.0 ± 1.9% in males, 15.1
± 2.2% in females) (Table 9 and Fig. 6). The prevalence of di- abetic retinopathy in participants over 40 years of age was 13.4 ± 1.5% (12.6 ± 2.0% in males, 14.3 ± 2.3% in females) (Table 9). The prevalence of diabetic retinopathy in partic- ipants over 65 years of age was 13.1 ± 2.4% (11.0 ± 3.0% in males, 14.5 ± 3.4% in females). There were no statistically significant differences in the prevalence of diabetic retinop- athy in relation to age or gender (p > 0.05).
Glaucoma
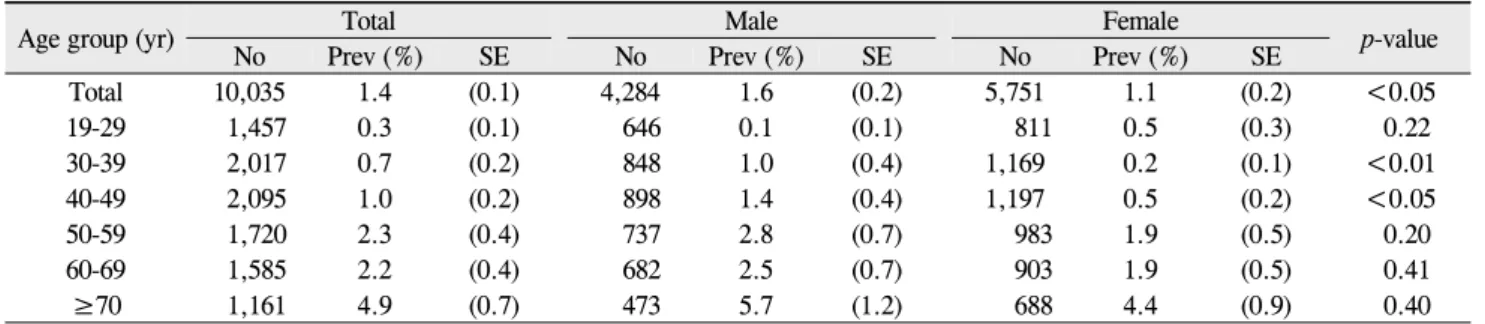
The prevalence of glaucoma in participants over 19 years of age was 1.4 ± 0.1% (1.6 ± 0.2% in males, 1.1 ± 0.2% in fe- males) (Table 10 and Fig. 7) and was higher in males than in females (p < 0.05). The prevalence of glaucoma in partic- ipants over 40 years of age was 2.1 ± 0.2% (2.5 ± 0.3% in males, 1.7 ± 0.2% in females). The prevalence of glaucoma in participants over 60 years of age was 3.3 ± 0.4% (3.7 ± 0.6% in males, 3.0 ± 0.5% in females). In participants over 40 years of age, the prevalence of POAG, PACG and NTG was 2.0 ± 0.2%, 0.1 ± 0.1% and 1.9 ± 0.2%, respectively. The prevalence of glaucoma increased with age (p < 0.01). The prevalence of glaucoma was higher in males than in females in participants aged 30 to 49 (p < 0.05).
Discussion
In the past two decades, several epidemiologic studies have reported on the prevalence of common eye diseases in many countries [2-35,42,43,45-65]. Most of these population-based studies have been conducted in the United States among pre- dominantly White, mixed White and African-American, or Hispanic populations [5-14]or in other countries, including Europe [15-17]and Australia [18-21]. There are a growing number of new population-based studies in Asia, including
Table 10. Prevalence of glaucoma according to age and gender
Age group (yr) Total Male Female
p-value
No Prev (%) SE No Prev (%) SE No Prev (%) SE
Total 10,035 1.4 (0.1) 4,284 1.6 (0.2) 5,751 1.1 (0.2) <0.05
19-29 1,457 0.3 (0.1) 646 0.1 (0.1) 811 0.5 (0.3) 0.22
30-39 2,017 0.7 (0.2) 848 1.0 (0.4) 1,169 0.2 (0.1) <0.01
40-49 2,095 1.0 (0.2) 898 1.4 (0.4) 1,197 0.5 (0.2) <0.05
50-59 1,720 2.3 (0.4) 737 2.8 (0.7) 983 1.9 (0.5) 0.20
60-69 1,585 2.2 (0.4) 682 2.5 (0.7) 903 1.9 (0.5) 0.41
≥70 1,161 4.9 (0.7) 473 5.7 (1.2) 688 4.4 (0.9) 0.40
No = number of participants; Prev = prevalence; SE = standard error.
Fig. 7. Prevalence of glaucoma accord- ing to age and gender.
Japan [22-26,48,56], Singapore [27-30],China [31-35,46]
and Taiwan [61,62]. However, even within a single Asian country, significant racial/ethnic variations may exist. The present study is the first investigating the prevalence of eye diseases in South Korea based on nationally representative data.
The 10th Revision of the World Health Organization International Statistical Classification of Diseases, Injuries and Causes of Death defines visual impairment as a BCVA less than 20 / 60 but 20 / 400 or better in the best eye, and blindness is defined as a BCVA of worse than 20 / 400 in the best eye. The United States criteria define visual impairment as a BCVA of less than 20 / 40 but better than 20 / 200, and blindness as a BCVA of 20 / 200 or worse. Using the United States standard, the prevalence of visual impairment was 0.97% to 2.34% in White Americans over 40 years of age [10]and 5.3% in African Americans over 65 years of age [8].
In a Japanese population of subjects over 40 years of age, the prevalence of visual impairment and blindness were 1.28%
and 0.15%, respectively [25]. The prevalence of visual im- pairment and blindness in China was reported as 1.1 % and 0.3 %, respectively, in subjects over 40 years of age, accord- ing to the World Health Organization definition [31]. In our study, when we defined visual impairment and blindness as a BCVA of 0.32 or worse and 0.01 or worse, respectively, the prevalence of visual impairment and blindness in the subjects over 40 years of age was 0.9% and 0.1%, respectively, sim- ilar to the prevalence reported from China.
The prevalence of myopia has been reported as 25% in Western Europe [45], 26% in the United States [45],38%
among Chinese individuals [46], and 41% to 43 % in Japan [47,48]. In the present study, the prevalence of myopia in adult Koreans over 40 years of age was 35.7%, which was higher than those of Western Europe and United States and similar to those reported in China and Japan. Changes in the prevalence and value of refractive errors do occur with age starting in childhood [49]. Many studies have reported a de- crease of the prevalence of myopia and a simultaneous in- crease in the prevalence of hyperopia with increasing age [50-52]. Results of our study were in agreement with those findings.
In this study, the overall prevalence of strabismus in the 3 to 5 and 6 to 11 year age groups was 1.8% in South Korea.
The prevalence of strabismus has been reported as 2.3% in subjects 2 to 5 years of age in the United Kingdom [53],3.1%
in subjects 4 to 7 years of age in the United States [54], 2.7%
in subjects under the age of 7 years in Sweden [55],and 1.3%
in subjects 6 to 12 years of age in Japan [56].There is a sig- nificant ethnic component influencing the distribution of strabismus: Studies in Asian populations have reported an esotropia to exotropia ratio of less than 1, while in European populations, the ratio was greater than 1 [53-56]. Our study demonstrated an esotropia to exotropia ratio of less than 1, similar to results from other Asian countries [56].
Blepharoptosis, drooping of the upper eyelid, is one of the most common upper eyelid diseases. Symptoms relate to im-
pairment of the superior visual field and central vision in se- vere cases. Even though blepharoptosis is generally known to exist below 4 to 5 mm of MRD1 in Western populations, there are no accurate definitions and available data on the prevalence of blepharoptosis, particularly among Asians.
Except for Nigeria, the prevalence of blepharoptosis has not been reported. In the Nigeria study, blepharoptosis was de- fined as the amount of the cornea covered by more than 2 mm by the upper eyelid, and the prevalence of blepharoptosis among school children under the age of 16 years was 1.2%
[57]. There are no accurate diagnostic criteria about blephar- optosis for Asian or Korean populations. However, depend- ing on race, there are many differences in facial anatomy.
Therefore, we defined blepharoptosis as less than 2 mm of MRD1 with consideration for anatomical differences of the eyelids and orbit. In our study, the prevalence of blephar- optosis in the 3 to 5, 6 to 11 and 12 to 18 age groups were 9.9%, 11.1% and 9.1%, respectively, higher than prevalences reported in Nigeria. One of the main objectives of this study is to estimate the prevalence of blepharoptosis in Koreans. In future studies, appropriate diagnostic criteria should be es- tablished for use in Korean people.
The prevalence of cataract has been reported as 22.3% in the United States [29], 40.4% in Myanmar [55] and 35.0% in China [28]. In the present study, the prevalence of cataract in adult Korean over 40 years of age was 40.2%. The preva- lence of cataract was similar to those reported in Myanmar and China, where no statistically significant differences in prevalence were observed in relation to gender. However, in the United States and Korea, females showed a significantly higher prevalence of cataract than males.
Several population-based studies have examined the prev- alence of pterygium and have indicated a prevalence ranging from 1.2% in a White population in urban Australia [21]to 33.0% in a Chinese population of subjects 50 years or older in Doumen County, Southern China [58]. In our study, the prevalence of pterygium in subjects over 40 years of age was 8.9%. Differences in prevalence of pterygium were observed among these studies. However, dominance in male gender and old age associated with formation of pterygium were similar to those observed in other studies.
Large-scale population-based studies have been conducted over the past two decades in order to identify the prevalence and risk factors of AMD [2,6,12,15-19,26,32,60]. Studies have demonstrated variations in the prevalence and risk fac- tors of AMD. In the Blue Mountains Eye Study, the preva- lence of early AMD was 8.7%, and the prevalence of late AMD was 1.1% [19]. In the Beijing Eye Study, the preva- lence of early AMD and late AMD was 5.1% and 0.3%, re- spectively [32].In addition, the prevalence of early AMD and late AMD was 3.5% and 0.5% in the Funagata Study [26]. In the present study, the prevalence of early AMD and late AMD was 5.1% and 0.5%, respectively. Our study showed a low prevalence of AMD compared to those in White populations. In addition, the prevalence of AMD in
our study was similar to those of Chinese and Japanese populations.
The prevalence of diabetic retinopathy in the United States was reported as 28.5% to 40.3% [13,14]. There are many population-based data on the prevalence of diabetic retinop- athy in Asia [61-63]. In Taiwan, 35% of 527 diabetic subjects over 40 years of age had diabetic retinopathy based on clinical examination [61].However, recent studies in India indicate a much lower prevalence of diabetic retinopathy [62,63]. In the present study, the prevalence of diabetic retinopathy (subjects over 40 years of age) was 13.4%, much lower than the prevalence reported in the United States or Taiwan. This relatively low prevalence of diabetic retinopathy may be due to a short duration of diabetes in our study population.
Glaucoma is believed to be the leading global cause of sur- gically irremediable blindness [64]. In the Baltimore Eye Survey, the prevalence of POAG was approximately four times higher in black people (4% to 5%) than in white people (1.1%) [65]. In recent years, several studies have been con- ducted on the epidemiology of glaucoma in Asian people [22-24,27,66]. The prevalence ranges of POAG and PACG have been reported as 1.6% to 3.9% and 0.4% to 1.0%, respectively.In this study, the prevalence of POAG and PACG was 2.0% and 0.1%. The prevalence of POAG was similar to those reported in other Asian countries [22-24,27,66].In con- trast, the prevalence of PACG was lower than those reported in other Asian countries [22-24,27,66]. Results of this study might have been underestimated as only the Van Herick method was used in the diagnosis of PACG.
Accurate epidemiological information may contribute to the proper delivery of health care, preventive screenings, and rehabilitative services to individuals with eye diseases. This study provides standardized protocols for examination of oc- ular diseases and improvement of ocular examination ca- pacity through education and quality control. Databases con- taining results from examination of eye diseases and results of quality control can be utilized in future clinical studies. In addition, methodology used in this survey can be utilized as a guideline for use in new population-based studies which will be performed in the nation.
In summary, our nation-wide study demonstrated the prev- alence of major eye diseases and potential ocular dis- ease-vulnerable groups in Korea. To the best of our knowl- edge, this is the first nation-wide epidemiologic study con- ducted by both the Ophthalmologic Society and the CDC and is a powerful tool for use in investigation of the national prevalence of disease conditions. Further studies are needed using on-going surveys in order to better understand the etio- logic or risk factors that may be associated with ophthalmo- logic diseases and to evaluate proper interventions aimed at prevention of disease-related disabilities.
Conflict of Interest
No potential conflict of interest relevant to this article was
reported.
References
1. Congdon NG, Friedman DS, Lietman T. Important causes of visual impairment in the world today. JAMA 2003;290:2057-60.
2. Song SJ, Youm DJ, Chang Y, Yu HG. Age-related macular de- generation in a screened South Korean population: preva- lence, risk factors, and subtypes. Ophthalmic Epidemiol 2009;16:304-10.
3. Kim JH, Kang SY, Kim NR, et al. Prevalence and character- istics of glaucoma among Korean adults. Korean J Ophthalmol 2011;25:110-5.
4. Kim H, Joo CK. The prevalence and demographic character- istics of anterior polar cataract in a hospital-based study in Korea. Korean J Ophthalmol 2008;22:77-80.
5. Klein R, Klein BE, Lee KE, et al. Changes in visual acuity in a population over a 10-year period: the Beaver Dam Eye Study. Ophthalmology 2001;108:1757-66.
6. Klein R, Klein BE, Linton KL. Prevalence of age-related maculopathy. The Beaver Dam Eye Study. Ophthalmology 1992;99:933-43.
7. Rahmani B, Tielsch JM, Katz J, et al. The cause-specific prev- alence of visual impairment in an urban population. The Baltimore Eye Survey. Ophthalmology 1996;103:1721-6.
8. Munoz B, West SK, Rubin GS, et al. Causes of blindness and visual impairment in a population of older Americans: the Salisbury Eye Evaluation Study. Arch Ophthalmol 2000;118:
819-25.
9. Varma R, Paz SH, Azen SP, et al. The Los Angeles Latino Eye Study: design, methods, and baseline data. Ophthalmology 2004;111:1121-31.
10. Congdon N, O'Colmain B, Klaver CC, et al. Causes and prev- alence of visual impairment among adults in the United States. Arch Ophthalmol 2004;122:477-85.
11. Congdon N, Vingerling JR, Klein BE, et al. Prevalence of cat- aract and pseudophakia/aphakia among adults in the United States. Arch Ophthalmol 2004;122:487-94.
12. Friedman DS, O'Colmain BJ, Muin BE, et al. Prevalence of cataract and pseudophakia/aphakia among adults in the United States. Arch Ophthalmol 2004;122:564-72.
13. Kempen JH, O'Colmain BJ, Leske MC, et al. The prevalence of diabetic retinopathy among adults in the United States.
Arch Ophthalmol 2004;122:552-63.
14. Zhang X, Saaddine JB, Chou CF, et al. Prevalence of diabetic retinopathy in the United States, 2005-2008. JAMA 2010;304:
649-56.
15. Vingerling JR, Hofman A, Grobbee DE, de Jong PT. Age-re- lated macular degeneration and smoking. The Rotterdam Study. Arch Ophthalmol 1996;114:1193-6.
16. Buch H, Vinding T, la Cour M, et al. Risk factors for age-re- lated maculopathy in a 14-year follow-up study: the Copenhagen City Eye Study. Acta Ophthalmol Scand 2005;
83:409-18.
17. Buch H, Nielsen NV, Vinding T, et al. 14-Year incidence, pro- gression, and visual morbidity of age-related maculopathy:
the Copenhagen City Eye Study. Ophthalmology 2005;112:
787-98.
18. Mitchell P, Wang JJ, Smith W, Leeder SR. Smoking and the 5-year incidence of age-related maculopathy: the Blue Mountains Eye Study. Arch Ophthalmol 2002;120:1357-63.
19. Mitchell P, Wang JJ, Foran S, Smith W. Five-year incidence of age-related maculopathy lesions: the Blue Mountains Eye Study. Ophthalmology 2002;109:1092-7.
20. Livingston PM, Carson CA, Stanislavsky YL, et al. Methods
for a population-based study of eye disease: the Melbourne Visual Impairment Project. Ophthalmic Epidemiol 1994;1:
139-48.
21. McCarty CA, Fu CL, Taylor HR. Epidemiology of pterygium in Victoria, Australia. Br J Ophthalmol 2000;84:289-92.
22. Yamamoto T, Iwase A, Araie M, et al. The Tajimi Study report 2: prevalence of primary angle closure and secondary glauco- ma in a Japanese population. Ophthalmology 2005;112:1661-9.
23. Iwase A, Suzuki Y, Araie M, et al. The prevalence of primary open-angle glaucoma in Japanese: the Tajimi Study. Ophthalmology 2004;111:1641-8.
24. Miyazaki M, Kubota T, Kubo M, et al. The prevalence of pseudoexfoliation syndrome in a Japanese population: the Hisayama Study. J Glaucoma 2005;14:482-4.
25. Yamada M, Hiratsuka Y, Roberts CB, et al. Prevalence of vis- ual impairment in the adult Japanese population by cause and severity and future projections. Ophthalmic Epidemiol 2010;
17:50-7.
26. Kawasaki R, Wang JJ, Ji GJ, et al. Prevalence and risk factors for age-related macular degeneration in an adult Japanese population: the Funagata Study. Ophthalmology 2008;115:
1376-81, 1381.e1-2.
27. Foster PJ, Oen FT, Machin D, et al. The prevalence of glauco- ma in Chinese residents of Singapore: a cross-sectional pop- ulation survey of the Tanjong Pagar district. Arch Ophthalmol 2000;118:1105-11.
28. Seah SK, Wong TY, Foster PJ, et al. Prevalence of lens opac- ity in Chinese residents of Singapore: the tanjong pagar survey. Ophthalmology 2002;109:2058-64.
29. Lamoureux EL, Chong E, Wang JJ, et al. Visual impairment, causes of vision loss, and falls: the singapore malay eye study.
Invest Ophthalmol Vis Sci 2008;49:528-33.
30. Foong AW, Saw SM, Loo JL, et al. Rationale and method- ology for a population-based study of eye diseases in Malay people: The Singapore Malay eye study (SiMES). Ophthalmic Epidemiol 2007;14:25-35.
31. Xu L, Wang Y, Li Y, et al. Causes of blindness and visual im- pairment in urban and rural areas in Beijing: the Beijing Eye Study. Ophthalmology 2006;113:1134.e1-11.
32. Li Y, Xu L, Jonas JB, et al. Prevalence of age-related macul- opathy in the adult population in China: the Beijing Eye Study. Am J Ophthalmol 2006;142:788-93.
33. Xu L, Li Y, Wang S, et al. Characteristics of highly myopic eyes: the Beijing Eye Study. Ophthalmology 2007;114:121-6.
34. You Q, Xu L, Jonas JB. Prevalence and associations of epi- retinal membranes in adult Chinese: the Beijing Eye Study.
Eye (Lond) 2008;22:874-9.
35. Liang YB, Friedman DS, Wong TY, et al. Rationale, design, methodology, and baseline data of a population-based study in rural China: the Handan Eye Study. Ophthalmic Epidemiol 2009;16:115-27.
36. Jin YH. A new logMAR vision chart: Jin’s Vision Chart. J Korean Ophthalmol Soc 1997;38:2036-44.
37. Van Herick W, Shaffer RN, Schwartz A. Estimation of width of angle of anterior chamber. Incidence and significance of the narrow angle. Am J Ophthalmol 1969;68:626-9.
38. Tan DT, Chee SP, Dear KB, Lim AS. Effect of pterygium mor- phology on pterygium recurrence in a controlled trial compar- ing conjunctival autografting with bare sclera excision. Arch Ophthalmol 1997;115:1235-40.
39. Bird AC, Bressler NM, Bressler SB, et al. An international classification and grading system for age-related maculop- athy and age-related macular degeneration. The International ARM Epidemiological Study Group. Surv Ophthalmol 1995;
39:367-74.
40. Diabetic Retinopathy Study Coordinating Center. Diabetic