A Fusion Study on the Relationship between Lifestyle and Vitamin D Deficiency in Korean Adults
You-Hyun Joung1, Hyun Yoon2, Hyun-Ho Sung3*
1Medical Technologist, Department of Clinical Laboratory Medicine, Dongsuwon General Hospital
2Professor, Department of Clinical Laboratory Science, Wonkwang Health Science University
3Professor, Department of Clinical Laboratory Science, Dongnam Health University
한국 성인에서 생활습관과 비타민 D 결핍 관계 융합 연구
정유현1, 윤현2, 성현호3*
1동수원병원 진단검사의학과 임상병리사, 2원광보건대학교 임상병리과 교수, 3동남보건대학교 임상병리과 교수
Abstract This study aims to find out the causal factors associated with vitamin D levels of Koreans after research. The data used in the study by KNHANES Ⅵ-2. Cross-analysis was performed to find factors related to serum vitamin D and relative risk was assessed by logistic regression. The estimated summary Odds ratio of groups under 40 was 4.1, Spring and Winter was 4.2, of region was 2.1, of Smoker was 1.8, of not supplementation intake was 2.1, and of sedentary lifestyle 1.1 in male group. And the estimated summary OR of group under 40 was 1.9, of occupation was 4.5, of not supplementation intake was 3.0 in female group. Different results by gender are thought to be related to lifestyle and behavior.
It is considered that supplementation intake and outdoor activities should be increased as an important means to recover. It is expected to be used as basic data for preventing disease of Koreans and to conduct further experimental research.
Key Words : Outdoor activities, Sedentary lifestyle, Supplementation intake, Vitamin D, Convergence 요 약 이 연구는 한국인의 비타민 D 수준에 관련된 요인들을 조사 후 인과 관계를 알아보는 것을 목적으로 하였다.
연구 자료로 국민건강영양조사 제6기 2014년도에서 연구요인을 가진 1,977명을 대상으로 하였다. 혈청 Vitamin D와 관련된 요인들을 찾기 위하여 교차 분석을 하였고, 통제변수 통제 로지스틱 회귀분석으로 상대위험도를 평가하였다.
남성은 40세 미만(OR 4.1), 봄‧겨울(OR 4.2, 도시거주(OR 2.1), 흡연자(OR 1.8), 보충제 미복용(OR 2.1), 긴 좌식생활 시간일수록 위험도가 높았다(OR 1.1). 여성은 40세 미만(OR 1.9), 실내직종(OR 4.5), 보충제 미복용(OR 3.0)의 비교 위험도가 유의하게 높아 남성과 다르게 관찰되었다. 성별 비교위험도가 다르게 관찰된 이유로 성별에 따른 건강행위의 차이로 판단된다. 연구 결과 한국인의 Vitamin D 는 결핍으로 관찰되었으며, 주요한 중재수단으로 Vitamin D가 함유 된 보충제의 복용과 야외활동을 늘려야 할 것으로 판단된다. 한국인의 질병예방에 기초자료로 이용과 향후 실험연구가 진행될 것으로 기대된다.
주제어 : 야외 활동, 좌식 생활, 보충제 복용, 비타민 D, 융합
*Corresponding Author : Hyun-Ho Sung([email protected]) Received September 26, 2019
Accepted December 20, 2019 Revised November 4, 2019 Published December 28, 2019
1. INTRODUCTION
Vitamin D is the sunshine vitamin which is a lip soluble molecule got through exposure to sunlight and intake of foods containing this nutrient naturally. The urbanization of modern society are in many cases having a job working in the room, because of the lifestyle center of the room there is little opportunity to be exposed to UV rays is essential for the synthesis of Viatamin D. Therefore, the aim of this study was to investigate various factors such as daylight irradiation, vitamin D fortified food intake, and environmental impact.
During exposure to sunlight 7-dehydrocholesterol in the skin absorbs ultraviolet B radiation converting it to previtamin D3[1]. In addition, Vitamin D is contribute for the development and maintenance of Bone formation, as well as for calcium and phosphate homeostasis through coordinate effects on the kidney[2]. Vitamin D have to be hydroxylated on carbon 25, forming 25-hydroxy Vitamin D in the liver, and after that on carbon 1, forming 1, 25-dihydroxyvitamin in the kidney[3]. In addition to its importance for bone health, recent studies suggests that Vitamin D is also an important in promoting cardiovascular health and preventing chronic diseases, diabetes mellitus, autoimmune disorders, and various cancers[4,5].
Vitamin D is that about 80% of a very rough general estimate supply comes from UV-B induced production in the skin and about 20%
from dietary intake, but this differences considerably depending on factors season, sun exposure habits, latitude, nutrition, supplement intake or ethnicity[6,7]. Therefore, Vitamin D study of the deficit in factors, such as gender, age, season, region, type of residence, education level, occupation, etc, variable much of that variables controled the lifestyle like health behavior, BMI, walking, drinking, smoking, supplements, sedentary lifestyle, etc is necessary
and should be complemented with evaluation of the efficacy of possible interventions. The aim of this study was to evaluate the Vitamin D deficiency status in korean in relation to the health behavior discipline and to analysis the difference of lifestyle control variable.
2. MATERIAL AND METHODS
The data of this study was conducted after agree with the raw data usage procedure on the homepage of Korean National Health and Welfare (KNHANES)[8].
This study was used data from the KNHANES VI-2, 2014 (approval number: 2013-12EX-03-03-C).
In addition, this study was exempted from deliberation in the Institutional Review Board of Ajou University Medical Center(Approved number: AJIRB-MED-EXP-17-426).
2.1 Study population
The KNHANES VI-2 (2014) was performed from January 2013 to December 2013. In the KNHANES VI-2 (2014), 7,550 individuals over age 20 adult men and women were sampled who completed questionnaires such as health questionnaire, examin on, and dietary survey.
Among them, 1,977 subjects with Vitamin D test were selected. The reason for limiting the study to adults over 20 years of age was that subjects under 20 years of age have higher Vitamin D levels than other age groups, and the average difference by age was severe. The cause of this problem is not clear, but the general characteristics of daily life such as the difference in class time and academic stress and the pattern of health behavior are different from those over 20 years of age. This is because Korean standard occupation classification may be included unemployed in the reclassification process, which may confuse the analysis[9].
2.2 Serum 25(OH)D
The health behavior survey used findings related to drinking, smoking, walking, sedentary lifestyle, and supplementation during the health survey of the KNHANES VI-2 (2014). Among the various forms of Vitamin D in the body, 25-hydroxyvitamin D (25(OH)D) is the most stable and most effective form[10]. Serum levels of 25(OH)D were measured with a radioimmunoassay (25-hydroxy-vitamin D 125I RIA Kit; DiaSorin, Stillwater, MN) using a 1470 Wizard Gamma Counter (PerkinElmer, Turku, Finland) in Neodin medical research institute. Serum 25(OH)D was classified as vitamin D deficiency 25(OH)D<20 ng/mL or Vitamin D optimal 25(OH)D≥20 ng/mL.
This is due to Thacher's splitting into optimal three sections when the concentration of 25(OH)D in the blood is less than 10 ng/mL deficient, 10-20 ng/mL insufficient, and more than 20 ng/mL[11]. The clinical target level was 30-60 ng/mL, and more than 150 ng/mL was the level that can cause Vitamin D intoxication[12].
2.3 Questionnaire
The health behavior survey used findings related to drinking, smoking, walking, sedentary lifestyle, and supplementation during the health survey of the KNHANES VI-2 (2014). The seasons were operationally classified as March-May in spring, Jun e-August in summer, September-November in autumn, and December-February in reference to previous studies such as Na etc[9]. The districts were divided into -Dong, -Eup, -Myeon, with the -Dong as the city and the -Eup and the -Myeon as rural areas by manipulation. The dwelling type was divided into general houses an d apartments. For the education level, the education reclassification code(Graduation is the current status of education, and completion, dropout, attendance, and leave of absence are immediately preceding) was used, and it was divided into three levels: elementary school,
middle school, high school, and college graduate.
Occupations were reclassified into Korean Standard Occupation Classifications, except for soldiers, and divided into seven stages: management, specialist, office worker, service and sales, agriculture, forestry and fisheries, skilled workers, simple laborers, and unemployment. Sedentary life was usually spent a day (except when you sleep), when you are at work or at home (TV watching, using the Internet, listening to music, playing cards, etc.), when you move places (cars, buses, etc.) When you sit or lie down, it was defined as operational. The question of whether or not to take the supplement (Nutrition Supplement, Health Supplement, oriental medicine) was " yes" if the supplement was taken more than two weeks in the past year, or "no" if not.
2.4 Statistical analyses
All statistical analyses were performed using SPSS, PC, and Version 19.0 (SPSS, Chicago, USA) program for windows. All analyzes used a composite sample analysis method, which is recommended by the KNHANES VI-2 (2014). for results without bi as in the representation of the samples and estimates. The weights reflected in the research analysis were largely analyzed by the unit of household, which is calculated by estimating the weights, floors, and colonies (survey area) in the estimation of the mean and variance. However, due to the difference in the number of participants in each survey sector, separate weights were used for each survey sector to use the weights of the health questionnaire and examination. The distributions of the participant characteristics, health behaviors, and seasons were converted into percentages, frequency and the successive data were presented as averages with standard deviations. In order to test the difference between Vitamin D level and each variable, the complex samples for chi-square
Variable Category Total Male Female M+SD
Age (year) (N=1,977)
20-29 353 (17.86) 151 (42.78) 202 (50.22) 30-39 407 (20.59) 202 (49.63) 205 (50.37) 40-49 407 (20.59) 201 (49.39) 206 (50.61) 50-59 408 (20.64) 195 (49.79) 213 (52.21) 60< 402 (20.32) 200 (49.75) 202 (50.25) Region
(N=1,977) City 1,635 (82.70) 771 (47.16) 864 (52.84) Rural 342 (17.30) 178 (52.05) 164 (47.95) Dwelling type
(N=1,977) General house 992 (50.18) 482 (48.59) 510 (51.41) Apartment 985 (49.82) 467 (47.41) 518 (52.59) Education
(N=1,793)
Middle school 456 (25.43) 182 (39.91) 274 (60.09) High school 679 (37.87) 322 (47.42) 357 (52.58) University 658 (36.70) 341 (51.82) 317 (48.18)
Occupation (N=1,789)
Management,
specialist 277 (15.48) 147 (53.07) 130 (46.93) Office worker 203 (11.35) 120 (59.11) 83 (40.89) service and
sales 239 (13.36) 86 (35.98) 153 (64.02) Agriculture,
fisher 74 (4.14) 50 (67.57) 24 (32.43) Skilled worker 216 (12.07) 180 (83.33) 36 (16.67) Simple laborer 153 (8.55) 74 (48.37) 79 (51.63) Unemployment 627 (35.05) 185 (29.51) 442 (70.49) Abbreviation: BMI, body mass index; SBP, systolic blood pressure; DBP, diastolic blood pressure; PP, pulse pressure
Table 1. General characteristics of subjects
was conducted. The average difference in serum 25(OH)D for various variables was calculated using an analysis of ANOVA. Furthermore, a logistic regression analysis was performed on the odds ratio (OR) values of the Vitamin D deficiency 25(OH)D<20 ng/mL. All statistical significance level was presented as proportions and mean with 95% confidence intervals (set as P<0.05).
3. Results
3.1 General characteristics of subjects
The subjects included in this study were 1,977 (949 males and 1,028 females) in age, region, dwelling type. The education levels were 1,793 (845 males and 948 females) and the occupational classification were 1,789 (842 males and 947 females) by subjects. The age distribution of study subjects was 17.86% in 20s, 20.59% in 30s, 20.59% in 40s, 20.64% in 50s, and 20.32% at ages over 60. The region types were 82.70% in urban areas and 17.30% in rural areas. The dwelling type 50.18% were general houses and 49.82%were apartments. The education level was 25.43%
for middle school and below, 37.87% for high school and 36.70% for university and above. The occupation types were managers and specialist 15.48%, office workers 11.35%, service and sales 13.36%, agriculture and fisher 4.14%, skilled workers 12.07%, simple laborers 8.55% and unemployed 35.05%. The characteristics of the subjects are shown in Table 1.
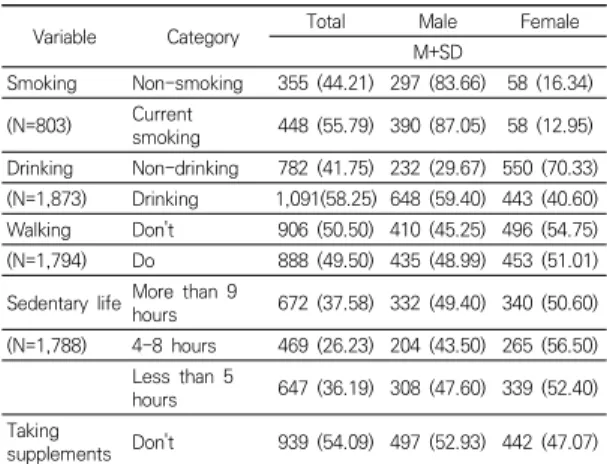
3.2 Health behavior characteristics of subjects
In Table 2, health behavioral characteristics of the subjects were presented in Table 2. The smoking status was 44.21% of non-smokers, 55.79% of current smokers, 83.66% for male non-smokers, 87.05% for male smokers, 16.34%for female non-smokers, and 12.95% for female smokers. The drinking status was 41.75% for non-drinking and 58.25% for drinking, 29.67% for male non-drinking, 59.40% for male drinking, 70.33% for female non-drinking and 40.60% for female drinking. The state of walking habits was
"Don't" 50.05%, "Do" 49.50%, in males "Don't"
45.25%, "Do" 48.99%, in females "Don't" 54.75%,
"Do" 51.01%. Supplemental status was 54.09% for
“Don't” and 45.91% for “Do”. Among them, male taking was 52.93% of "Don't", 38.52% of "Do", and 47.07% of "Don't" and 61.48% of "Do".
Variable Category Total Male Female
M+SD
Smoking Non-smoking 355 (44.21) 297 (83.66) 58 (16.34) (N=803) Current
smoking 448 (55.79) 390 (87.05) 58 (12.95) Drinking Non-drinking 782 (41.75) 232 (29.67) 550 (70.33) (N=1,873) Drinking 1,091(58.25) 648 (59.40) 443 (40.60) Walking Don't 906 (50.50) 410 (45.25) 496 (54.75) (N=1,794) Do 888 (49.50) 435 (48.99) 453 (51.01) Sedentary life More than 9 hours 672 (37.58) 332 (49.40) 340 (50.60) (N=1,788) 4-8 hours 469 (26.23) 204 (43.50) 265 (56.50)
Less than 5
hours 647 (36.19) 308 (47.60) 339 (52.40) Taking
supplements Don't 939 (54.09) 497 (52.93) 442 (47.07) Abbreviation: TG, triglyceride; TC, total cholesterol; HDL, high-density lipoprotein cholesterol; LDL, low-density lipoprotein cholesterol.
Table 2. Health behavior characteristics of subjects
3.3 Distribution of serum Vitamin D levels in subjects
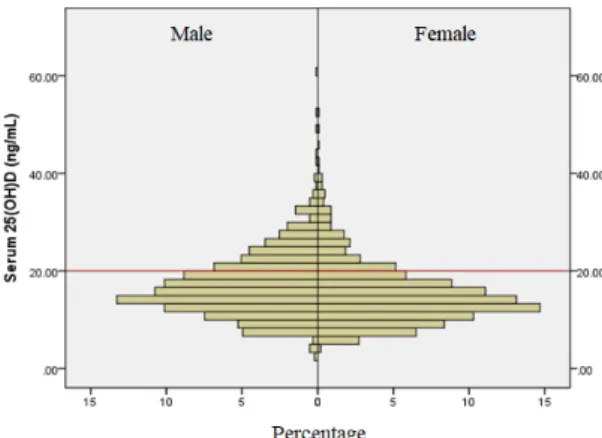
In Fig. 1, vitamin D distribution was 60.5 ng/mL in maximum value, 2.0 ng/mL in minimum value, and 16.1 ng/mL in median value in men. Females were found to be low in women with a maximum value of 51.9 ng/mL, a minimum value of 4.9 ng/mL, and a median value of 14.4 ng/mL. When the vitamin D concentration was set to deficiency of less than 20.0 ng / mL, 72.3% in males and 81.3% in females showed higher deficiency rate than males. In Fig. 2, the average blood vitamin D concentration by age group showed 13.9 ng/mL in 20s, 15.1 ng/mL in 30s, 15.5 ng/mL in 40s, 18.3 ng/mL in 50s, and 18.3 ng/mL in over 60s.
As the age increased, the mean increased, and the deficiency rate was 89.9% in the 20s, 85.5% in the 30s, 81.8% in the 40s, 64.4% in the 50s, and 64.3% in the 60s and higher. For this study, when the blood sampling time of the subjects was analyzed accroding to four seasons, there was a significant difference in the blood vitamin D concentrations analyzed seasonally in Table 3(P<0.001). By season, the highest were 17.1 ± 0.5 ng/mL in autumn and 17.1±0.5 ng/mL in summer, followed by 15.3±0.3 ng/mL in spring and 13.7±0.3 ng/mL in winter.
Fig. 1. Distribution of Vitamin D in serum by gender
Fig. 2. Blood Vitamin D distribution by age group
Variable Category Serum 25(OH)D
(ng/mL) Male Female
N (%) M±SD
p<0.001 Season Total 1977 (100.00) 15.9±0.1
Spring 511 (25.85) 15.3±0.3 Summer 520 (26.30) 17.1±0.5 Autumn 504 (25.49) 17.1±0.5 Winter 442 (22.36) 13.7±0.3 p-values were calculated by ANOVA
Table 3. Differences in serum Vitamin D concentration by season
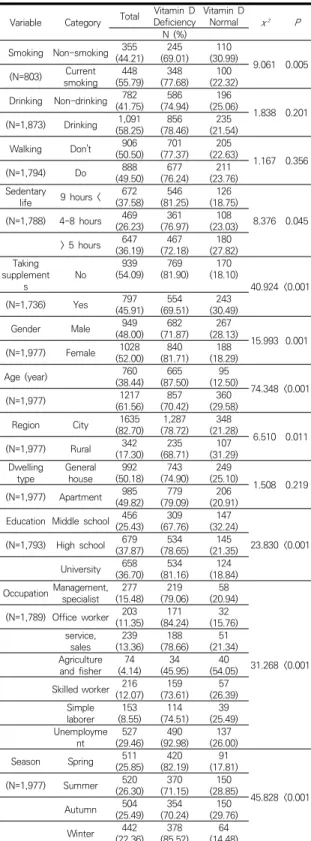
3.4 Association between vitamin D levels and study variables
Cross-analysis was conducted to determine the relationship between vitamin D levels, health behavior levels, and control variables. Smoking (χ
²=9.061, P=0.005), sedentary lifestyle (χ²=8.376, P=0.045), and supplementation (χ²=40.924, P<0.001), gender (χ²=16.0, P=0.001), age (χ²=74.4, P<0.001), education level (χ²=23.830, P<0.001), occupation (χ²=31.268, P<0.001), seasons (χ²=45.828, P<0.001) showed a significant correlation. Drinking (χ
²=1.838, P=0.201), walking practice (χ²=1.167, P=0.356), area (χ²=6.510, P=0.011), dwelling type (χ²=1.508, P=0.219) were not significant in Table 4.
3.5 Relationship between vitamin D deficiency related factors by gender
The following was the result of logistic
Variable Male Female
OR 95%CI p OR 95%CI p
Age (year)
- Based on age 40 4.120 2.479-6.847 <0.001 1.8731.181–2.970 0.008 Season
- Spr,Win/Sum, Au
t 4.182 2.779–6.292 <0.001 1.4920.935–2.382 0.093 Region
- City/rural 2.049 1.301–3.229 0.002 0.8320.452–1.529 0.552 Dwelling type
- Houses/apartmen
ts 1.074 0.690–1.672 0.75 1.1410.704–1.848 0.591 Occupation
- Indoor/outdoor 1.690 0.732–3.904 0.218 4.519 .682–12.1390.003 Table 5. Differences in serum Vitamin D concentration
by season Variable Category Total Vitamin D
Deficiency Vitamin D
Normal χ² P
N (%) Smoking Non-smoking 355(44.21) 245
(69.01) 110
(30.99) 9.061 0.005 (N=803) Current
smoking 448
(55.79) 348 (77.68) 100
(22.32) Drinking Non-drinking 782
(41.75) 586 (74.94) 196
(25.06) 1.838 0.201 (N=1,873) Drinking 1,091
(58.25) 856 (78.46) 235
(21.54)
Walking Don't 906
(50.50) 701 (77.37) 205
(22.63) 1.167 0.356
(N=1,794) Do 888
(49.50) 677 (76.24) 211
(23.76) Sedentary
life 9 hours < 672 (37.58) 546
(81.25) 126 (18.75)
8.376 0.045 (N=1,788) 4-8 hours 469
(26.23) 361 (76.97) 108
(23.03)
> 5 hours 647 (36.19) 467
(72.18) 180 (27.82) Taking
supplement
s No 939
(54.09) 769 (81.90) 170
(18.10)
40.924 <0.001
(N=1,736) Yes 797
(45.91) 554 (69.51) 243
(30.49)
Gender Male 949
(48.00) 682 (71.87) 267
(28.13) 15.993 0.001 (N=1,977) Female 1028
(52.00) 840 (81.71) 188
(18.29)
Age (year) 760
(38.44) 665 (87.50) 95
(12.50) 74.348 <0.001
(N=1,977) 1217
(61.56) 857 (70.42) 360
(29.58)
Region City 1635
(82.70) 1,287 (78.72) 348
(21.28) 6.510 0.011
(N=1,977) Rural 342
(17.30) 235 (68.71) 107
(31.29) Dwelling
type General
house 992
(50.18) 743 (74.90) 249
(25.10) 1.508 0.219 (N=1,977) Apartment 985
(49.82) 779 (79.09) 206
(20.91) Education Middle school 456(25.43) 309
(67.76) 147 (32.24)
23.830 <0.001 (N=1,793) High school 679
(37.87) 534 (78.65) 145
(21.35) University 658
(36.70) 534 (81.16) 124
(18.84) Occupation Management,specialist 277
(15.48) 219 (79.06) 58
(20.94)
31.268 <0.001 (N=1,789) Office worker 203(11.35) 171
(84.24) 32 (15.76) service,
sales 239
(13.36) 188 (78.66) 51
(21.34) Agriculture
and fisher 74
(4.14) 34
(45.95) 40 (54.05) Skilled worker 216(12.07) 159
(73.61) 57 (26.39) Simple
laborer 153 (8.55) 114
(74.51) 39 (25.49) Unemployme
nt 527
(29.46) 490 (92.98) 137
(26.00)
Season Spring 511
(25.85) 420 (82.19) 91
(17.81)
45.828 <0.001 (N=1,977) Summer 520
(26.30) 370 (71.15) 150
(28.85)
Autumn 504
(25.49) 354 (70.24) 150
(29.76)
Winter 442
(22.36) 378 (85.52) 64
(14.48)
Table 4. Differences in serum Vitamin D concentration by
season regression analysis of the association between
vitamin D deficiency and health behavior level by integrating control variables (age, season, region, housing type, occupation). There was a high correlation between education level and occupation before analysis, so education level was excluded from the analysis. Vitamin D levels, general characteristics, and health behaviors of men and women with different characteristics were analyzed separately. In males, the crossover ratio under 40 was 4.1 (95% Cl, 2.5–6.9) compared to over 40 years. Seasonality was statistically significant as the ratio of spring and winter was 4.2(95% Cl, 2.8-6.3)compared to summer and autumn.
The urban area ratio was 2.1 (95% Cl, 1.3-3.2) compared to rural areas, which was statistically significant. As a significant health behavior, the smoking rate was 1.8 (95% Cl, 1.2–2.7).
Supplementary intake was significantly higher (95% Cl, 1.3–3.4)) for the non-users compared to the dosers. Sedentary lifestyles were significantly increased by 1.1 (95% Cl, 1.0–1.1) for each hour.
For women, the odds ratio of younger than 40 was 1.9 (95% Cl, 1.2–3.0). For occupations, the crossover ratio of indoor occupations was 4.5 (95% Cl, 1.7–12.1) compared to outdoor occupations.
Supplementary intake was significantly higher in the non-users ratio 3.0% (95% Cl, 1.8–4.8) than users in Table 5.
Drinking - Non-drinking
/Drinking 1.064 0.685–1.653 0.781 1.0700.682–1.678 0.768 Smoking
- Smoking
/non-smoking 1.793 1.180–2.727 0.006 0.6670.235–1.892 0.445 Walking
- No/Yes 1.077 0.697–1.664 0.737 1.3680.896–2.088 0.146 Taking supplements
- No/Yes 2.121 1.312–3.429 0.002 2.9771.836–4.826<0.001 Sedentary life
- No/Yes 1.063 1.007–1.122 0.028 1.0430.969–1.122 0.263 Abbreviation: Spr, spring; Win, Winter; Sum, Summer; Aut, autumn.
p-values were calculated by a logistic regression analysis.
4. DISCUSSION AND CONCLUSION
The purpose of this study was to determine the level of vitamin D in the blood of adults in their 20s and older, and to determine the association with vitamin D deficiency by analyzing the factors influencing this data. When the vitamin D distribution (75.9% male, 83.2%
female) of this study and the deficiency rate (65.9% male, 77.7% female) of previous studies using the 2010-2011 data were obtained, the results were somewhat higher. This is considered to be because the study excluded teenagers[13].
In addition, the overall vitamin D deficiency rate of 74.4% of previous studies using the same data from 2013-2014 was 75.9% similar to that of this study[14].
The factors influencing vitamin D levels were influenced by gender, age, season, education level, occupation, supplements, and sedentary lifestyle. In the results, the subjects under 40 years of age had a higher deficit than those over 40 years old, and the observed results were similar to previous studies[13,14]. The higher the education level, the lower the vitamin D level, and there was a significant difference between occupation groups. This is judged to be highly related between education level and occupation, and the difference in sunshine time according to the type and characteristics of occupation may be affected by modern people who spend much time in their daily lives. The previous findings
which are expected to be risk factors affecting deficiency, coincide with the observed results of this study[15]. However, in this study, the male and female results were different in the logistic regression analysis. Seasonal, regional, smoking status, sedentary lifestyle were significant in male. But women were not. In women, significant differences were observed in occupation, unlike men. Age and supplement intake were statistically significant in both gender. The results of vitamin D deficiency are different among countries, but there are previous studies showing that Korea is very high among young people[6,13]. In addition, previous studies have shown that vitamin D intake of supplements or foods high in vitamin D may affect blood vitamin D concentrations in addition to sunlight synthesis[16-19]. These previous studies support the results of this study. However, for women, a slightly different result was observed, which is thought to be the effect of health behavior to avoid exposure to UV rays due to the frequent use of sunscreen block by women[6,20]. Most of the vitamin D synthesis is obtained from the skin by the sun's UV-B irradiation[21], and there is a difference in the level of vitamin D in the blood according to the season[6]. Intake of vitamin D as a supplement can increase the level appropriately[16-19]. When comparing the results of this study with previous studies, which indicated that vitamin D may be deficient if there is less time for outdoor activity as a biological indicator[22], vitamin D levels are the most important factor for outdoor activity. Behavior may be due to long sedentary lifestyles[22-24], and a number of factors (job, education, walking, etc.) are very important in the study of vitamin D deficiency and intervention.
In this study, we analyzed adults over 20 years old. To determine the distribution of vitamin D, the deficiency rate was below 20 ng/mL. The deficiency rate was 71.87% for males and 81.71%
for females. These results were the same as in
the Muslims[25].
Factors related to vitamin D observed through chi-square analysis were control variables such as gender, age, season, education level and occupation. Health behaviors included walking practice, supplementation, and sedentary lifestyle.
The gender-controlled logistic regression analysis was performed to determine the relative risks of the highly related factors. Both male and female had significant results with age and supplementation. Seasonal, regional, smoking status, sedentary lifestyle were significant in male, and female were only significant in occupation. Male under 40 years of age, spring and winter, city dwellers, smokers, and no supplements and long sedentary lifestyles were relatively at risk for vitamin D deficiency. Female under 40 years old, occupational occupations, and female who did not take supplements were found to be relatively at risk for vitamin D deficiency. These results suggest that the results observed differently according to gender are deeply related to health behaviors, and the difference in health behaviors is related to vitamin D deficiency.
The limitation of this study is that even though the representations of the study subjects is obtained through a complex sample analysis of the National Health and Nutrition Survey, which is a national statistical data, the vitamin D test is not conducted every year. Due to the limited number of survey data available and the limited number of subjects, there may be limitations in observing the exact relevance. Therefore, this study was able to observe the effect of seasonal factors on vitamin D by receiving data on the timing of blood collection as a cross-sectional study, but the data analysis was restricted due to domestic privacy law and statistical law. There was a limit to judging the causal relationship between factors.
However, despite these limitations, this study is considered to be a useful data to analyze and
relate various factors affecting vitamin D deficiency.
Vitamin D is associated with high blood pressure, diabetes, obesity, and microalbumin[26]. Vitamin D deficiency has been implicated in the outcome of chronic liver disease[27]. A vitamin D deficiency is accompanied by the increased tendency of autoimmune diseases[28].
In conclusion, vitamin D deficiency in Koreans was observed to be serious, and it is necessary to increase vitamin D supplement intake and outdoor activities as an important means to remedy this.
REFERENCES
[1] M. Wacker & M. F. Holick. (2013). Sunlight and Vitamin D: A global perspective for health.
Dermato-endocrinology, 5, 51-108.
DOI : 10.4161/derm.24494
[2] J. Blaine, M. Choncho & M. Levi. (2015). Renal control of calcium, phosphate, and magnesium homeostasis.
Clinical journal of the American society of nephrology, 10(7), 1257-1272.
DOI : 10.2215/CJN.09750913
[3] S. Christakos, D. V. Ajibade, P. Dhawan, A. J. Fechner
& L. J. Mady. (2012). Vitamin D: metabolism.
Rheumatic Disease Clinics, 38(1), 1-11.
DOI : 10.1016/j.rdc.2012.03.003
[4] H. Wang et al. (2017). Vitamin D and chronic diseases.
Aging and disease. 8(3), 346-353.
DOI : 10.14336/AD.2016.1021
[5] J. S. Danik & J. E. Manson. (2012). Vitamin D and cardiovascular disease. Current treatment options in cardiovascular medicine, 14(4), 414-424.
DOI : 10.1007/s11936-012-0183-8
[6] E. H. Nah, S. Kim & H. I. Cho. (2015). Vitamin D levels and prevalence of vitamin D deficiency associated with sex, age, region, and season in Koreans.
Laboratory Medicine Online, 5(2), 84-91.
DOI : 10.3343/lmo.2015.5.2.84
[7] E. K. Roh1 & H. Yoon. (2015). The Association of Metabolic Syndrome and Vitamin D in Korean Menopausal Women: Korea National Health and Nutrition Survey, 2010∼2012. Korean J Clin Lab Sci, 47(12), 318-323.
DOI : 10.15324/kjcls.2015.47.4.318
[8] Ministry of Health and Welfare. (2014). The Fifth Korea National Health and Nutrition Examination Survey (KNHANES VI-2). Sejong : MOHW.
[9] A. A. Ginde, M. C. Liu & C. A. Camargo. (2009).
Demographic differences and trends of vitamin D insufficiency in the US population, 1988-2004.
Archives of internal medicine, 169(6), 626-632.
DOI : 10.1001/archinternmed.2008.604
[10] K. A. Kennel, M. T. Drake & D. L. Hurley. (2010).
Vitamin D deficiency in adults: when to test and how to treat. Mayo Clin Proc, 85(8), 752-758.
DOI : 10.4065/mcp.2010.0138
[11] T. D. Thacher & B. L. Clarke. (2011). Vitamin D insufficiency. Mayo Clin Proc, 86(1), 50-60.
DOI : 10.4065/mcp.2010.0567
[12] M. F. Holick. (2007). Vitamin D deficiency. N Engl J Med, 357, 266-81.
DOI : 10.1056/NEJMra070553
[13] I. K. Jung. (2013). Prevalence of vitamin D deficiency in Korea: Results from KNHANES 2010 to 2011.
Journal of nutrition and health, 46(6), 540-551.
DOI : 10.4163/jnh.2013.46.6.540
[14] H. S. Kim, Y. J. Han, B. C. Kim & S. Y. Ryu. (2017).
Relevance of Vitamin D and Dyslipidemia Among Korean Adults-Using Data from the Sixth Korea National Health and Nutrition Examination Survey, 2013-2014. Journal of the Korea academia-industrial cooperation society, 18(3), 647-656.
DOI : 10.5762/KAIS.2017.18.3.647
[15] J. M. Sim, H. G. Jeon & K. C. Lee. (2015). Comparative analysis of the effect of physical activity and stress experience on the Vitamin D deficiency according to occupations: results from KNHANES dataset for 2008-2013. International Journal of Contents, 15(8), 505-518.
DOI : 10.5392/JKCA.2015.15.08.505
[16] K. Nakamura, M. Nashimoto, Y. Hori & M. Yamamoto.
(2000). Serum parathyroid hormone in healthy Japanese women in relation to serum 25-hydroxyvitamin D. Int J Vitam Nutr Res, 70, 287-292.
DOI : 10.1024/0300-9831.70.6.287
[17] P. Lips. (2001). Vitamin D deficiency and secondary hyperparathyroidism in the elderly: consequences for bone loss and fractures and therapeutic implications.
Endocr Rev, 22(4), 477-501.
DOI : 10.1210/edrv.22.4.0437
[18] T. Hagenau et al. (2009). Global vitamin D leve ls in relation to age, gender, skin pigmentation and latitude:
anecologic meta-regression analysi s. Osteoporos Int, 20(1), 133-140.
DOI : 10.1007/s00198-008-0626-y
[19] P. Pludowski et al. (2018). Vitamin D supplementation guidelines. The Journal of steroid biochemistry and molecular biology, 175, 125-135.
DOI : 10.1016/j.jsbmb.2017.01.021
[20] N. Chauhan, A. Batul, A. S. Bhatia, S. Sachdev & M.
Gupta. (2018). Vitamin D deficiency among female students of a Government Medical College. National
journal of physiology, pharmacy and pharmacology, 8(12), 1587-1590.
DOI : 10.5455/njppp.2018.8.0827306092018
[21] C. J. Rosen. (2011). Vitamin D insufficiency. The New England Journal of Medicine, 364, 248-254.
DOI : 10.1056/NEJMcp1009570
[22] M. Y. Kwon & S. J. Yang. (2017). Risk factors associated with vitamin D deficiency among women office workers. Journal of Korean Public Health Nursing, 31(1), 84-96.
DOI : 10.5932/JKPHN.2017.31.1.84
[23] D. Sowah, X. Fan, L. Dennett, R. Hagtvedt & S.
Straube. (2017). Vitamin D levels and deficiency with different occupations: a systematic review. BMC Public Health, 17, 519.
DOI : 10.1186/s12889-017-4436-z
[24] P. Solis-Urra et al. (2019). Passive commuting and higher sedentary time is associated with vitamin D deficiency in adult and older women: Results from Chilean National Health Survey 2016–2017. Nutrients, 11(2), 300.
DOI : 10.3390/nu11020300
[25] T. S. Tuan Ismail1, B. Che Muda1, R. A. Mohd Rosdi1, A. Zainuddin1, S. Isa & Z. Mustapaha. (2017).
Determining the Required Vitamin D Level for Bone Health Based on Bone Turnover Markers. Korean J Clin Lab Sci, 49(4), 337-344.
DOI : 10.15324/kjcls.2017.49.4.337
[26] S. G. Kim & B. Y. Park. (2019). The relationship between Vitamin D and obesity to improve quality of life. Journal of the Korea Entertainment Industry Association, 13(5), 139-143.
DOI : 10.21184/jkeia.2019.7.13.5.139
[27] M. Ebadi et al. (2019). Severe vitamin D deficiency is a prognostic biomarker in autoimmune hepatitis.
Alimentary pharmacology & therapeutics, 49(2), 173-182.
DOI : 10.1111/apt.15029
[28] N. E. Günay, İ. Buğday & T. Akalın. (2018). Relationships of the Vitamin D and Platelet Indices in Sjögren’s Syndrome. Korean J Clin Lab Sci, 50(4), 484-491.
DOI : 10.15324/kjcls.2018.50.4.484
정 유 현(You-Hyun Joung) [정회원]
․ 2018년 2월 : 아주대학교 보건대학원 역학과 (보건학석사)
․ 1999년 4월 ~ 현재 : 동수원병원 해 부병리과
․ 2019년 3월 ~ 현재 : 단국대학교 임 상병리과 겸임교수
․ 관심분야 : 임상병리학, 조직병리학, 임상생리학, 보건통계, 융합기술학
․ E-Mail : [email protected]
윤 현(Hyun Yoon) [정회원]
․ 2010년 8월 : 목포대학교 생물학과 (이학석사)
․ 2014년 2월 : 조선대학교 일반대학원 보건학과 (보건학박사)
․ 2010년 9월 ~ 2019년 2월 : 한려대 학교 임상병리학과 교수
․ 2019년 9월 ~ 현재 : 원광보건대학교 임상병리과 교수
․ 관심분야 : 보건학, 미생물학, 면역학, 혈청학, 임상병리학
․ E-Mail : [email protected]
성 현 호(Hyun-Ho Sung) [정회원]
․ 2012년 8월 : 한국체육대학교 대학원 건강관리과 (체육학석사)
․ 2018년 2월 : 서남대학교 일반대학원 의용공학과 (보건학박사)
․ 1998년 7월 ~ 2014년 2월 : 한화생 명 의무부 수석 임상병리사
․ 2014년 3월 ~ 현재 : 동남보건대학교 임상병리과 조교수
․ 관심분야 : 임상병리학, 임상화학, 의용공학, 통계학, 융합기 술학
․ E-Mail : [email protected]