JESK
http://jesk.or.kr eISSN:2093-8462A Study on Work Ability among Aging Workers in Korea
Day Sung Kim1, Jae Oh Park2
1Occupational Safety and Health Training Institute, KOSHA, Ulsan, 681-230
2Occupational Safety and Health Research Institute, KOSHA, Ulsan, 681-230
Corresponding Author Day Sung Kim
Occupational Safety and Health Training Institute, KOSHA, Ulsan, 681-230 Phone : +82-52-703-0998 Email : [email protected]
Received : September 24, 2014 Revised : October 01, 2014 Accepted : October 17, 2014
Objective and Background:The objective of this study was to evaluate the association of individual characteristics, work-related factors, lifestyle factors, and health problems with work ability among aging workers in Korea.
Method: In this cross-sectional survey, the study population consisted of 1,594 workers who had participated in a voluntary health promotion center and private workplace. Participants completed the work ability index.
Results: The mean WAI score was 37.4, while the mean age of the sample was 43.25. In the age group over 50 showed 36.26. The majority of participants rated their work ability as 'good' to 'excellent', one-third moderate and about 7.5% poor.
Work ability decreased significantly with age among the men. The younger group had higher scores on the work ability index than the age group over 50, except for mental resources. By work characteristics, work ability was analyzed to be the lowest in the case of work handling heavy stuff. Lastly, as a result of health factors analysis, the good management and retention of current health status can be the measure helpful to the improvement of work ability.
Conclusion and Application: According to the results, it can be a basic principle to devise and enforce preventive measures on the factors for which improvement or action is possible, together with workplace-level systematic approach, in order to improve work ability. For such measures to be realized, it is necessary to check trends in change for several years.
Keywords: Work ability, Work Ability Index (WAI), Aging worker, Individual characteristics, Work-related factors
Copyright@2014 by Ergonomics Society of Korea. All right reserved.
○cc This is an open-access article distributed under the terms of the Creative Commons Attribution Non-Commercial License (http://
creativecommons.org/licenses/by-nc/3.0/), which permits unrestricted non-commercial use, distribution, and reproduction in any medium, provided the original work is properly cited.
1. Introduction
Looking into the future population estimation of KOSTAT (2013), Korean population will increase to 52.16 million in 2030, but will decrease to 43.96 million in 2060, due to low birth rate. Economically active population is also forecast to decrease with 37.04 million (72.9% of total population) in 2016 as the peak. The elderly population will surpass the number of children in 2017, and ten economically active people should support ten people (eight elderly people and two children) in 2060. As such, the problems of low birth rate and aging are reported to emerge as social phenomena from 2020 (YonHap News Agency, 2013). After 2030 when many of the baby boom generation (born in 1955-1963) retire from work, the problem of lacking skilled workers will become serious, and the retirement age will be extended to
60-65 years of age, centered on public institutions, and the aging of labor force is predicted. The problem of imbalance between work requirement (load) and work ability will take place, due to the aging of economically active population, and various factors can affect such an imbalance, in addition to the age (main cause), according to Ilmarinen et al., 1991.
In Korea, data on the aging of general population is produced in large quantities; however, survey and research are limited to specific business types and jobs at workplace level, and therefore, the data to devise comprehensive measures lacks. In this regard, literature study on global trend in work ability is necessary, and an approach to present a variety of factors affecting aging through comprehensive fact-finding survey nationwide is needed.
Looking at the aging at domestic workplaces, as the employment rate of elderly people increased, the mean age of workers rose by 5.1 years from 38.9 in 1990 to 44.0 in 2013, according to Jung (2013). The mean age of Korea's shipbuilding industry went up from 40.3 in 2002 to 43.3 in 2012, and the mean age of the workers of a shipbuilder rises year by year, according to NEWSis (2013). The aging of the biggest population group, baby boom generation (born in 1955-1963), critically affected. And, also the mean age of total workers increased, as retirement age was extended, and the reemployed middle-aged and elderly class for low-waged irregular jobs increased, after their retirement, according to Asia Business Daily (2013). Despite the aging of economically active population, the retirement age of private companies with 300 and more of employees is 56 on average and the desired retirement age of wage workers is 64, and a huge gap exists between the two retirement ages. According to the 2011 Supplementary Survey of Economic activities, the mean age of principal job retirement was 53, while 59% of the population aged 55-79 hope to work in the future (Kim and Cho, 2012).
As a result of industrial accident analysis, the accident rate of elderly workers was 27.6% in 2001, but it rose to 46.4% in 2011, and musculoskeletal disease took up most (MOEL, 2012). The disease develops, due to repeated performance of the same work for a long time or work handling heavy stuff. Such a musculoskeletal disease occurs from the difference between work ability and work load, since work requirements do not change, although work ability decreases, as workers are getting older. However, various researches on the difference level are necessary. In this regard, measures for working environment improvement, change in production mode and improvement of quality of life to prevent elderly workers' industrial accidents are required. Also, a method by evaluating work ability of elderly workers in consideration of work-related characteristics is demanded for the preservation of high quality labor force. Now is the time that objective basis data on work ability, according to various factors, is needed.
This study checked international level of the work ability of Korean population group, and analyzed the effect of various factors on work ability. This study aims to present measures to maintain, increase and improve the work ability of workers including elderly workers, as well as to identify the health status of the elderly workers (50 years old and over).
2. Method
2.1 Participants1,709 people in total voluntarily participated in the questionnaire survey, and this study targeted 1,594 people, excluding some questionnaire respondents, due to omission of answers to some questions. 55.1% of males and 44.9% of females consisted of the total questionnaire respondents. Total mean age was 43.25 (standard deviation (SD): 10.39). By age group, the respondents in their 50s (50-59) were the most at 31.0%, followed by their 30s (30-39) at 28.9%, and their 40s (40-49) at 25.5%. The elderly workers of 50 and over took up 35.5%.
2.2 Apparatus
Surveyor's name, survey date and survey table number need to be written in the basic item of the questionnaire. Also, the questionnaire includes gender, age, height, weight, marriage status and educational level, which can be individual factors. Total work experience and the current job work experience, which can be work-related factors, are surveyed, as well as work-related characteristics and work type. As lifestyle factors, the status of exercise, smoking and alcohol drinking are included in the questionnaire. In addition, the items related with overall health status, which can be health factors, are included. Above all, this study used WAI (Work Ability Index) that can be calculated using seven items including current work ability and mental quality.
WAI was developed by the Finnish Institute of Occupational Health, and is the index to monitor work ability, namely, how well a worker can perform work. WAI is utilized for the purpose of offering a preventive alternative and helping early rehabilitation by checking work ability reduction at early stage, according to the aging of the middle-aged and elderly class. The WAI questionnaire checklist used in this study was the question items showing 81% of consistency in the study of Yang (2011). Personal consent of the questionnaire participants on the use of the items included in the questionnaire was received upon the questionnaire survey.
2.3 Procedure
The purpose and how to answer the questionnaire survey were explained, after the questionnaires were distributed to the survey- targeted workers. The workers were supposed to answer in the self-writing mode. If a worker completes the answers to the questions, a surveyor - an industrial health expert (nurse, etc.) - checks whether there was any omitted items in the answering process through interview with the respondent concerned, and the omitted ones were answered through supplementary questions. The questions related with disease were answered through specific interview as well. To check work ability of the elderly workers, the questionnaire survey was conducted, according to the voluntary participation of the questionnaire respondents targeting the workplaces with 50 employees and less.
3. Results
3.1 WAI and work ability class
As a result of collected data search result on WAI, it is difficult to assume normal distribution, and therefore, a nonparametric statistical analysis, Kruskal-Wallis test, was used. For correlation analysis, Spearman correlation, which is a nonparametric statistical analysis that can apply to non-normal distribution group, was used. Many studies related to WAI conducted the questionnaire analysis using such a method. For work ability class, this study carried out a chi square analysis. Above all, confidence test on whether there was no problem in using the WAI and relevant questions was carried out, before WAI was evaluated. Generally, Cronbach's alpha is used for confidence test, and the Cronbach's alpha in this study was 0.74, which was higher than 0.72, the mean value of ten European countries, as well as higher than general 0.6-0.7. This shows that the questionnaire survey result is very reliable.
Table 1 shows the analysis result of WAI and work ability class, and the mean WAI of the total respondents was 37.4 (SD: 6.155), and was at good level overall. Good level was 48.2%, moderate level was 30.9%, excellent level was 13.4% and poor level was 7.5% as to work ability by class. Overall good and excellent levels were 61.6%. The mean WAI of the elderly workers was 36.26 (SD: 6.558), and that of the group aged 50 and younger was 38.03 (SD: 5.829), and therefore, the elderly workers were analyzed to be significantly low. The good and excellent levels of the elderly workers were 52.7%, and those of the group aged 50 and younger showed 66.0%. With all these, the measures to maintain and increase the work ability of the elderly workers are required.
3.2 Individual characteristics
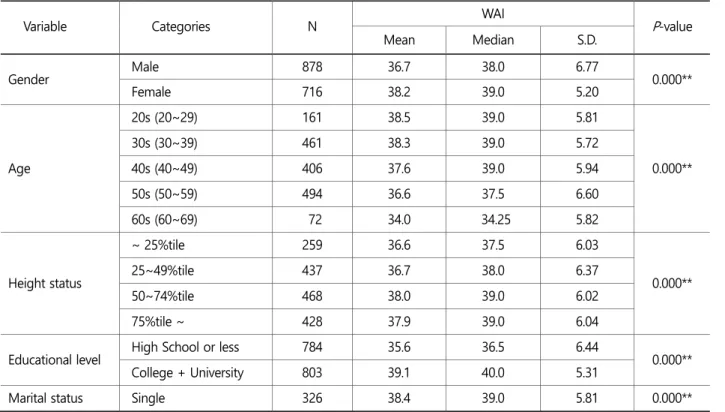
Table 2 shows the distribution of WAI by individual factors, and significant differences were found in all items. As a result of WAI analysis by gender, male's mean WAI was 36.7 (SD: 6.77), and female's mean WAI was 38.2 (SD: 5.20), and thus, female's work ability was significantly higher than the male's statistically. By age, the mean WAI of the respondents in their 20s was the highest at 38.5 (SD: 5.81), and that of the age group of 60s was the lowest at 34 (SD: 5.82). As respondents were older, the mean WAI was analyzed to show statistically significant decrease. As a result of analysis, according to height, the mean WAI was the highest at 38.0 (SD: 6.02) in the group with slightly taller height (50-75 percentile) than mean height, and it was the lowest at 36.6 (SD:
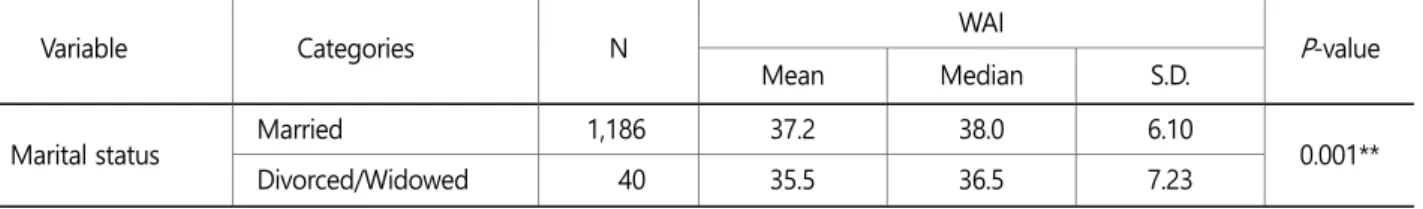
6.03) in the shortest group in height (25 percentile and lower). As for educational level, the graduates of high school and lower showed 35.6 (SD: 6.44), which was lower than the graduates of university and higher at 39.1 (SD: 5.31). This implies that WAI increases, as educational level is higher. In the survey on marital status, the WAI of singles (non-married) or married people was higher than that of the divorced group.
Table 1. Results of WAI and work ability class by age group
Age group WAI Work ability class
Mean Median S.D. Poor Moderate Good Excellent
Total 37.4 38.0 6.155 120 (7.5) 492 (30.9) 768 (48.2) 214 (13.4)
~ 50 38.03 39.0 5.829 62 (6.0) 288 (28.0) 528 (51.4) 150 (14.6)
50 ~ 36.26 37.0 6.558 58 (10.2) 204 (36.0) 240 (42.4) 64 (11.3)
Table 2. Results of WAI by individual characteristics
Variable Categories N WAI
P-value
Mean Median S.D.
Gender Male 878 36.7 38.0 6.77
0.000**
Female 716 38.2 39.0 5.20
Age
20s (20~29) 161 38.5 39.0 5.81
0.000**
30s (30~39) 461 38.3 39.0 5.72
40s (40~49) 406 37.6 39.0 5.94
50s (50~59) 494 36.6 37.5 6.60
60s (60~69) 72 34.0 34.25 5.82
Height status
~ 25%tile 259 36.6 37.5 6.03
0.000**
25~49%tile 437 36.7 38.0 6.37
50~74%tile 468 38.0 39.0 6.02
75%tile ~ 428 37.9 39.0 6.04
Educational level High School or less 784 35.6 36.5 6.44
0.000**
College + University 803 39.1 40.0 5.31
Marital status Single 326 38.4 39.0 5.81 0.000**
3.3 Work-related factors
Table 3 shows the relationship between work-related factors and work ability, and statistically very significant differences were demonstrated in all items such as work experience, work characteristics and work type. As a result of analysis on work experience, the mean WAI of the group with five years and less of work experience was the highest at 38.7 (SD: 5.77), and that of the group with 25-30 years of work experience was the lowest at 35.5 (SD: 7.06). As the years of work experience was long, WAI showed a downtrend, but the mean WAI rather increased to 36.7 (SD: 6.49) in the case of the group with 30 years and more of work experience. This can be judged that the elderly workers with long years of work experience rated themselves higher than their own work ability, due to anxiety towards retirement. According to work characteristics, the mean WAI in the case of carrying out repetitive work was 37.1 (SD: 6.09), and that of work handling heavy stuff was 35.7 (SD: 6.66), and other work was 39.2 (SD: 5.51).
The work ability in the work handling heavy stuff was analyzed to low, and also repetitive work ability was lower than other work.
As a result of work type, the mean WAI of the group working mainly with standing posture was 35.0 (SD: 7.03), and that of the group working mainly with sitting posture was 38.6 (SD: 5.40): the work ability with standing posture was analyzed to be low.
Table 2. Results of WAI by individual characteristics (Continued)
Variable Categories N WAI
P-value
Mean Median S.D.
Marital status Married 1,186 37.2 38.0 6.10
0.001**
Divorced/Widowed 40 35.5 36.5 7.23
**p<0.01
Table 3. Results of WAI by work-related factors
Variable Categories N WAI
P-value
Mean Median S.D.
Work experience
~ 5 yrs. 247 38.7 39.0 5.77
0.000**
5~10 yrs. 300 38.2 39.0 5.50
10~15 yrs. 250 38.2 39.25 5.70
15~20 yrs. 226 37.7 38.0 5.67
20~25 yrs. 173 36.2 36.5 6.22
25~30 yrs. 169 35.5 37.0 7.06
30 yrs. ~ 156 36.7 37.25 6.49
Work characteristics
Repetitive work 900 37.1 38.0 6.09
0.000**
Exerted force work 266 35.7 37.0 6.66
Other work 428 39.2 40.0 5.51
Work types
Mainly standing 342 35.0 36.0 7.03
0.000**
Sitting and standing 557 37.4 38.0 6.03
Mainly sitting 695 38.6 39.0 5.40
**p<0.01
3.4 Lifestyle factors
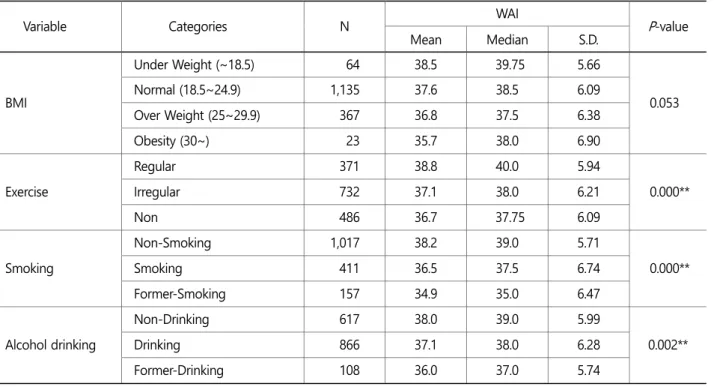
Table 4 shows the relationship between lifestyle factors and work ability, and significant differences were found in all items except BMI. As a result of examining the status of exercise and work ability, the mean WAI was the highest at 38.8 (SD: 5.94) in the group regularly exercising, and the group not undertaking exercise was the lowest at 36.7 (SD: 6.09). This means that regular exercising helps the retention and improvement of work ability. According to the survey result on smoking, the mean WAI of the group of non-smoking people was 38.2 (SD: 5.71), while that of the group of smoking people was 36.5 (SD: 6.74), and the former smoking people's group was low at 34.9 (SD: 6.47). In the survey on the status of alcohol drinking, the non-drinking group's mean WAI was 38 (SD: 5.99), which was higher than the alcohol drinking group (37.1 and SD: 6.28) and the former alcohol group (36 and SD: 5.74). As such, the work ability of the groups of non-smoking or non-alcohol drinking people was better, and thus, a measure to recommend giving up smoking or non-alcohol drinking is required.
3.5 Health problems
Table 5 shows the relationship between health factors and work ability, and significant differences were found in all items. As a result of investigating overall health status and WAI, the mean WAI of the group that answered the health status was very bad was 25.8 (SD: 6.94), but the group that answered the health status was very good was very high at 43.3 (SD: 3.74) (Figure 4-21). The health status compared with one year ago also showed the similar result. The mean WAI of the group that answered much worse was 28.1 (SD: 7.33), but that of the group that answered very good was 43.5 (SD: 3.87), which showed a significant difference. This means that the current health status very significantly affect WAI. Consequently, managing and retaining the current health status can be a measure to be helpful to the improvement of work ability.
Table 4. Results of WAI by lifestyle factors
Variable Categories N WAI
P-value
Mean Median S.D.
BMI
Under Weight (~18.5) 64 38.5 39.75 5.66
0.053
Normal (18.5~24.9) 1,135 37.6 38.5 6.09
Over Weight (25~29.9) 367 36.8 37.5 6.38
Obesity (30~) 23 35.7 38.0 6.90
Exercise
Regular 371 38.8 40.0 5.94
0.000**
Irregular 732 37.1 38.0 6.21
Non 486 36.7 37.75 6.09
Smoking
Non-Smoking 1,017 38.2 39.0 5.71
0.000**
Smoking 411 36.5 37.5 6.74
Former-Smoking 157 34.9 35.0 6.47
Alcohol drinking
Non-Drinking 617 38.0 39.0 5.99
0.002**
Drinking 866 37.1 38.0 6.28
Former-Drinking 108 36.0 37.0 5.74
**p<0.01
4. Discussion and Conclusion
This study conducted a fact-finding survey targeting 1,594 workers to identify Koreans' work ability level. Especially, this study analyzed individual factors (gender, age, marital status, education level), work-related factors (work experience, work characteristics and work type), lifestyle factors (BMI, status of exercise, smoking and alcohol drinking), and health factors (health status and health status compared with one year ago) that affect work ability. Above all, the measures to maintain and improve the work ability of the elderly workers aged 50 and over were proposed in this study.
As a result of work ability survey, the mean WAI of the total questionnaire respondents (N=1,594) was 37.4, and was analyzed to be the good level, and this value was about the median value of the existing studies. According to literature study on the mean WAI of the existing studies, it was 35.9-38.5 as a result of survey for ten years by Kumashiro et al. (2011), and the mean WAI value of Bang et al. (2010) was the lowest at 28.8. And also, various mean WAI values were found in order as follows: 31.2 (Ghaddar et al., 2011), 36.6 (Kim and Kim, 2008), 36.8 (Kloimüller et al., 2000), 37.9 (Mok et al., 2013), 38.7 (Cotrim et al., 2011), 40 (Lee and Chang, 2012), 41 (Baek and Chang, 2005), 40.9 (Alavinia et al., 2007), 41.1 (Choi, 2011), 41.7 (Monteiro et al., 2011), 42 (Kang et al., 2005), 43 (Bridger and Bennett, 2011).
The work ability by class in this study was as follows: Good level was 48.2%, Moderate level 30.9%, Excellent level 13.4%, and poor level 7.5%. Overall, the good and excellent levels were analyzed to be 61.6%. As a result of literature study on work ability class, the good+excellent ratio increased as follows in order, starting from 51.9% of Kim and Kim (2008): 57% (Kloimüller et al., 2000), 66.4% (Mok et al., 2013), 67.7% (Cotrim et al., 2011), 77.5% (Lee and Chang, 2012), 83.6% (Baek and Chang, 2005), 83.9%
(Alavinia et al., 2007), 84.4% (Choi, 2011), 85.6% (Monteiro et al., 2011) and 86.1% (Kang et al., 2005).
As a result of work ability-affecting factors analysis, WAI and work ability class showed differences, according to the questionnaire respondent's gender, age and work characteristics. According to individual factors, females had higher work ability than males, and a trend that WAI gradually diminished was clearly demonstrated, as worker's age increased. In terms of work ability class, the ratio of good level rapidly fell along with age increase, meanwhile, the moderate level increased in reverse. Consequently, intensive Table 5. Results of WAI by health problems
Variable Categories N WAI
P-value
Mean Median S.D.
Health status
Very bad 37 25.8 23.0 6.94
0.000**
Bad 270 31.9 32.0 5.98
Moderate 758 37.2 38.0 4.96
Good 370 40.4 41.0 4.17
Very good 159 43.3 44.0 3.73
Health status for compared with 1 year ago
Much worse 61 28.1 28.0 7.33
0.000**
Worse 432 34.4 35.0 6.02
No change 899 38.7 39.0 5.21
Better 161 40.3 41.0 4.50
Much better 41 43.5 44.0 3.87
**p<0.01
management of the group with moderate or good level of work ability class is necessary. As educational level was higher, work ability also rose. Also, the work ability of singles (non-married) was analyzed to be higher than the married people.
As a result of work-related factors analysis, there was a trend of work ability decline along with the increase of work experience, but, the work ability of the group with 30 year or more of work experience rather slightly rose. It is judged that they rated their work ability higher than their own in reality, due to anxiety towards retirement. As Lee and Chang (2012) pointed out, the cause can be the weak social welfare foundation. By work characteristics, work ability was analyzed to be the lowest in the case of work handling heavy stuff. And, by work type, work ability was the lowest in the case of physical work with standing posture.
According to lifestyle factors analysis, the work ability of the group regularly carrying out exercise was high, and the work ability of the group of non-smoking or non-alcohol drinking people was better. Regular exercise and offering the programs for giving up smoking and non-alcohol drinking can be measures to retain or improve work ability. Lastly, as a result of health factors analysis, the good management and retention of current health status can be the measure helpful to the improvement of work ability, since current health status is closely related with WAI.
For the elderly workers to continue to work productively, how to maintain and improve such work ability is important. In Finland, work ability is the concept widely defined as being determined with the interaction result of the factors related to working environment or working conditions, in addition to individual quality and drive. Consequently, it is emphasized that all the related people with the elderly workers should conduct individual role and responsibility basically to promote the retention and improvement of elderly worker's work ability. The elderly workers are responsible for the retention of their own health and physical functions. In addition, the business owners and managers play a pivotal role in workplace culture reorganization to support the elderly workers to perform productive work. For the elderly workers to stably work, cooperation of all workers including young people is also necessary.
However, disease information sensitive to personal information can be omitted in surveying WAI in this study, and the standard point of categorization of work ability class can be different according to respondents' demographic characteristics. Also, work ability can vary, since differences exist in economic, cultural, social and welfare levels in each country. Because, the questionnaire survey targeted specific place visitors, there is a limitation in that the survey did not include the entire Korean population. Despite such a limitation, the confidence level of the answers to the question items was higher than the mean value of European countries, and thus, the results of this study can be used as data to devise various alternatives.
According to the results in this study, it can be a basic principle to devise and enforce preventive measures on the factors for which improvement or action is possible, after classifying the factors into those possible or impossible to improve among the influencing factors, together with workplace-level systematic approach, in order to improve work ability. Of the individual factors, some can be the items impossible to improve, however, work-related factors, lifestyle factors and health factors consist of the items possible to improve. For the work-related factors, an ergonomic improvement program for working environment improvement is generally adopted, and the lifestyle and health factors are the part that can be changed at home or from community, and the above-mentioned health improvement program is generally operated. For such measures to be realized, it is necessary to check trends in change for several years.
References
Alavinia, S.M., van Duivenbooden, C. and Burdorf, A., Influence of work-related factors and individual characteristics on work ability among Dutch construction workers, Scand J Work Environ Health, 33(5), 351-357, 2007.
Asian economies, Aging Korea, the average employee age 44 years, www.asiae.co.kr, 2013. 10. 2.
Baek, Seung Yub and Chang, Seong Rok, Investigating the work ability of assembly workers, Proceeding of 2005 Spring Conference of the Ergonomics Society of Korea, 2005.
Bang, Ha Nam, Sin, Dong Gyun, Lee, Sung Gyun, Han, Jun, Kim, Ji Kyeung and Sin, In Cheol, A Study on Work Life of the Baby Boomer in Korea, Korea Labor Institute, 2010.
Bridger, R.S. and Bennett, A.I., Age and BMI interact to determine work ability in seafarers, Occupational Medicine, 61, 157-162, 2011.
Choi, Won-il, The Relationship between the incident rate and worker's Work Ability Index with respect to the types of manufacturing industries around North Gyeongbuk area, Kumoh National Institute of Technology, 2011.
Cotrim, T., Simoes, A. and Silva, C., Age and Work Ability among Portuguese Nurses, Age Management during the Life Course- proceeding of the 4th Symposium on Work ability, Tampere University Press, 2011.
Ghaddar, A., Ronda, E. and Nolasco, A., Work ability, psychosocial hazards and work experience in prison environments, Occupational Medicine, 61, 503-508, 2011.
Ilmarinen, J., Suurnakki, T., Nygard, C.H. and Landau, K., Classification of municipal occupations, Scand J Work Environ Health, 17(1), 12-29, 1991.
Jung, Sun Young, Demographic change impacts on employment, The Bank of Korea, Issue Paper Serics NO, 2013-2015, 2013.
Kang, Jong Cheol, Baek, Seung Yub and Chang, Seong Rok, Investigating the Work Ability of Employees in the Korean Machinery Industry, Journal of the KOSOS, 20(3), 197-201, 2005.
Kim, Joo Young and Cho, Jin Whan, Manufacturing workforce aging and retirement extended, Korea Institute for Industrial Economics & Trade, 2012.
Kim, Yu Chang and Kim, Jin Keun, A Study on Evaluation of Work Ability and Job Stress for Doctor, Journal of the Ergonomics Society of Korea, 27(4), 9-14, 2008.
Kloimüller, I., Karazman, R., Geissler, H., Karazman-Morawetz, I. and Haupt H., The relation of age, work ability index and stress- inducing factors among bus drivers, International Journal of Industrial Ergonomics, 25, 497-502, 2000.
KOSTAT, Annual Employment trends (2012/12), kostat.go.kr, 2013.
Kumashiro, M., Kadoya, M., Kubota, M., Yamashita, T., Higuchi, Y. and Izumi, H., The Relationship between Work Ability Index, Exercise Habits, and Occupational Stress-Employees with Good Exercise Habits Have Greater Work Ability, Age Management during the Life Course-proceeding of the 4th Symposium on Work ability, Tampere University Press, 2011.
Lee, Yujeong and Chang, Seong Rok, Assessment of Work Ability of Korean Workers in the Shipbuilding Industry using FIOH Questionnaire, Journal of the Ergonomics Society of Korea, 31(1), 171-176, 2012.
MOEL, Industrial Accident Statistics, www.moel.go.kr, 2012.
Mok, Yun-Soo, Lee, Dong Won and Chang, Seong Rok, A Study on the Work Ability and the Job Stress of the Workers in Manufacturing Industry of Automobile Parts, Journal of the KOSOS, 28(3), 100-106, 2013.
Monteiro, I., Tuomi, K., Goes, E.P., Hodge, E.P., Correa, Filho, H.R. and Ilmarinen, J., Work Ability During Life Course: Brazilian workers data bank analysis, Age Management during the Life Course-proceeding of the 4th Symposium on Work ability, Tampere University Press, 2011.
NEWSis, 'The average age of 43 years' the crisis of the world's best Korea's shipbuilding industry, www.newsis.com, 2013. 2. 11.
Radkiewicz, P. and Widerszal-Bazyl, M., The NEXT-Study group, Psychometric Properties of Work ability index in the light of comparative survey study, International Congress Series, 1280, 304-309, 2005.
WHO, Obesity; Preventing and Managing the global epidemic, Report of a WHO Consultation, WHO Technical Report Series, 894, 2000.
Yang, Dong Joo, An Empirical Study for Improvement of Industrial Engineer's Work ability-Focused on Reliability Test of WAI's Introduction to Korea -, Pusan National University, 2011.
YonHap News Agency, Korea elderly employment highest…<OECD>, www.yonhapnews.co.kr, 2013. 1. 13.
Author listings
Day Sung Kim: [email protected]
Highest degree: Ph.D., Department of Industrial & Management Engineering, University of Incheon Position title: Professor, Occupational Safety and Health Training Institute, KOSHA
Areas of interest: Ergonomics, Safety and Health Management, Musculoskeletal Disorders
Jae Oh Park: [email protected]
Highest degree: BS, College of Nursing, Busan National University
Position title: Researcher, Occupational Safety and Health Research Institute, KOSHA Areas of interest: Health Promotion, Safety and Health Management