JESK
http://jesk.or.kr eISSN:2093-8462The Examination of Reliability of Lower Limb Joint Angles with Free Software ImageJ
Heung Youl Kim
Nanzan University, Department of Policy Studies, Aichi, 489-0863, JAPAN
Corresponding Author Heung Youl Kim
Nanzan University, Department of Policy Studies, Aichi, 489-0863, JAPAN Phone : +81-80-5115-3179 Email : [email protected]
Received : August 31, 2015 Revised : September 06, 2015 Accepted : October 06, 2015
Objective:The purpose of this study was to determine the reliability of lower limb joint angles computed with the software ImageJ during jumping movements.
Background: Kinematics is the study of bodies in motion without regard to the forces or torques that may produce the motion. The most common method for collecting motion data uses an imaging and motion-caption system to record the 2D or 3D coordinates of markers attached to a moving object, followed by manual or automatic digitizing software. Above all, passive optical motion capture systems (e.g. Vicon system) have been regarded as the gold standards for collecting motion data. On the other hand, ImageJ is used widely for an image analysis as free software, and can collect the 2D coordinates of markers. Although much research has been carried out into the utilizations of the ImageJ software, little is known about their reliability.
Method: Seven healthy female students participated as the subject in this study.
Seventeen reflective markers were attached on the right and left lower limbs to measure two and three-dimensional joint angular motions. Jump performance was recorded by ten-vicon camera systems (250Hz) and one digital video camera (240Hz).
The joint angles of the ankle and knee joints were calculated using 2D (ImageJ) and 3D (Vicon-MX) motion data, respectively.
Results: Pearson's correlation coefficients between the two methods were calculated, and significance tests were conducted (α = 1%). Correlation coefficients between the two were over 0.98. In Vicon-MX and ImageJ, there is no systematic error by examination of the validity using the Bland-Altman method, and all data are in the 95% limits of agreement.
Conclusion: In this study, correlation coefficients are generally high, and the regression line is near the identical line. Therefore, it is considered that motion analysis using ImageJ is a useful tool for evaluation of human movements in various research areas.
Application: This result can be utilized as a practical tool to analyze human performance in various fields.
Keywords: ImageJ, Vicon-MX, Reliability, Joint angle
Copyright@2015 by Ergonomics Society of Korea. All right reserved.
○ccThis is an open-access article distributed under the terms of the Creative Commons Attribution Non-Commercial License (http://
creativecommons.org/licenses/by-nc/3.0/), which permits unrestricted non-commercial use, distribution, and reproduction in any medium, provided the original work is properly cited.
1. Introduction
The method to draw planar (two-dimensional; 2D) or spatial (three-dimensional; 3D) coordinate data in the motion analysis related with physical exercise is classified into two methods: One is to process digital images with a computer, and the other is to draw real time 3D coordinate data using an infrared reflector type. Because 2D or 3D
coordinate data are used in the inverse dynamics analysis, such as joint moment and joint power produced by the musculoskeletal system, depending on study purpose, accurate data collection is important (Nagano and Komura, 2003; Kim et al., 2007). Kinematic data in biomechanics can not only express the state of human motion, but quantify motions generated by internal and external force. Therefore, kinematic data have such merits as the reproduction of physical exercise, and explanation of hypotheses on rehabilitation exercise and orthopedic injury prevention from the more scientific and objective perspective. Kinematic data is actively utilized for motion evaluation and judgment in various fields such as sports, robotics, orthopedics, physical therapy and animation.
A researcher mainly considers accuracy, convenience and economic feasibility in the selection process of software for motion analysis. In the case of using the software used in the field, a more convenient and economically valuable method is judged to be appropriate. As Vicon motion analysis device adopting an infrared reflector type is diffused worldwide, it has placed itself as a gold standard analysis device.
While the importance of motion analysis emerges in the related fields, there are overwhelmingly many hospitals and facilities that cannot adopt high priced analysis devices like Vicon in reality, due to the problems of installation cost and facility size. To solve such problems, previous studies introduced the reliability of motion analysis using the free software, ImageJ (Maeoka et al., 2008; Hayashi and Hongou, 2010). The studies mainly tested digitizing errors between measuring persons, and also the resulting angle differences by computing intra-class correlation coefficients (ICC). However, review on the reliability of the two analysis methods have yet to be carried out. Since the statistical method using ICC has difficulties in detecting fixed bias or proportional bias, there is a report that the method is inappropriate as a method to detect systematic errors that may be caused in the experiment planning and implementation stages (Ludbrook, 2002).
The Bland-Altman method (Bland and Altman, 1986) as a method to detect systematic errors is introduced, and this method has a merit that it can test the error amount and error type, which ICC and correlation coefficients cannot detect. Meanwhile, the Bland-Altman method was introduced for reliability test in a study using ImageJ and OsiriX software to measure the cross sectional area of paraspinal muscle. As a result, very high consistency is reported to be acknowledged between the two types of software (ImageJ and OsiriX) (Fortin and Battié, 2012). As such, ImageJ has been acknowledged in the histology and biology fields a long time ago (Abràmoff et al., 2004), and the frequency of its use is recently on the rise in the muscular physiology field processing ultrasonic images (Kulig et al., 2010; Sisson et al., 2011).
ImageJ has a function to calculate the angle between two segments and a digitizing function to calculate 2D coordinates (X, Y).
Therefore anyone can easily conduct 2D and 3D analyses, if the person understands the basic principle of motion analysis and computation algorithm. In addition, there are programing languages distributed for free including a spreadsheet software recently, and thus maximum effect can be expected with low budget, if such free software is properly used. However, there is no reported study reviewing the reliability of ImageJ for motion analysis use in the academia.
ImageJ is developed as the software for image processing and analysis by the U.S. National Institutes of Health (NIH), and ImageJ is designed with JAVA language, which is advantageous for portability. ImageJ has a merit that it can be used in most operating systems. As mentioned above, however, the application cases of 2D and 3D motion analyses are severely insufficient.
Also, a problem that time efficiency required for the analysis is low is pointed out, since subsequent coordinate data (2D) were not drawn in the previous studies (Maeoka et al., 2008; Hayashi and Hongou, 2010). There are some difficulties to convert into other kinematic variables, and thus the variables that can be drawn is limited. If time-series coordinate data can be drawn, not only sequential joint angles change can be observed, but motions such as the velocity and acceleration of a body segment, and the location of the body center of mass can be more quantitatively described. Furthermore, a kinetic analysis is expected to be carried out. If the economic feasibility and reliability that ImageJ software has is reviewed again, and a new motion analysis methodology can be presented, research development in the relevant fields is conjectured to receive huge help.
This study aims to verify the reliability of ImageJ by judging whether fixed bias and proportional bias exist through the existing method to calculate Pearson product-moment correlation coefficients, and the highly cited Aland-Altman method as a comparative method study in order to statistically identify clearly the consistency of angle calculation results using Vicon-MX System (infrared reflector type) highly recognized worldwide as a motion analysis device and ImageJ.
2. Method
2.1 SubjectsThe subjects of this study were seven female university students without orthopedic diseases related with the measuring items within recent one year (mean age: 22yr, mean height: 160.2cm and mean weight: 49.1kg). Enough explanations on the purpose and details of the experiment were offered to the subjects. Actually, their understanding on the experiment was enhanced, and their consent in writing was received.
2.2 Experimental equipment
The subjects in the experiment conducted the two sets of five times of consecutive jump using a method that does not use buffer action between knees and hip joint fully, maintaining upper body straightened up with putting both hands on the waist, while standing on the force platform (Kistler, type 9865B, Switzerland). The reason why the buffer action between knees and hip joint is restricted fully was that it was an action to ease inconsistency of motions among the subjects. The reason why consecutive jump was limited to five times was that the third and fourth jumps, of which motion is relatively stable, were to be used as analysis data. To calculate the 2D and 3D coordinate values of each segment, 17 anatomical reflective markers (diameter: 14mm) were attached on the positions around pelvis and left and right lower limbs (Figure 1).
A digital video camera (Casio, EX-FH25, Japan) was installed 10m away from the subjects on the right, and consecutive jumping motion was recorded with the sampling frequency of 240Hz. At the same time, ten optical type 3D motion capture systems (Vicon-MX, OxfordMetricsGroup, Oxford, UK) were installed to record reflective markers' position coordinates, and the coordinates were recorded with sampling frequency 250Hz. As for synchronization between motion capture systems and a digital camera, the digital camera was set to record an LED luminous light upon the start of measurement by the motion capture systems using the Figure 1. Description of the anatomical marker position
LED luminous object (DKH, PH-105A, Japan). And then, the images of the digital camera digitized the third jump out of consecutive five jumps, and generated 2D coordinate data by using ImageJ software (ImageJ 1.41, Wayne Rasband, National Institutes of Health, Bethesda, MD) installed on the PC. Meanwhile, the vertical component of ground reaction force (Fz) was used to define each phase from toe-contact to toe-off in the consecutive jump motion (Figure 2).
The definition of toe-contact was decided in 20N and more of ground reaction force, and the definition of toe take-off was decided in less than 20N. As for 2D coordinate data's high frequency noise, the coordinate data were made smooth with the forth-order Butterworth low-pass filter of Winter (2005) via average cut-off frequency 17Hz. Concerning the high frequency noise of 3D coordinate data, smoothing was conducted by setting average cut-off frequency (18Hz) in the same method as the 2D data.
The setting of 2D and 3D coordinate data's optimum cut-off frequency was decided by the method in a study of Yu et al. (1999).
To make the number of sampling consistent between two methods ((Vicon-MX: 1/250sec and digital camera: 1/240sec), each time was normalized from 0% (toe-contact) to 100% (toe-off).
2.3 Data analysis
To obtain 2D coordinate data, this study conducted calibration before and after the experiment by setting 2m reference point at the center of the camera screen (Figure 3). The image of the recorded reference point was converted into 2D coordinate (pixel) through digitizing on the ImageJ software. To convert the obtained pixel coordinate values into actual spatial coordinates, the coefficient was calculated. This is the process to estimate how many meters one pixel on the screen corresponds to.
In this study, the length of one pixel on the screen was 2m/398 pixels = 0.00503m in the Y axis direction, and it was 2m/420 pixels = 0.00476m in the z axis direction. The obtained coefficients (Y = 0.00503, Z = 0.00476) can be converted into the unit of meter from pixel through coefficient x surface marker's digitized value (pixel). Because the coordinate values obtained on the top left corner of the computer screen are the origin, the right is calculated as the normal direction of progressing component (U=Y), and the downward direction is calculated as the normal direction (V=Z) of the vertical component. A 2D motion analysis, however, set the progressing direction as Y axis direction, and the Z axis as the normal direction facing upward from below, and therefore confusion can be blocked in the motion analysis process. This study set the origin of coordinates as the left corner of the force Figure 2. Changes in the vertical ground reaction force (VGRF) during jumping movements
platform. When the origin of coordinates is assumed as u’ = 50 pixels and v’ = 410 pixels, if the coordinate values of the marker m (my, mz) attached to human body are assumed to be located at my = 340 pixels and mz = 240 pixels, the actual spatial coordinates of the marker m on the frame can be calculated in the following method:
m pixel
pixel v
m a
m pixel
pixel u
m a
z z
y y
8092 . 0 00476 . 0 ) 410 240
(
4587 . 1 00503 . 0 ) 50 340
(
' '
A 3D joint angles were calculated as Cardan angles adopting the method of Cole et al. (1993). An angle was defined as the distal segment's direction angle on the proximal segment in the xyz's rotation sequence. Before motion measurement, an L-shaped frame (Vicon-MX, Oxford Metrix Inc, Oxford UK) for calibration to which four reflective markers were attached was accurately installed on the right corner of the force platform, and the global coordinate system (GCS), RG(X,Y,Z), was defined. In addition, this study defined the local coordinate system, RL(x,y,z), located in each segment using the 3D coordinate values of anatomical markers on the global coordinate system (GCS), RG. The calibration to define the local coordinate system, RL(x,y,z), in GCS and each subject's anatomical posture, was arranged in each axis of the GCS, RG(X,Y,Z), using the method of Areblad et al.
(1990).
This study defined the PCS [
i
x'~ k
z'] of each segment (foot, shank, thigh) as the unit vector of segment coordinate system fixed to each segment (Eq. 1). Rotational transformation matrix [RTM] was calculated through inverse matrix ([PCS]-1) of [PCS]multiplying by GCS matrix (Eq. 2). Where, [PCS]-1=[PCS]T, and [PCS]T indicates the transposed matrix of [PCS]. This study located the origin of coordinates of thigh coordinate system, RT(Tx,Ty,Tz), in the center of mass of the thigh segment along the line connecting the hip joint center and knee joint center between the medial and lateral/femoral epicondyles markers.
' ' '
' ' '
' ' '
] [
z z z
y y y
x x x
k j i
k j i
k j i
PCS
(1)Figure 3. A video screen together with an indication of the pixel coordinates used for two dimensional video calibration
1 0 0
0 1 0
0 0 1 ] [ ]
[ RTM PCS
1 (2)Meanwhile, the origin of coordinates of shank coordinate system, RS(Sx,Sy,Sz), was located in the center of mass of the shank along the line connecting ankle joint center. The origin of the foot coordinate system, RF(Fx,Fy,Fz), was located in the center of mass of the foot. Each segment's motion coordinates were defined as follows: As for the thigh coordinate system (TCS), this study defined the vector facing the hip joint from the center of mass of thigh as T , and the vector facing the lateral Z epicondyles marker from the origin as temporary T . This study also decided D T as the cross-product of Y T and Z T , and D decided T from the cross-product of X T and Y T . Concerning the shank coordinate system (SCS), the vector facing the Z knee joint center from the origin of the shank center of mass was defined as S , and the vector facing medial malleolus marker Z on the distal tibia was defined as temporary S . And then, this study decided D S as the cross-product of Y S and Z S , and D ultimately decided SX from the cross-product of S and Y S . Regarding the foot coordinate system, Z RF(Fx,Fy,Fz), this study defined the vector facing the center between first metatarsal and fifth metatarsal bone from the center of mass of foot as F , Y and decided the vector facing the first metatarsal bone from the origin as temporary F . And then this study defined D F as Z the cross-product of F and Y F , and decided D FX as the cross-product of F and Y F (Figure 4). Z
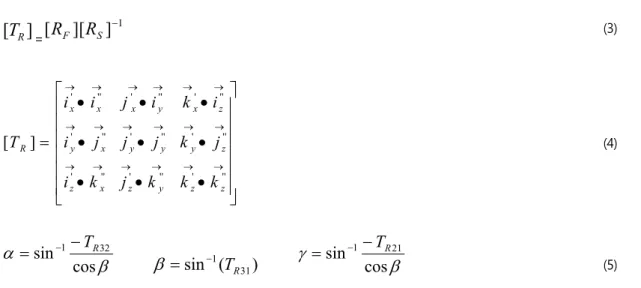
The 3D ankle joint angles were calculated by defining the direction of foot coordinate system,RF(FxFyFz), related to the shank coordinate system, RS(SxSySz). This study calculated the rotation transformation matrix [TR] as the cross product of rotation transformation matrix [RS] of shank, and the rotation transformation matrix [RF]of foot. And thus, this study calculated the dorsiflexion / plantarflexion (α), inversion / eversion (β), and abduction / adduction (γ) angle of ankle joints (Eq.3, 4 and 5). The 3D ankle joint angles were calculated in the same method as above by defining the direction of shank coordinate system, Figure 4. Definitions of local coordinates system on each segment (left panel). The right panel shows the cardan sequence of rotations. (a), (b), and (c) indicate joint angles. The first rotation (α) takes place about the Xr-axis (Dorsi-PlantarFlexion or Flexion- Extension). The second rotation (β) about Y'r-axis leads to new positions of the X'r-axis and Z'r-axis (Inversion-Eversion or Adduction-Abduction). The final rotation (γ) takes place about the Z"r-axis (Adduction-Abduction or Internal-External rotation).
∑S
∑F
) (x y z
S S S S
R , related to the thigh coordinate system, RT(Tx,Ty,Tz) (Figure 3).
]
[ T
R =[ R
F][ R
S]
1 (3)
'' ' '' ' '' '
'' ' '' ' '' '
'' ' '' ' '' '
] [
z z y z x z
z y y y x y
z x y x x x
R
k k k j k i
j k j j j i
i k i j i i
T
(4)
sin
1 cos T
R32
sin
1( T
R31)
sin
1 cos T
R21
(5)
In the meantime, concerning the calculation of 2D joint angles using video image, this study calculated ankle joint's dorsiflexion (+) /plantarflexion (-) angle (θ1) and knee joint's flexion (+)/ extension (-) angle (θ2) (Figure 5 and Eq. 6 and 7). For all data calculations including 2D and 3D joint angles, this study calculated them by the custom made program codes using the Mathematica 4.1 (Wolfram Research Inc., Champaign, IL, USA).
1cos
1 180 /
b a
b
a
(6)
2 cos 1 180/
b a
b
a (7)
Figure 5. Definition of the relative angles of the ankle and knee joints
2.4 Statistical analysis
This study normalized the time-series data (1st take-off → flight phase → contact → 2nd take-off) using the two analysis methods (Vicon-MX and ImageJ) with 0%~100%, respectively (Figure 2). Also, this study processed seven subjects' third jump data out of five times of jump, and generated two sets of normalization data (100×2 sets). The data (0%, 10%, 20%, … , 100%) were re-generated with the gap of 10% in terms of each time-series data for statistical analysis. This study assumed the joint angles calculated from Vicon-MX as the reference values, and carried out the Pearson correlation analysis to test the consistency of the calculated joint angles from ImageJ. To verify the validity of ImageJ, this study checked the status of system bias using the Bland-Altman method. For statistical processing, this study used the statistical analysis system release 9.1.2. (SAS Institute Inc., NC, USA). The significance level used for the test was set at less than 5%.
3. Result
The wave patterns of the mean and standard deviation of joint angles (ankle and knee) calculated with the two analysis methods (Vicon-MX and ImageJ) showed the same pattern overall, and the appearance time of the minimum and maximum values (0~
100%) was consistent mostly (Figure 6).
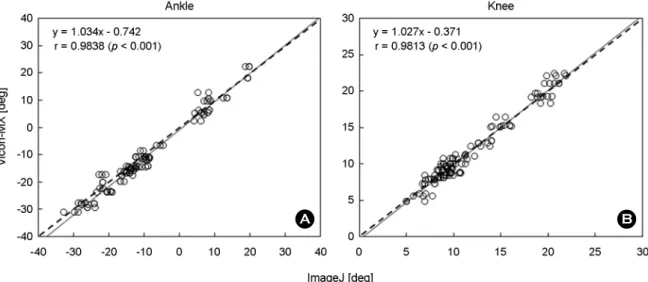
Meanwhile, the plantarflexion angles of ankle joint using ImageJ showed a bit lager angles at about 40~60% than those using Vicon-Mx. However, no big difference was shown by the two methods regarding knee joint. The correlation coefficients between the two methods were r=0.9838 (p<0.001) in the ankle joint angles, and r=0.9813 (p<0.001) in the knee joint angles. In this way, a very high correlation was shown (Figure 7). In other words, given that most data were concentrated on the direct proportion Figure 6. Changes of the ankle (left) and knee (right) angles during jumping movements. Thick solid and dotted line respectively indicate the mean value of Vicon-MX and ImageJ from ground contact to toe-off for each jumping movements. Thin solid and dotted line respectively indicate the standard deviations of two method
line (dotted line) in any joint angles, very similar results of the joint angles using ImageJ were obtained in comparison with the joint angles using the infrared reflector type.
Figure 8 shows the results of the Bland-Altman method to review consistency between Vicon-MX and ImageJ. The bias between Vicon-MX and ImageJ in terms of ankle joint angles was -1.08 ± 2.45°, and the limit of agreement (LOA) of 95% was -5.833 ~ 3.674°. The bias between Vicon-MX and ImageJ in terms of knee joint angles was -0.045 ± 0.925°, and the LOA of 95% was -1.857 ~ 1.767°. The system bias including fixed bias and proportional bias was not found in all items.
Figure 7. Scatter plot and regression line of ImageJ and Vicon-MX. Solid and dotted line respectively indicate regression line and direct proportion line. (A) and (B) indicate ankle and knee joint angle, respectively
A B
Figure 8. Relationship between the residual (difference between ImageJ and Vicon-MX) and the mean jonint angles determined by two methods. The solid line denotes bias (mean of difference) and the two dashed lines denote 95% limits of agreement (LOA)
4. Conclusion
The purpose of this study is to present a new analysis method that can help motion guidance and prescription mainly related with exercise in the sports science, rehabilitation and medical science fields, and evaluate the method. This study calculated 2D joint angles (ankle joint and knee joint) using the free software ImageJ, and simultaneously drew the 3D coordinate data of the same motions using the infrared reflector type Vicon-MX system, which is highly reliable as a motion analysis device, and calculated angles. This study also evaluated the differences of angles on the movement in the sagittal plane (flexion / extension) between the two methods mentioned above.
Consequently, the same pattern was shown in two joint angles overall, and a high correlation was revealed statistically. However, the joint angles calculated by the two methods did not perfectly match. Namely, the regression line was not accurately consistent with the direct proportion line in the distribution of joint angles using ImageJ as x axis, and of joint angles using Vicon-MX as y axis, although it is ideal that data are consistent at the direct promotion line (dotted line). The error that may be generally caused in the 2D analysis can be pointed out as a reason.
First, in the 2D analysis, each segment assumes the projected state on the same sagittal plane, and independent rotating components (transverse plane and frontal plane) between segments are not considered. In other words, when one segment out of two segments moves towards the direction of camera, or moves to the opposite direction, the actual motion between segments has 3D factors; however, it is processed as 2D on the screen, and therefore an accompanied error can be a cause of such a phenomenon. This study assumed a jump motion as an exercise done at the 2D plane (sagittal plane). This study set the camera position, based on the calibration device in the lab, to set the motion direction of an object and the camera's position at the right angle of 90°. However, as mentioned above, the design of an experiment taking into account all rotating components of human body is impossible, although camera's position is precisely installed at the right angle of 90° on the object's motion direction.
Therefore, errors are considered to be minimized by carrying out 3D motion analysis, rather than 2D motion analysis, to solve such general problems.
Second, there is a refraction phenomenon that may be caused by camera lens' optical feature. On a general lens, refraction is caused to an object, as a movement goes outward from the camera optic axis. In consideration of such a lens' feature, the 2D experiment secured enough distance between an object and a camera, and used the camera equipped with a high performance zoom function and lens, which can solve the problem to some degree that can be caused by refraction. This study actually used a general digital camera, and motion measurement was conducted inside of a lab, and therefore there was no extra space that can ensure enough distance between the object and camera. This study excluded the outward motion hugely deviating from the lens center out of jump motions from the analysis data.
A problem that may be caused from the digitizing process to calculate 2D coordinates of markers as the last error can be pointed out. Griffiths (2006) reported the accuracy of digitizing work can hugely affect coordinate values, and that a coordinate error can be linked with the error of segment center position, and that has an enormous impact on joint moment values (Lafortune et al., 1992; Holden and Stanhope, 1998; Piazza et al., 2001). Because an error that may be caused in digitizing work can be assumed as a human error related with the brightness of an image, distance from an object, focus and camera speed, the degree of error is judged to be different depending on the skillfulness of the researcher. Previous studies reported that image processing of the same motions targeting the same subjects by different examiners may affect the results according to the skillfulness of analysis (Maeoka et al., 2008; Hayashi and Hongou, 2010). Individual subjective judgements on marker's position, camera's position and marker tracing process in digitizing work can be different. However, this study minimized errors that may be caused by subjective judgments through performing the experiment ranging from experimental preparations to data analysis by the same examiner in order to solve such a problem.
This study used the Bland-Altman method to consider the reliability of the two methods. In the previous studies using the Bland-Altman method confirmed very high consistency between the two types of software as a result of measuring the cross sectional area of paraspinal muscle calculated from the two types of software (ImageJ and OsiriX). These studies implied the possibility and usefulness in terms of the use of ImageJ (Fortin and Battié, 2012).
If the results obtained from the two methods mentioned above are perfectly consistent, Y axis (Vicon-MX - ImageJ) becomes zero (0). Therefore the Bland-Altman Plot will demonstrate the distribution concentrated on X axis. When fixed bias is caused, Bland-Altman Plot shows the distribution concentrated on a specific one direction between positive or negative direction from X axis. When proportional bias is caused, Bland-Altman Plot demonstrates a fan shape distribution in which the distribution hugely spreads to the right direction. This study, however, could not observe such characteristics (fixed bias and proportional bias) in all items, and all the data showed the distribution concentrated within 95% of LOA. From this, the validity of ImageJ is regarded to be validated again. The results in this study are expected to be applied in the reality that no study on motion analysis can be found.
As stated above, Vicon-MX adopting the infrared reflector type has merits that it is not affected by the limitation of object and camera positions in the three-dimensional space and that human errors can be minimized, because there is no digitizing work to bring images to a PC. Experiment participants can take their desired motions freely, and Vicon-MX can capture any motions in very detail; therefore the precise 3D coordinates of each marker can be obtained through global coordinate system. Because the Vicon-MX system used in this study can generate the 3D coordinates of each marker simultaneously with motions, it has a key advantage that time spent for data analysis and evaluation can be reduced. Given that the system price is quite high, fully advantaging the merits of 2D video analysis carried out in this study can be one solution. This study ascertained that there was no big differences in wave pattern appearing time and the curve of joint angles (ankle and knee) calculated through the two analysis methods (Vicon-MX and ImageJ) considering such merits and demerits. The validity of such a result was proved in terms of statistics. Although the two methods' coordinates (2D and 3D) calculation and angle calculation processes are different, their basic principles are considered consistent in theory.
Even though some errors were caused in the results of this study, those errors were not conjectured to affect the evaluation and effect judgment in the relevant fields, in view of the limitations of 2D analysis. The fact that PCs for home use are supplied to markets at cheap prices, and that they embody fast processing speed, compared with prices, is actually important. As low priced digital camera' performance has greatly improved, a camera enabling high-speed photography exceeding 500 frames per second is forecast to be released in the markets. In this regard, efficiency enhancement, compared with price, can be expected by adequately using the software offered for free, and the software is predicted to be used as an objective examination tool in the relevant fields. Such a free software can offer an opportunity to researchers, whose economic situation is not affluent, to expand software selection scope for analysis. To students majoring in the related disciplines, such a free software is expected to be usefully utilized for field education including clinical practice education.
References
Abràmoff, M.D., Magalhães, P.J. and Ram, S.J., Image processing with ImageJ, Biophotonics International, 11(7), 36-42, 2004.
Areblad, M., Nigg, B.M., Ekstrand, J., Olsson, K.O. and Ekström, H., Three-dimensional measurement of rearfoot motion during running, Journal of Biomechanics, 23(9), 933-940, 1990. doi: 10.1016/0021-9290(90)90358-A
Bland, J.M. and Altman, D.G., Statistical methods for assessing agreement between two methods of clinical measurement, Lancet, 1(8476), 307-310, 1986. doi: 10.1016/S0140-6736(86)90837-8
Cole, G.K., Nigg, B.M., Ronsky, J.L. and Yeadon, M.R., Application of the joint coordinate system to three-dimensional joint attitude and movement representation: A Standardization proposal, Journal of Biomechanicalengineering, 115(4A), 344-349, 1993.
doi: 10.1115/1.2895496
Fortin, M. and Battié, M.C., Quantitative paraspinal muscle measurements: Inter-software reliability and agreement using OsiriX and ImageJ, Physical Therapy, 92(6), 853-864, 2012. doi: 10.2522/ptj.20110380
Griffiths, I.W., Principles of biomechanics & motion analysis, Philadelphia, Lippincott Williams & Wilkins, 2006.
Hayashi, M. and Hongou, Y., Examination of the reliability of joint angle measurements using Image-J: Errors involving rotation, Rigakuryoho Kagaku, 25(4), 529-532, 2010. doi: 10.1589/rika.25.529
Holden, J.P. and Stanhope, S.J., The effect of knee center location estimates on net knee joint moments, Gait and Posture, 7(1), 1-6, 1998. doi: 10.1016/S0966-6362(97)00026-X
ImageJ Home Page, http://imagej.nih.gov/ij/index.html (retrieved June 19, 2014).
Kim, H.Y., Sakurai, S. and Ahan, J., Errors in measurement of center of pressure (CoP) computed with force plate affect on 3D lower limb joint moment during gait, International Journal of Sport and Health Science, 17, 71-82, 2007. doi: 10.5432/ijshs.5.71
Kulig, K., Harper-Hanigan, K., Souza, R.B. and Powers, C.M., Measurement of femoral torsion by ultrasound and magnetic resonance imaging: Concurrent Validity, Physical Therapy, 90(11), 1641-1648, 2010. doi: 10.2522/ptj.20090391
Lafortune, M.A., Cavanaugh, P.R., Sommer III, H.J. and Kalenak, A., Three-dimensional kinematics of the human knee during walking, Journal of Biomechanics, 25(4), 347-357, 1992. doi: 10.1016/0021-9290(92)90254-X
Ludbrook, J., Statistical techniques for comparing measurers methods of measurement: a critical review. Clinical and Experimental Pharmacology and Physiology, 29(7), 527-536, 2002. doi: 10.1046/j.1440-1681.2002.03686.x
Maeoka, H., Fukumoto, T., Sakaguchi, A. et al., Reliability of a software ImageJ in motion measurement use of sit-to-stand movements, Rigakuryoho Kagaku, 23(4), 529-533, 2008. doi: 10.1589/rika.23.529
Mathematica Home Page, http://www.wolfram.com/mathematica/ (retrieved October 3, 2014).
Nagano, A. and Komura, T., Longer moment arm results in smaller joint moment development, power and work outputs in fast motions, Journal of Biomechanics, 36(11), 1675-1681, 2003. doi: 10.1016/S0021-9290(03)00171-4
Piazza, S.J., Okita, N. and Cavanagh, P.R., Accuracy of the functional method of hip joint center location: effects of limited motion and varied implementation, Journal of Biomechanics, 34(7), 967-973, 2001. doi: 10.1016/S0021-9290(01)00052-5
SAS Home Page, http://www.sas.com/en_us/home.html (retrieved October 3, 2014).
Sisson, L., Croy, T., Saliba, S. and Hertel, J., Comparison of ankle arthrometry to stress ultrasound imaging in the assessment of ankle laxity in healthy adults, International Journal of Sports Physical Therapy, 6(4), 297-305, 2011.
Winter, D.A., Biomechanics and motor control of human movement, 3rd ed, New Jersey. John Wiley and Sons, 2005.
Yu, B., Gabriel, D., Noble, L. and An, K.N., Estimate of the optimum cutoff frequency for the Butterworth low-pass digital filter, Journal of Applied Biomechanics, 13, 318-329, 1999.
Author listings
Heung Youl Kim: [email protected]
Highest degree: PhD, Department of Health and Sport Sciences, Chukyo University
Position title: Associate Professor, Department of Policy Studies, Nanzan University, Visiting Researchers, Section of NILS-LSA (National Institute for Longevity Sciences-Longitudinal Study of Aging), National Center for Geriatrics and Gerontology
Areas of interest: Biomechanics, Epidemiology, Gait Analysis