MACRO-SHEAR BOND STRENGTH AND MICRO- SHEAR BOND STRENGTH OF CEROMER BONDED TO METAL ALLOY AND FIBER REINFORCED
COMPOSITE
Hyung-Yoon Park1, D.D.S., M.S.D., Lee-Ra Cho1, D.D.S., M.S.D., Ph.D., Kyung-Mo Cho2, D.D.S., M.S.D., Ph.D., Chan-Jin Park1, D.D.S., M.S.D., Ph.D.
1Department of Prosthodontics, 2Department of Conservative Dentistry,
College of Dentistry and Research Institute of Oral Science, Kangnung National University
Statement of problem. According to the fracture pattern in several reports, fractures most fre- quently occur in the interface between the ceromer and the substructure.
Purpose. The aim of this in vitro study was to compare the macro shear bond strength and micro- shear bond strength of a ceromer bonded to a fiber reinforced composite (FRC) as well as metal alloys.
Material and methods. Ten of the following substructures, type II gold alloy, Co-Cr alloy, Ni- Cr alloy, and FRC (Vectris) substructures with a 12 mm in diameter, were imbedded in acrylic resin and ground with 400, and 1, 000-grit sandpaper. The metal primer and wetting agent were applied to the sandblasted bonding area of the metal specimens and the FRC spec- imens, respectively. The ceromer was placed onto a 6 mm diameter and 3 mm height mold in the macro-shear test and 1 mm diameter and 2 mm height mold in the micro-shear test, and then polymerized. The macro- and micro-shear bond strength were measured using a universal testing machine and a micro-shear tester, respectively. The macro- and micro-shear strength were analyzed with ANOVA and a post-hoc Scheffe adjustment (α= .05). The fracture surfaces of the crowns were then examined by scanning electron microscopy to determine the mode of failure. Chi-square test was used to identify the differences in the failure mode.
Results.The macro-shear strength and the micro-shear strength differed significantly with the types of substructure (P<.001). Although the ceromer/FRC group showed the highest macro- and micro-shear strength, the micro-shear strength was not significantly different from that of the base metal alloy groups. The base metal alloy substructure groups showed the lowest mean macro-shear strength. However, the gold alloy substructure group exhibited the least micro-shear strength. The micro-shear strength was higher than the macro-shear strength exclud- ing the gold alloy substructure group. Adhesive failure was most frequent type of fracture in the ceromer specimens bonded to the gold alloys. Cohesive failure at the ceromer layer was more common in the base metals and FRC substructures.
Conclusion.The Vectris substructure had higher shear strength than the other substructures.
Although the shear strength of the ceromer bonded to the base metals was lower than that of the gold alloy, the micro-shear strength of the base metals were superior to that of the gold alloy.
Key Words
Macro-shear bond strength, Micro-shear bond strength, Ceromer, Fiber-reinforced composite J Korean Acad Prosthodont : Volume 42, Number 6, 2004
T
he ceramic optimized polymer (ceromer)/fiber-reinforced composite (FRC) system is com- posed of a load bearing fiber framework and a veneering composite filled with a large number of ceramic particles.1Clinical studies on fiber- reinforced restorations have shown a relatively high success rate over a relatively short term evalua- tion period.2,3
One of the ceromer/FRC systems currently available is the Targis/Vectris (Ivoclar, Schaan, Liechtenstein) system that was introduced in 1996.4Targis, which is a second generation com- posite material, contains a silanated microhy- brid inorganic filler embedded in a light poly- merizing organic matrix to improve the mechan- ical properties.1Vectris, which is a preimpregnated glass fiber with 3 different shapes, is formed by vacuum/pressure adaptation.4This system is purported to provide metal-free restorations that have similar mechanical properties to dentin, excellent aesthetics, ease of fabrication and repair, and are biocompatible.1
Combining the use of a ceromer over a metal sub- structure also could be available. The method of ceromer bonding to the metal alloy was used mainly to mask the metals such as those in the dou- ble crown removable partial dentures and resin bonded fixed partial dentures. When a ceromer material is used to veneer a metal alloy, frequent re-fabrication is needed as a result of fracture. Both chemical and mechanical bonding techniques have been proposed to avoid a detachment of the ceromer materials from the alloys.5,6The former is comprised of functional monomers that are contained in resin or surface conditioning mate- rials, whereas the latter includes retentive beads and air-abrasion with aluminium oxide.7
Restoration failure when using a ceromer/FRC has been reported by several authors.8In their study that followed up 41 posterior FRC inlay fixed partial denture (FPD) for 4 years, Monaco et al.9
reported the causes of restoration failure to be veneer fracture in 5%, color match failure in 29%, surface texture failure in 12%, and discol- oration in 4%. Behr et al.10reported that veneer frac- ture occurred in 36% of FPDs after using 38 inlay FPDs and single molar crowns for 4.4 years.
Considering the fact that the veneer fracture is a failure in the interface of a veneer material and sub- structure, it appeared that there is a problem with the bonding strength of the ceromer and FRC despite having a similar matrix composition each other.
A variety of tests for measuring the bond strength of veneer-substructure systems have been advocated. The bonding strength between two substances is measured using indices such as the tensile bond strength, the shear bonding strength, and the flexural bond strength.11The ten- sile bond strength is gained by measuring the ten- sion in a body when it is subjected to two set of forces that are directly away from each other.
Shear is the result of two sets of forces directed par- allel to each other. The flexural bond strength is measured with a 3-point bending or 4 point- bending test using a brittle material. None can be regarded as providing an exact measure of the adhesion of the veneer to substructure. Shear bond testing has been widely used mainly because of its simplicity such as the ease of specimen preparation, simple test protocol and the ability to rank different products according to bond strength values.12,13
There are several factors affecting the bond strength between the veneer-substructure, such as the type of the substructure, the treatment method for the substructure, the type of the veneer material, the bonding technique, and the experimental conditions.5-10Many studies on the bond strength between metal and resin have been conducted. Chang et al.14reported that the tensile bond strength between the resin and Au- Pa alloy was 13 MPa. It is known that the shear
bond strength between the resin and Ni-Cr ranges from 10 to 18 Mpa.15-17Kim et al.18reported that the shear bond strengths between various resins and Co-Cr alloy range from 10 to 20 MPa, and Pesun et al.19reported them to be 11-17 MPa.
There have been few reports on the shear strength of the ceromer bonded to different substructure.
Almilhatti et al.7reported that the shear bond strength between Targis and Ni-Cr was 12 MPa.
Yoon et al.20stated that the shear bond strength was 14 to 20 MPa, whereas the shear bond strength of the metal alloys differed according to the com- bination between the metal alloy and the ceromer.
However, there is some question as to its valid- ity since previous conventional shear bond strength tests have several problems. The con- ventional shear bond test uses mixed mode load- ing, in which the shear and tensile forces are induced during the test. Furthermore, there is a problem with stress concentrations at the point of loading.21Tantbirojn et al.22addressed the inca- pability of the discriminating the bonding state in the conventional shear test. Several alternative tests aimed at overcoming the difficulties inherent in the conventional shear test have been suggested.
McDonough et al.21 proposed the use of the micro-bond test to assess the strength and dura- bility of the interface. They suggested the micro- shear bond test could be a useful tool to understand the complex interactions that occur at the interface between the two materials.
Therefore, the main purpose of this experi- ment was to compare the macro-shear bond strengths and the micro-shear bond strengths of the ceromer bonded to the metal alloy surfaces and FRC surface.
MATERIAL AND METHODS
Cylinders of the dental composite resin were bonded to a prepared substructure surface, the macro-shear and micro-shear was tested at a
specified rate, and the interfacial bond strengths were calculated.
Macro-shear bond testing
Twenty button shaped wax patterns (Baseplate wax, Kim’s International, Seoul, Korea) were formed in an acryl mold, 12mm in diameter and 3mm in length. All the wax specimens were invested under vacuum with a complete invest- ment (Micro-Fine 1700, Talladium, Valencia, USA). After burnout at the temperatures specified by the manufacturer, the specimens were cen- trifugally cast in metal alloys according to the man- ufacturer’s instructions; Co-Cr alloy (Biosil, Degussa Dental, Postfach, Germany), Ni-Cr alloy (Rexillium III, Pentron, Wallingford, USA) and type II gold alloy (A48; AlphaDent, Seoul, Korea).
The alloy was melted with a gas-oxygen multi-ori- fice torch. The remaining parts of the invest- ment were removed by sandblasting with 110μm aluminum oxide. The disk area of the test surface of each specimen was calculated using the mean of three measurements made at separate locations with an accuracy of 0.01mm.
Ten FRC specimens were fabricated using an acryl mold with the same dimensions. Layers of the Vectris Pontic were placed into the acryl mold and light-polymerized for 10 minutes under a vacuum/pressure (1.5 psi) (Vectris VS1 unit, Ivoclar, Schaan, Liechtenstein; contains two 65W halogen bulbs). The polymerized fiber frame- work was removed from the acryl mold. The framework was then trimmed to ensure that each group had the same dimension as the met- al disc. Metal specimens and FRC specimens were embedded in a 20 × 20 × 5 mm autopoly- merizing acrylic resin (Orthojet, Lang dental Mfg. Wheeling, USA).
After polymerization, metal surfaces were ground on an Automet grinder/polisher (Buehler Ltd, Evanston, USA). The initial rough grind- ing was accomplished with 400 grit sandpaper, fol-
lowed by polishing with 1,000 grit sandpaper. The metal and FRC surfaces were air abraded for 5 sec- onds with 50 μm aluminum oxide, steam cleaned for 5 seconds, washed under running tap water, and then dried with oil-free compressed air until complete dry.
The metal primer (Targis link; Ivoclar, Schaan, Liechtenstein) was applied to the pretreated bonding area of the metal specimens, and dried for 1 minute as recommended by the manufacturer.
The FRC specimens received a coating of a wet- ting agent (Vectris wetting agent; Ivoclar, Schaan, Liechtenstein) with a single brush application, which was allowed to dry for 1 minute.
Thereafter, the ceromer was applied to a 6 mm diameter and 3 mm height mold positioned on the bonding surface of the substructure. Two layers of the 1.5 mm ceromer were incrementally pre- polymerized using a halogen light source (180 mW/cm2at a 10 mm distance) (Targis Quick;
Ivoclar, Schaan, Liechtenstein) for 10 seconds.
The specimens were post-polymerized in a Targis Power Oven (Ivoclar, Schaan, Liechtenstein) using Program 1 at 90℃ for 25 minutes. After poly- merizing the ceromer, the acryl mold was carefully removed. The specimens were then stored in a dark room at 25℃ for 24h until they were tested.
The macro-shear bond strength tests were per- formed with a universal testing machine (Zwick 010; Ulm, Germany) with a pushing device used at a crosshead speed of 1.0 mm/min until fracture.
The shear bond strengths were calculated accord- ing to the formula: B = F/S. (B: shear bond strength (MPa), F: load at fracture (N), and S: bond- ed surface area (mm2).
Micro-shear bond testing
Three types of substructures (10 specimens for each), 6mm in diameter and 3mm in length, were fabricated and pre-treated with the same method described previously. Subsequently, a thin layer of Targis was light polymerized. Targis
was subsequently filled into an iris cut from microbore Tygon tubing (TYG-030, Small Parts Inc., Miami Lakes, USA) with an internal diameter approximately 1.0mm and a height of 2.0mm. The iris was held firmly on the surface using a double- sided tape to prevent the ceromer from seeping away from the defined area at the base. After this step, the ceromer was polymerized. Thereafter, the Tygon tubing was removed. All samples were checked for bonding defects using an optical microscope (×30). The samples that showed an apparent interfacial gap formation, bubble inclu- sion, or other obvious defects were excluded from this study.
The ceromer-substructure bonds were subse- quently broken by the micro-shear testing. The test device was suspended on a rod that was connected to a load cell (EZ test; Shimadzu Co., Japan).
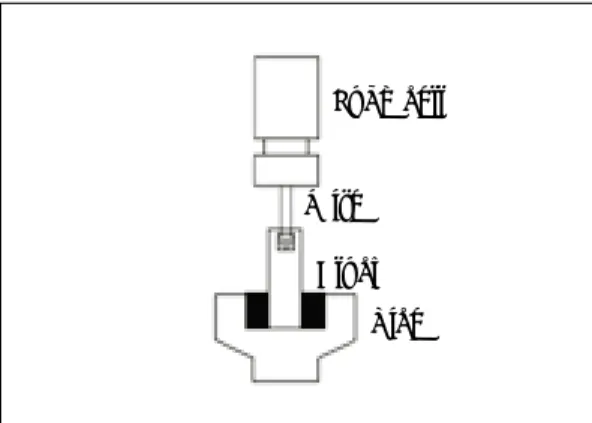
The 0.02 mm ligature wire (Tomy International, Inc., Tokyo, Japan) of the micro-shear apparatus was hooked around the cylinder of the ceromer to be tested (Fig. 1). The wire tension was controlled so as not to introduce pulling forces before the micro-shear test. During the test, the ligature wire of the ceromer was pulled from the sub- structures at a rate of 1.0mm/min. The change in the load as a function of time was recorded on a
Fig. 1. Schematic diagrams of the micro-shear strength.
Load cell
Wire
Block Vice
computer and the shear strength was calculated from the equation, τ=F/(φR2), where τwas the interfacial shear strength, F was the load at fail- ure and R was the radius of the ceromer cylinder.
Fracture mode
After testing, all the specimens were exam- ined using a stereomicroscope (SZH-ILLB, Olympus Optical Co., Tokyo, Japan) at x 10 mag- nification to analyze the pattern of failure. The frac- ture modes were divided into the adhesive frac- ture and cohesive fracture groups. The former was a failure in the interface between the veneer material (Targis) and the substructures. The lat- ter was classified as a fracture in the veneer material or in the substructures. Subsequently, the fracture surface of the specimens was examined by scanning electron microscopy (SEM, LEO 420; LEO LTD, Cambrige, UK) to investigate the surface morphology at the failure site.
Statistical analysis
The macro- and micro-shear strengths were analyzed using one-way ANOVA to determine if
significant differences existed at the 95% confidence level. When the differences were significant, a mul- tiple comparison test was performed using the Scheffe’s method. Statistical analyses within the groups with regard to the test methods (macro- and micro- shear strength) were made using Student’s t-test. The results of the fracture patterns of each group were analyzed with nonparamet- ric chi-square test.
RESULTS
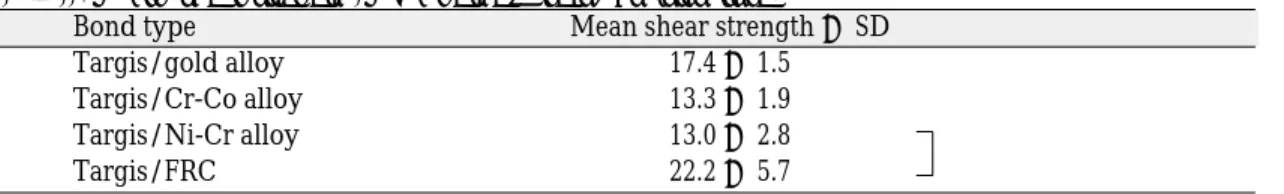
The macro-shear strength differed significant- ly with the types of substructure (P<.001, Table I).
The macro-shear strength of the Targis/Vectris group (22 Mpa) was significantly higher than that of any other group (P<.001) (Table II). The base metal substructure groups showed the lowest mean shear strength regardless of the type of alloy.
The micro-shear strength of the substructures also differed significantly (P<.001, Table III). Although the Targis/Vectris groups showed the highest micro-shear strength (25 Mpa), it was not sig-
Table I. Analysis of variance for the macro-shear strength.
Sum of squares Df Mean Square F Sig.
Between Groups 1159.742 3 386.581 16.012 .000
Within Groups 869.181 36 24.144
Total 2028.923 39
Table II. Macro-shear strength (MPa) of the Targis/ Substructure.
Bond type Mean shear strength ± SD
Targis/gold alloy 17.4 ± 1.5
Targis/Cr-Co alloy 13.3 ± 1.9
Targis/Ni-Cr alloy 13.0 ± 2.8
Targis/FRC 22.2 ± 5.7
Shear strength joined by vertical lines are significantly different from each other (P<.05)
nificantly different from the Targis/base metal alloys (P=.326, Table IV). The gold substructure group (17.4 Mpa) exhibited the lowest micro- shear strength. The micro-shear strength was higher than the macro-shear strength with the exception the gold substructure group. In par- ticular, the micro-shear strength of the Cr-Co substructure group was significantly higher than the macro-shear strength (P=.000).
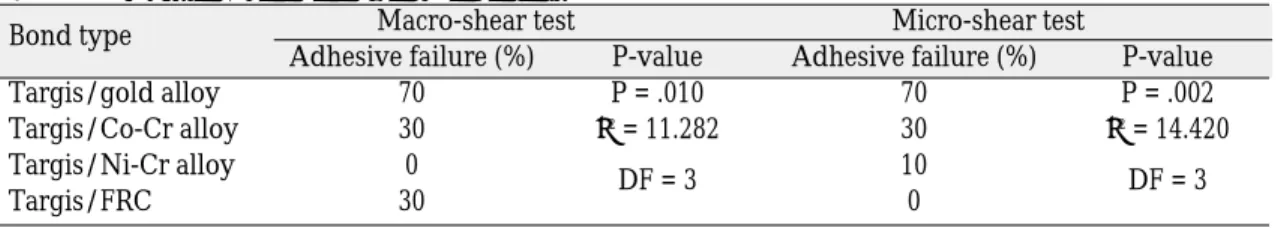
The results of the failure mode are shown in Table V. Nonparametric chi square test for both the macro-shear and micro-shear strength showed that there were significant differences in the fail- ure patterns among the 4 groups. Adhesive fail- ure was most frequent in the ceromer specimens
bonded to the gold alloys. Three and none of the ten ceromers bonded to the FRC exhibited adhesive failure in the macro-shear test and the micro-shear test, respectively.
Figure 2 shows the SEM images of fractured interface between the veneer and the substructures.
Because all images were taken at the outer bound- ary of the ceromer, the left side indicated the substructure and the right side indicated the remnant of the ceromer. The alloy substructures exhibited a crystalline structure. After comparing the gold alloys substructure, the Ni-Cr alloy and Cr-Co alloy substructure showed a mainly cohe- sive failure pattern.
Table III. Analysis of the variance for the micro-shear strength.
Sum of squares Df Mean Square F Sig.
Between Groups 907.657 3 302.552 6.783 .001
Within Groups 1605.865 36 44.607
Total 2513.521 39
Table IV. Micro-shear strength (MPa) of the Targis/Substructure.
Bond type Mean micro-strength ± SD
Targis/gold alloy 16.3 ± 3.9
Targis/Co-Cr alloy 20.2 ± 5.8
Targis/Ni-Cr alloy 20.9 ± 4.6
Targis/FRC 25.2 ± 4.4
Micro-shear strength joined by vertical lines are significantly different from each other (P<.05)
Table V. Fracture mode after the loading test.
Bond type Macro-shear test Micro-shear test
Adhesive failure (%) P-value Adhesive failure (%) P-value
Targis/gold alloy 70 P = .010 70 P = .002
Targis/Co-Cr alloy 30 χ2= 11.282 30 χ2= 14.420
Targis/Ni-Cr alloy 0
DF = 3 10
DF = 3
Targis/FRC 30 0
DISCUSSION
The macro-shear bond strength was the highest in Vectris, followed by the gold alloy and base met- al alloy. Otherwise, the micro-shear bond strength was higher in the base metal alloy compared to the gold alloy. Adhesive failure occurred in 70% of all gold samples when conducting the macro-shear bond test and the micro-shear bond test. The frequency of adhesive failure in the Ni-Cr alloy or Vectris was relatively low. Considering that the adhesive failure is an indirect index of the shear bond strength between the veneer and sub- structure, frequent adhesive failure suggests low bond strength. These results overall suggest that
the micro-shear bond test is more accurate in showing the bond strength of the interface.
Furthermore, the micro-shear strength was high- er than the macro-shear strength in all substruc- tures except for the gold alloy. It appeared that these results were brought about from the fact that the tensile force would participate to accelerate fail- ure in the later loading time of the macro-shear test.
Therefore, the bond strength per area would be higher in the micro-shear test than the macro- shear test.
The macro-shear bond strength was lower in the base metal alloy (13 MPa) compared to the gold alloy (17 MPa) in this study, which is similar to that reported by Laufer et al.23However, Yoon et al.20 Fig. 2. Typical scanning electron microscopic views of the ceromer bonded to four substructures. (A) Adhesive fail- ure in the interface between the ceromer and the gold alloys. (B) Cohesive failure at the ceromer bonded to the Ni- Cr alloys. (C) Cohesive failure at the ceromer bonded to the Co-Cr alloys. (D) Cohesive failure at the ceromer bond- ed to the FRC substructure. (Original magnification ×300).
reported that the shear strength of the Ni-Cr alloy was higher than that of the gold alloy.
Rubo et al.24also reported that the bond strength was the highest in the Ni-Cr alloy, followed by the Ag-Pd alloy and the gold alloy. These results are consistent with the rank of the micro-shear strength found in this study. Overall, although the bond strength of the veneer and the substructures differed according to the testing conditions, the test method would also affect the data according to the results of this study.
Both the Vectris and Targis contain Bis-GMA and decandiol in the matrix.1Therefore, it was expect- ed that they would have higher bond strengths than the other substructures. However, no sta- tistically significant difference was observed in the micro-shear bond strength compared to that of the base metal alloy, which suggested that the veneer failure was due to low bond strength. In addition, interface failure in the Targis/Vectris crown and Targis cleavage from Vectris in a previous study25,26 were probably due to the lower bond strength than was expected.
In this study, all the substructures were sand- blasted to give the same surface treatment. This treatment could work to lower the bond strength by removing the oxygen inhibition layer, a layer with several microns that develops from oxy- gen in the air binding with the monomer on the composite resin surface. This layer does not com- pletely undergo polymerization even with light polymerizing. Therefore, this layer becomes the layer where additional composite resin could chemically adhere.27 The removal of this layer by sandblasting could be a factor in lowering the bonding strength of the Targis/Vectris.
Moreover, a metallic oxide would form a thin and dense layer in noble metal alloys so that the bond strength would deviate slightly and have a high reliability. On the other hand, in the Cr alloy, Cr has a high oxidative power, which means that a thick oxide layer usually results. It
was reported that the bond strength would decrease as the thickness of the metallic oxide lay- er would increase.20 The bonding area of the sample used in the micro-shear test was small in this study. Therefore, it appears that the micro- shear strength in the base metal was higher com- pared to the macro-shear strength, because the effect of the thick oxide layer decreased.
The bonding technique also affected the study result. In the macro-shear test, one layer of Targis, which was approximately 1.5 mm was firstly light polymerized and the other 1.5 mm was then polymerized in order to build-up a 3 mm thickness. On the other hand, in the micro-shear test, the sample thickness (2 mm) was small so that one thin Targis layer was polymerized and the rest was built-up. In other words, the bond strength of the interface was affected since polymerization contraction of the thin Targis layer was less than that of the thick macro-shear bond strength (1.5 mm) for the micro-shear bond strength.
It is also known that the type of veneer mater- ial would also affect the bond strength resulting in different bond strengths according to the com- bination of ceromer/metal alloy.6,13-19However, in this study, only one veneer material was used to obtain more conclusive results.
The limitation of this study was the fact that a static test was performed in a dry environment.
Water would be constantly present in the actual oral environment, which would undergo repeat- ed temperature and pH changes. According to most studies on the bond strength, the actual bond strength would be lower than expected since the bond strength would decrease further with thermocycling or artificial aging.28
Despite this limitation, the macro-shear bond strength and micro-shear bond strength of vari- ous substructures and interfaces were tested and compared. The results of this study showed that the micro-shear bond strength would be a better method for reflecting the bond strengths of the two
materials. Furthermore, the bond strength of the Targis bonded to the gold alloy was too weak, which means that new methods will be needed to improve the strength. In addition, the bond strength of the Targis/Vectris having the same matrix was not that high compared to the theo- retical bond strength. Therefore, these results might explain the mechanism of various types of failure that occur in actual clinical situations.
CONCLUSION
Based on the conditions in this in vitro study, it was concluded that the type of substructure has an influence on the shear strength of ceromer/sub- structure. The Vectris substructure had higher shear strength than the other substructures. The shear strength was different from the micro-shear strength in the same veneer/substructure group.
Although the shear strength of the ceromer bond- ed to the base metals was lower than the gold alloy, the micro-shear strength of the base metals was superior to the gold alloy. Cohesive failure in the ceromer layer was more frequent in the FRC substructure while adhesive failure was dominant in the alloy substructures.
REFERENCES
1. Touati B, Aidan N. Second generation laboratory composite resin for indirect restorations. J Esthet Dent 1997;9:108-18.
2. Go¨hring TN, Mo¨rmann WH, Lutz F. Clinical and scanning electron microscopic evaluation of fiber reinforced inlay fixed partial dentures: Preliminary results after one year. J Prosthet Dent 1999;82:
662-8.
3. Altieri JV, Burstone CJ, Goldberg AJ, Patel AP.
Longitudinal clinical evaluation of fiber-rein- forced composite fixed partial dentures: a pilot study. J Prosthet Dent 1994;71:16-22.
4. Krejci I, Boretti R, Lutz F, Giezendanner P. Adhesive crowns and fixed partial dentures of optimized com- posite resin with glass fiber-bonded framework.
Quint Dent Tech 1999;22:107-27.
5. Choi NJ, Vang MS. The effects of metal surface treat- ment on bond strength between resin and metal in- terface of resin veneerd crown. J Korean Acad
Prosthodont 1994;34:471-83.
6. Martin J, LeBeau S. The best of both worlds: com- bining metal and ceromer for clinical success.
Dent Today 2000;19:88-9.
7. Almilhatti HJ, Giampaolo ET, Vergani CE, Machado AL, Pavarina AC. Shear bond strength of aes- thetic materials bonded to Ni-Cr alloy. J Dent 2003;31:205-11.
8. Freilich MA, Meiers JC, Duncan JP, Eckrote KA, Goldberg AJ. Clinical evaluation of fiber-rein- forced fixed bridges. J Am Dent Assoc 2002;133:
1524-34.
9. Monaco C, Ferrari M, Miceli GP, Scotti R. Clinical evaluation of fiber-reinforced composite inlay FPDs. Int J Prothodon 2003;16:319-325.
10. Behr M, Rosentritt M, Handel G. Fiber-reinforced composite crowns and FPDs: a clinical report. Int J Prothodont 2003;16;239-43.
11. Cesar PF, Meyer Faara PM, Miwa Caldart R, Gastaldoni Jaeger R, da Cunha Ribeiro F. Tensile bond strength of composite repairs on artglass using different surface treatments. Am J Dent 2001;14:373-7.
12. Craig RG. . Powers J M. Restorative dental mate- rials. 11th ed. St. Louis: CV Mosby 2002 54-71.
13. Nakamura T, Waki T, Kinuta S, Tanaka H. Strength and elastic modulus of fiber-reinforced composite used for fabrication FPDs. Int J Prothodont 2003;16:549-53.
14. Chang JC, Koh SH, Powers JM, Duong JH. Tensile bond strength of composite to gold-palladium alloy after thermal cycling. J Prosthet Dent 2002;87:271-6.
15. Rothfuss LG, Hokett SD, Hondrum SO, Elrod CW. Resin to metal bond strength using two com- mercial systems. J Prosthet Dent 1998;79:270-2.
16. Czerw RJ, Wakefield CW, Robbins JW, Fulkerson MS. Shear bond strength of composite resin to microetched metal with five newer-generation bonding agent. Oper Dent 1995;20:58-62.
17. Smith RM, Barrett MG, Gardner WA, Marshall T, McLean MJ, McMichael DW, Yerbury PJ, Rawls HR.
Effect of environmental stress and surface treatment on resin-to-metal bonding. Am J Dent 1993;6:
111-5.
18. Kim JY, Pfeiffer P, Niedermeier W. Effect of lab- oratory procedures and thermocycling on the shear bond strength of resin metal bonding systems.
J Prosthet Dent 2003;90:184-9.
19. Pesun S, Mazurat RD. Bond strength of acrylic resin to cobalt-chromium alloy treated with the Silicoater MD and Kevloc systems. J Can Dent Assoc 1998;
64:798-802.
20. Yoon DJ, Shin SW, Lim HN, Suh KW. A study of the bond strength of reinforced indirect compos- ite resins to dental alloys. J Korean Acad Prosthodont 1999;37:620-39.
21. McDonough WG, Antonucci JM, He J, Shimada Y, Chiang MY, Schumacher GE, Schultheisz CR. A mi- croshear test to measure bond strengths of dentin-
polymer interfaces. Biomaterials 2002;23:3603-8.
22. Tantbirojn D, Cheng YS, Versluis A, Hodges JS, Douglas WH. Nominal shear or fracture me- chanics in the assessment of composite-dentin adhesion? J Dent Res 2000;79:41-48.
23. Laufer B, Nicholls J, Townsend J. SiOx-C coat- ing: A composit-to-metal bonding mechanism. J Prothet Dent 1988;60:320-7.
24. Rubo JH, Pegoraro LF, Ferreira PM. A comparison of tensile bond strengths of resin-retained prostheses made using five alloys. Int J Prosthodont 1996;9:
277-81.
25. Cho L, Song H, Koak J, Heo S. Marginal accuracy and fracture strength of ceromer/fiber-reinforced composite crowns: effect of variations in preparation design. J Prosthet Dent 2002;88:388-95.
26. Song HY, Yi YJ, Cho LR, Park DY. Effects of two preparation designs and pontic distance on bend-
ing and fracture strength of fiber-reinforced com- posite inlay fixed partial dentures. J Prosthet Dent 2003;90:347-53.
27. Rueggeberg FA, Margeson DH. The effect of oxy- gen inhibition on an unfilled/filled composite system. J Dent Res 1990;69:1652-8.
28. Lastumaki TM, Kallio TT, Vallittu PK. The bond strength of light curing composite resin to finally polymerized and aged glass fiber-reinforced com- posite substrate. Biomaterials 2002;23:4533-9.
Reprint request to:
CHAN-JINPARK
DEPT. OF PROSTHODONTICS,COLLEGE OFDENTISTRY, KANGNUNGNATIONALUNIVERSITY,
120 GANGNEUNGDAEHANGNO,GANGNEUNG,210-702, KOREA [email protected]