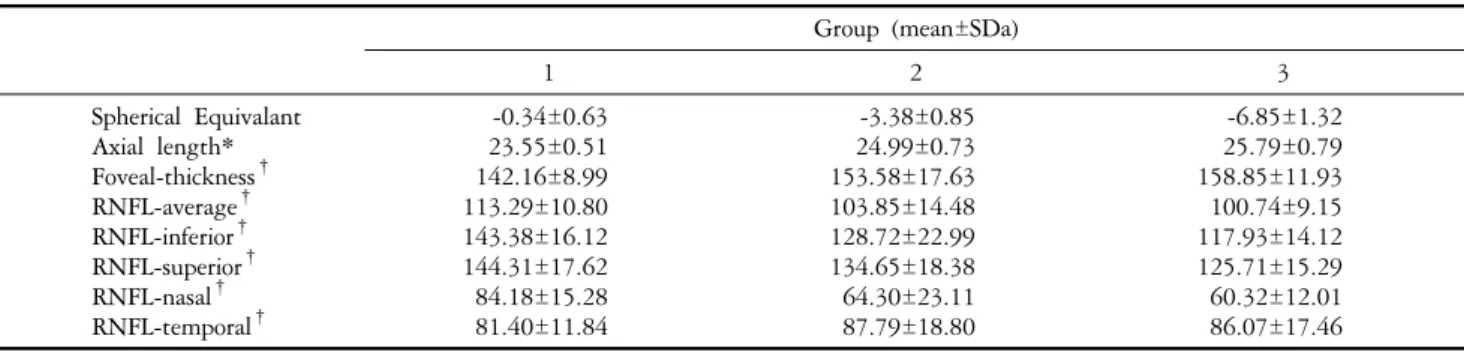
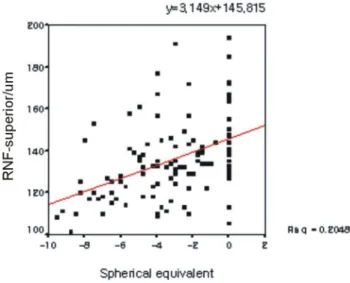
Thickness Changes in the Fovea and Peripapillary Retinal Nerve Fiber Layer Depend on the Degree of Myopia
5
0
0
전체 글
(2)
(3)
(4)
(5)
수치
관련 문서
Purpose: We investigated changes in the thickness of the peripapillary retinal nerve fiber layer (RNFL) following the onset of an epiretinal membrane (ERM) in glaucoma
Purpose: To evaluate changes in the peripapillary retinal nerve fiber layer RNFL thicknesses using spectral-domain optical coherence tomography SD-OCT in hydroxychloroquine HCQ
Average thickness, four-quadrant RNFL thicknesses, and intraocular pressure (IOP) in affected eyes were measured before and 6 and 12 months after anti-VEGF injection for
In conclusion, the average and nasal RNFL thicknesses were significantly thinner in migraine patients compared to healthy subjects and the RNFL thicknesses were thinner in the
Purpose: To examine the effects of panretinal photocoagulation (PRP) using a pattern scanning laser (PASCAL) system on the retinal nerve fiber layer (RNFL) thickness in patients
Age and Retinal Nerve Fiber Layer Thickness Measured by Spectral Domain Optical Coherence Tomography
Purpose: To evaluate the association between age and peripapillary retinal nerve fiber layer (RNFL) thickness measured by Cirrus high-definition (HD) spectral domain optical
Purpose: To compare the peripapillary retinal nerve fiber layer (RNFL) thickness of normal patients and those with various glaucoma diseases by time domain (Stratus) and
Baseline optical coherence tomography was employed to measure retinal thickness in the macula (horizontal, vertical, and central) and the peripapillary zone (superior, inferior,
