Original Article
Diabetic Retinopathy and Peripapillary Retinal Thickness
Hee Yoon Cho
1, Dong Hoon Lee
2, Song Ee Chung
2, Se Woong Kang
21
Department of Ophthalmology, Hanyang University College of Medicine, Seoul, Korea
2
Department of Ophthalmology, Samsung Medical Center, Sungkyunkwan University School of Medicine, Seoul, Korea
Purpose: To assess the diagnostic efficacy of macular and peripapillary retinal thickness measurements for the staging of diabetic retinopathy (DR) and the prediction of disease progression.
Methods: In this prospective study, 149 diabetic patients (149 eyes) and 50 non-diabetic control subjects were included. Baseline optical coherence tomography was employed to measure retinal thickness in the macula (horizontal, vertical, and central) and the peripapillary zone (superior, inferior, nasal, and concentric to the optic disc). Seven baseline parameters were correlated with the DR stages identified by fluorescein angiography.
Baseline retinal thickness was compared between groups of patients requiring panretinal photocoagulation (PRP) within 6 months (PRP group) and patients not requiring PRP (No-PRP group).
Results: Macular and peripapillary retinal thicknesses in diabetic subjects were significantly greater than that in normal controls (p<0.05). All retinal thickness parameters, and particularly peripapillary circular scans, tended to increase with increasing DR severity (p<0.05). The baseline thicknesses of the peripapillary circular scans were greater in the PRP group than in the no-PRP group (p<0.05).
Conclusions: Peripapillary retinal thickness may prove to be a useful criterion for DR severity and may also serve as an indicator of disease progression.
Key Words: Diabetic retinopathy, Laser photocoagulation, Retina, Mass screening
Received: September 12, 2008 Accepted: December 28, 2009 Reprint requests to Se Woong Kang. Department of Ophthalmology, Samsung Medical Center, Sungkyunkwan University School of Medicine,
#50 Irwon-dong, Gangnam-gu, Seoul 135-710, Korea. Tel: 82-2-3410- 3562, Fax: 82-2-3410-0074, E-mail: [email protected]
ⓒ 2010 The Korean Ophthalmological Society
This is an Open Access article distributed under the terms of the Creative Commons Attribution Non-Commercial License (http://creativecommons.org/licenses /by-nc/3.0/) which permits unrestricted non-commercial use, distribution, and reproduction in any medium, provided the original work is properly cited.
A principal pathogenic mechanism in diabetic retinopathy (DR) is the compromise of the blood-retinal barrier (BRB), leading to retinal edema. Subsequent increases in retinal vol- ume and retinal thickness are relevant quantitative parameters for BRB damage [1].
Traditional methods for evaluating macular thickening, including slit lamp biomicroscopy and stereo fundus pho- tography, are relatively insensitive to small alterations in retinal thickness [2]. Although fluorescein angiography is highly sensitive for the qualitative detection of fluid leak- age, the technique provides no quantitative measure of ei- ther BRB alteration or retinal thickening [3]. Optical coher- ence tomography (OCT), a non-invasive imaging technol- ogy that can generate micrometer resolution cross-sectional imaging of intraocular structures in a few minutes, allows for a quantitative measurement of alterations in retinal
thickness with good reproducibility [4-6].
Given the increasing diabetic population, a cost-effective and reliable screening program for DR is essential [7-10].
However, interobserver agreement is merely fair for DR grading using fundus photography [11, 12]. Interobserver agreement is even worse for proliferative diabetic retinop- athy (PDR), for which diagnostic accuracy is even more important [13].
In this study, we employed easy-to-use and -reproduce OCT to compare the retinal thicknesses of the macula and the peripapillary zone in order to determine the relation- ship between retinal thickness and DR severity. We also evaluated the validity of baseline retinal thickness for pre- dicting disease progression in DR patients. In particular, we studied which retinal location was best for evaluating the severity of DR and for predicting possible disease progression.
Materials and Methods
This study was a prospective observational case series,
with a study group of type II diabetic patients with or with-
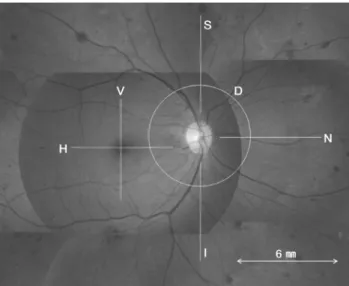
Fig. 1. Optic coherence tomography scans were performed at the macula and peripapillary zones, indicated by the line superimposed on the fundus photograph. Horizontal (H) and vertical (V) scans of the macula were centered through the fovea. Superior (S), inferior (I) and nasal (N) scans of the peripapillary zone originated within the one-third of disc diameter from the disc margin. All linear scans were 6 mm in length. The peripapillary circular scan (D) was ob- tained concentric to the optic disc, with a diameter of 6 mm.
out DR and a control group of non-diabetic normal subjects.
We evaluated the subjects seen in our department from August 2004 to July 2006.
Approval for the use of human subjects was obtained from the Institutional Review Board of the Samsung Medical Center. All participants provided informed consent prior to their participation in the study.
All of the subjects underwent complete ophthalmologic examinations, which included a best-corrected visual acuity measurement with the Snellen visual acuity chart, slit-lamp biomicroscopy, dilated fundus examinations using a 90-diopter pan-fundus lens, and fluorescein angiography. On the basis of fundoscopy and angiography, the eyes of the diabetic subjects were classified as no DR, mild/moderate/severe non-proliferative diabetic retinopathy (NPDR), and PDR [13].
Diabetics with DR should exhibit DR of any stage in at least one eye. If both eyes were the same stage, the right eye was selected. If eyes demonstrated different stages of DR, the eye with the more advanced stage was included.
The exclusion criteria included preretinal/vitreous hem- orrhage, advanced cataracts, significant corneal opacities, and traction affecting the macular or peripapillary zone.
Patients having undergone intravitreal injections, laser pho- tocoagulation (focal or panretinal), or intraocular surgery other than cataract extraction conducted more than 6 months before were also excluded, as these interventions may cause retinal thickness changes. Finally, the patients had no other retinal diseases, including macular degener- ation, retinal vein occlusion, or hypertensive retinopathy.
A single ophthalmic photographer blinded to the sub- jects’ conditions conducted OCT (Stratus
TM, Carl Zeiss, Dublin, CA, USA) scanning in all eyes following pupillarg dilation. The macula was initially scanned along the hori- zontal and vertical meridians using a standard, linear cross-hair pattern, with a scan length of 6 mm centered through the fovea. In cases in which macular edema pre- cluded adequate foveal localization of the scan, the OCT was centered on the patient’s fixation. For the peripapillary zone, three linear scans and one circular scan were conducted while a nasally- positioned fixation target was presented to the subject. The three peripapillary linear scans included one horizontal scan (nasal to optic disc) and two vertical scans taken superior and inferior to the optic disc, with a scan length of 6 mm starting from within one third of the disc diameter from the disc margin in each, in an effort to avoid including peripapillary atrophy within the scanned zone. The peripapillary circular scan was obtained concen- tric to the optic disc, resulting in a peripapillary ring of 6 mm in diameter along the margin of the optic disc.
The OCT parameters of this study, or the calculated mean thicknesses of the obtained scans, were abbreviated as horizontal (H) and vertical (V) in the macula, and superi- or (S), inferior (I), nasal (N), and circular along the margin of the optic disc (D) in the peripapillary zone, as shown in Fig. 1.
In addition, central macular thickness (CMT) at the deepest portion of the foveal pit was determined using manually- positioned OCT software-controlled cursors. For all cross- sectional OCT scans, retinal thickness was defined as the distance between the internal limiting membrane and the retinal pigment epithelium, as was determined automatically by the OCT analysis software. The mean retinal thickness in each location for the six scans was calculated using image processing software (Image/J, National Institutes of Health, Bethesda, MD, USA). Each individual scan was reviewed by a blinded observer (DHL) for aberrant placement of the inner and outer retinal borders. If a portion of the thick- ness measurements were determined to be incorrect, man- ual correction was applied using image processing soft- ware to adjust the inner and outer bands.
At every follow-up visit after the initial examination, bi- omicroscopic fundus examinations were conducted by one examiner (SWK), who was blinded to the patients` eligibility.
Additionally, when indicated, panretinal photocoagulation (PRP) was also conducted during the follow-up period. PRP was considered in accordance with the recommendations of the Diabetic Retinopathy Study [14]. In patients presenting with clinically significant macular edema, macular focal laser photocoagulation was administered in accordance with the guidelines established in the Early Treatment of Diabetic Retinopathy Study [15, 16].
Eyes with DR were, thus, classified into two groups,
designated the PRP and No-PRP groups. The PRP group
included eyes which had required PRP during the 6-month
follow-up period after the baseline examination, and the
No-PRP group included eyes which had not required PRP.
Fig. 2. Retinal thickness (µm) in the normal population, diabetic pa- tients without retinopathy, and four groups of diabetic patient with retinopathy.
DM=diabetes; DR=diabetic retinopathy; NPDR=non-proliferative diabetic retinopathy; PDR=proliferative diabetic retinopathy; H=
horizontal in macula; V=vertical in macula; S=superior to optic disc; I=inferior to optic disc; N=nasal to optic disc; D=circular concentric to optic disc; CMT=central macular thickness at foveal pit.
Table 1. Characteristics of diabetic patients and normal subjects Diabetes with retinopathy
(N=129) Diabetes without
retinopathy (N=20) Normal population
(N=50) p-value
*Age (yr) 62.3±7.3 60.3±9.7 59.3±10.8 NS
*Sex (M/F) 75/64 9/11 28/22 NS
†Refractive error (D) -0.1±0.3 -0.4±0.7 -0.3±0.8 NS
*Values for the diabetic patients and the controls are presented as mean±SD.
D=diopter; NS=not significant.
*
Kruskal-Wallis test;
†Chi-square test.
Table 2. Retinal thickness (µm) in the normal population, diabetic patients without retinopathy and four groups of diabetic patients with retinopathy
Normal population
(N=50) Diabetes without DR
(N=20) Mild NPDR
(N=20) Moderate NPDR
(N=38) Severe NPDR
(N=50) PDR
(N=21) p-value
*H 219.2±16.0 207.9±17.8 205.4±17.5 225.3±32.5 251.2±46.8 266.1±77.3 <0.001 V 220.1±18.8 209.3±19.3 206.6±15.3 224.4±36.7 246.5±41.3 258.0±63.2 <0.001 S 192.5±21.1 185.6±13.4 193.6±17.9 200.7±18.4 216.0±22.9 222.5±33.1 <0.001 I 197.2±17.9 195.4±16.3 201.5±15.2 197.0±23.2 219.0±22.3 228.5±55.7 <0.001 N 171.0±22.5 171.3±13.6 162.0±17.6 180.5±22.0 203.6±39.8 202.0±55.0 <0.001 D 203.3±14.4 192.4±15.1 192.5±17.4 200.3±14.8 217.1±26.9 227.7±44.2 <0.001 CMT 141.5±15.3 149.8±14.7 146.9±18.6 182.5±69.8 193.6±77.4 232.1±148.6 <0.001 Mean±SD of retinal thickness is presented in microns.
DR=diabetic retinopathy; NPDR=non-proliferative diabetic retinopathy; PDR=proliferative diabetic retinopathy; H=horizontal in macula;
V=vertical in macula; S=superior to optic disc; I=inferior to optic disc; N=nasal to optic disc; D=circular concentric to optic disc; CMT
=central macular thickness at foveal pit.
*
Kruskal-Wallis test or ANOVA.
Differences between the two groups in the parameters at baseline OCT were evaluated.
All seven of the OCT parameters were then compared among the control and diabetic subjects. Correlation analy- sis was also applied in order to characterize on a loga- rithmic scale the relationship between the OCT parameters and the best-corrected visual acuity.
The efficacy of the OCT parameters as index variables for the discrimination of DR stage and as a predictive var- iable for discrimination between eyes with and without PRP within 6 months of baseline OCTs was determined via receiver operating characteristic (ROC) analysis. The area under the ROC curve (AUC) was calculated for each OCT parameter. The best model, as defined by the largest AUC and cutoff value characterized by the best trade-off between sensitivity and specificity, was determined. The statistical calculations were conducted using a SPSS ver.
11.5 (SPSS Inc., Chicago, IL, USA). The p-values of less than 0.05 were considered significant.
Results
A total of 129 consecutive diabetics with DR (129 eyes) and 20 diabetics without DR (20 eyes) were enrolled in this study. The control group consisted of 50 non-diabetic, age- and sex-matched normal subjects (50 eyes).
The clinical characteristics of the three groups are sum- marized in Table 1. The mean age, gender ratio, and re-
fractive errors did not differ among the three groups.
Based on the initial fundus examinations and fluorescein
angiography, the 129 diabetics with DR were classified as
Table 3. Point estimates and standard errors for area under the ROC curves of optic coherence tomography parame- ters for discriminating between mild/moderate non-proliferative diabetic retinopathy (NPDR) and severe NPDR/PDR
AUC SE 95% CI for AUC p-value
*D 0.76 0.043 0.65, 0.82 <0.001
N 0.75 0.043 0.65, 0.82 <0.001
I 0.74 0.043 0.64, 0.82 <0.001
V 0.74 0.044 0.64, 0.81 <0.001
H 0.74 0.044 0.64, 0.81 <0.001
S 0.71 0.045 0.61, 0.79 <0.001
CMT 0.59 0.050 0.47, 0.67 0.068
ROC=receiver operating characteristic; AUC=area under the ROC curves; SE=standard errors; D=circular concentric to optic disc;
N=nasal to optic disc; I=inferior to optic disc; V=vertical in macula; H=horizontal in macula; S=superior to optic disc; CMT=central macular thickness at fovea pit.
*
Significance of the null hypothesis that the true AUC is 0.5.
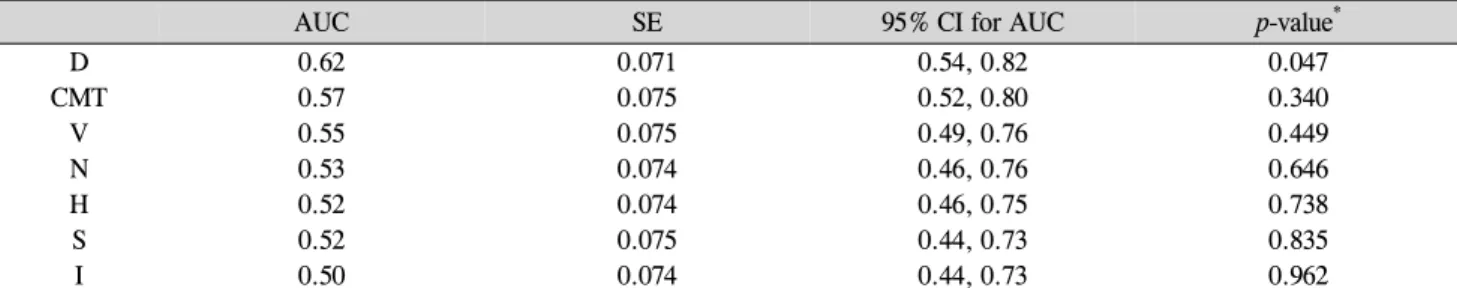
Table 4. Point estimates and standard errors for area under the ROC curves of optic coherence tomography parameters for discriminating between panretinal photocoagulation (PRP, 26 eyes) and No-PRP group (45 eyes)
AUC SE 95% CI for AUC p-value
*D 0.62 0.071 0.54, 0.82 0.047
CMT 0.57 0.075 0.52, 0.80 0.340
V 0.55 0.075 0.49, 0.76 0.449
N 0.53 0.074 0.46, 0.76 0.646
H 0.52 0.074 0.46, 0.75 0.738
S 0.52 0.075 0.44, 0.73 0.835
I 0.50 0.074 0.44, 0.73 0.962
Subsequent panretinal photocoagulation had been conducted for the panretinal photocoagulation group within the 6-mon follow-up period after baseline optic coherence tomography measurements.
ROC=receiver operating characteristic; AUC=area under the ROC curves; SE=standard errors; D=circular concentric to optic disc;
CMT=central macular thickness at fovea pit; V=vertical in macula; N=nasal to optic disc; H=horizontal in macula; S=superior to optic disc;
I=inferior to optic disc.
*
Significance of the null hypothesis that the true AUC is 0.5.
follows: mild NPDR (20 eyes, 15.5%), moderate NPDR (38 eyes, 29.5%), severe NPDR (50 eyes, 38.8%), and PDR (21 eyes, 16.2%).
The evaluation of retinal thicknesses according to the severity of DR is summarized in Table 2. We noted stat- istically significant differences in retinal thickness in each of the scans between diabetic and normal subjects. In the post hoc test of multiple comparison, the difference in thickness among subjects with mild NPDR and normal control subjects was significant only in the S and D scans in the peripapillary area (Kruskal-Wallis test, p=0.012, 0.042). The differences between subjects with mild NPDR and diabetics without DR, and between diabetics without DR and normal control subjects, were not significant in all scans. The mean thickness tended to increase with the se- verity of DR (Fig. 2), but only part of the comparison was statistically significant in multiple comparisons with post- hoc tests (mild NPDR<moderate NPDR<severe NPDR/ PDR with p<0.03 in the H, N scan and mild NPDR/moderate NPDR<severe NPDR/PDR with p<0.01 in the V, S, I, D scan).
CMT values were minimal among all measured thick- nesses in all stages of DR except for PDR (Friedman Test, p<0.001). The retinal thickness upon OCT scan in the
macula (H, V scan) was greater than that in the peripapil- lary zone (S, I, N, D scan) (p<0.001). The coefficient of variance in thickness tended to be greater in eyes with more advanced DR. CMT found the largest coefficient of variance of all DR stages.
The H, V and D scans demonstrated negative correla- tions with age, and the H scan was most closely correlated with age (spearman r=0.269, p<0.001). When the OCT pa- rameters were plotted against the logMAR visual acuities in all study groups, with the exception of the I scan in the peripapillary area, there were significant correlations be- tween retinal thickness and visual acuity. CMT showed the strongest correlation among all OCT measurements (r=0.349, p<0.001).
Table 3 shows the AUC values for each of seven retinal
thickness measurements for discrimination between early
stage (mild and moderate NPDR) and more advanced
(severe NPDR and PDR) DR. The peripapillary circular
thickness (D scan) had the ROC curve with the highest
AUC value (0.756, p<0.001). The sensitivity and specific-
ity for a cutoff point of 203 µm were 71.1% and 64.2%,
respectively. We suspected an eye of being in an advanced
stage DR when the D scan value of the eye was greater
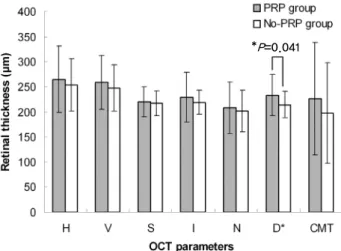
Fig. 3. Comparison of baseline retinal thickness of panretinal photo- coagulation (PRP) (26 eyes) and No-PRP group (45 eyes). The two groups consisted of diabetic eyes with severe non-proliferative dia- betic retinopathy or proliferative diabetic retinopathy. Subsequent PRP was conducted for the PRP group within the 6 month follow-up period after baseline optic coherence tomography measurements due to disease progression. Asterisks indicate significant differ- ences between the two groups:
*p<0.05.
H=horizontal in macula; V=vertical in macula; S=superior to optic disc; I=inferior to optic disc; N=nasal to optic disc; D=circular con- centric to optic disc; CMT=central macular thickness at fovea pit.
than the cutoff point. Shifting this cutoff point to 210 µm increased the specificity to 75.5%, but reduced the sensi- tivity to 61.8%.
Among the 129 diabetics with DR, with a mean fol- low-up of 16.3±4.7 months (range, 6 to 28 months), 27 patients (20.9%) had been treated by PRP within 6 months of the baseline OCT scan. Zero percent showed mild NPDR, 2.6% moderate NPDR, 26% severe NPDR, and 61.9% PDR. We compared the baseline retinal thicknesses between the PRP group and No-PRP group. To prevent bias from the mild and moderate NPDR group that con- tained a relatively low proportion of treated patients and relatively thin retinal thicknesses, the comparison included only 71 patients with severe NPDR or PDR. The baseline retinal thicknesses of the PRP group (26 eyes) tended to be greater than that of the No-PRP group (45 eyes) in all OCT scans, but only the D scans were significantly differ- ent (independent t test, p=0.041) (Fig. 3). Table 4 shows the AUC values for each retinal thickness measurement for discrimination between the PRP and No-PRP group. The D scan produced the ROC curve with the highest AUC value (0.623, p=0.047) for discrimination between the two groups. Sensitivity and specificity at a cutoff point of 233 µm were 42.3% and 84.4%, respectively. The relative risk of the D scan≥233 µm for PRP was 1.941 (95% CI, 1.066 to 3.533).
Discussion
In this study, the thicknesses of seven OCT scans in the
macular and peripapillary retina were significantly greater in DR eyes than in normal eyes. Also detected were sig- nificant differences in retinal thickness in each of the scans when all DR groups were compared. The retinal thickness tended to be greater in more advanced stages of DR than in the early stages. The CMT measurements had the largest standard deviation among all OCT parameters through all stages of DR, and this variability of CMT miti- gated the statistical significance of the results.
A key factor in the pathological process of diabetic retinal edema is the increased permeability of the BRB [17]. As evidenced by fluorescein angiography of diffuse macular edema, micro-vascular obstruction and the resultant ische- mia induce derangements in the integrity of the inner BRB [18]. The breakdown of the inner BRB results in accumu- lation of fluid within the extracellular space. Damage to the outer BRB at the level of the retinal pigment epi- thelium has also been suggested as a mechanism for the development of diffuse edema [19]. If the fluid resulting from inner or outer BRB damage is in excess of the amount that can be removed by the active pump mechanism, intraretinal and subretinal fluid continues to accumulate.
Thus, if we quantify the increased retinal thickness resulting from pathological edema, we may determine the extent of altered BRB function in cases of DR [20]. Our finding that more advanced DR was associated with increased peripapil- lary retinal thickness is consistent with this assumption.
The current statistical methodology indicates that our retinal thickness measurement with OCT can be employed as a diagnostic and prognostic factor in cases of DR [21].
Using ROC analysis, we evaluated the effectiveness of the measurement for DR staging, and PRP prediction within 6 months. AUCs between 0.50 and 0.70 were considered to represent low diagnostic accuracy, whereas AUC values in excess of 0.90 were suggestive of high accuracy [15]. Although other OCT parameters demonstrated comparably significant results, peripapillary circular thickness had the ROC curve with the highest diagnostic power (AUC, 0.756) with re- gard to discrimination between early (mild and moderate NPDR) and advanced (severe NPDR and PDR) stages of DR. Our results also indicate that peripapillary circular thickness in the PRP group was significantly greater than that of the No-PRP group upon baseline OCT, and that peripapillary circular thickness had the ROC curve with the highest degree of diagnostic power (AUC, 0.623) for discrimination between the two groups. Using a cut-off val- ue of 233 µm for the peripapillary circular thickness, severe NPDR or PDR patients with peripapillary circular thick- ness ≥233 µm upon baseline OCT can be considered to be 1.94 times more likely to require PRP within 6 months than patients with peripapillary circular thickness of <233 µm. This finding suggests that peripapillary retinal thickness may have prognostic value for identifying diabetic eyes at higher risk for imminent progression.
The principal question is why peripapillary circular
*P=0.041