Vol. 17, No. 11 (2007)
593
†Corresponding author
E-Mail : [email protected] (Takayoshi Fujino)
Electrochemical Synthesis of TiO
2Photocatalyst with Anodic Porous Alumina
Takanori Hattori, Takayoshi Fujino† and Seishiro Ito
Department of Applied Chemistry, Faculty of Science & Technology, Kinki University, 3-4-1 Kowakae, Higashiosaka, Osaka 577-8502, Japan.
(Received September 3, 2007 : Accepted November 5, 2007)
Abstract Aluminum was anodized in a H2SO4 solution, and titanium (IV) oxide (TiO2) was electrodeposited into nanopores of anodic porous alumina in a mixed solution of TiOSO4 and (COOH)2. The photocatalytic activity of the prepared film was analyzed for photodegradation of methylene blue aqueous solution.
Consequently, we found it was possible to electrodeposit TiO2 onto anodic porous alumina, and synthesized it into the nanopores by hydrolysis of a titanium complex ion under AC 8-9 V when film thickness was about 15-20µm. The photocatalytic activity of TiO2-loaded anodic porous alumina (TiO2/Al2O3) at an impressed voltage of 9 V was the highest in every condition, being about 12 times as high as sol-gel TiO2 on anodic porous alumina. The results revealed that anodic porous alumina is effective as a substrate for photocatalytic film and that high-activity TiO2 film can be prepared at low cost.
Key words TiO2, Photocatalyst, Anodic porous alumina, Electrodeposition, Titanium complex ion.
1. Introduction
Photocatalysts generate electrons and positive holes by light energy, and it is possible to employ them to photolyze water,1) detoxify organic compounds and NOx2-4) and so on due to their possessing strong redox potential. TiO2 in particular is a promising photocatalyst material that has often been studied because it has proved to be excellent in pho- tocatalytic activity and resistance to photocorrosion.5-8)
The immobilization of photocatalyst to a substrate is indispensable when it comes to practical use, but cost and adhesion must be considered. Methods using an organic binder and a sol-gel method are the mainstream at present, but they present problems with cost, safety, and adhesion. In addition, photocatalytic activity is reduced because surface area becomes small through immo- bilization. Since photocatalytic activity is influenced by cry- stallinity, surface area, and impurities,9-13) when photo- catalytic film is immobilized, the selection of substrate is important.
Aluminum is widely used in building fields because it is cheap and light. However, since aluminum has low corrosion resistance, it is generally used as a surface finish, such as in anodizing, plating, and chemical conversion.
Anodized aluminum is just ideal material as a substrate of photocatalyst because it is porous and possesses a large surface area.
The aim in this report is to prepare an inexpensive and high-activity photocatalytic film by utilizing anodic porous alumina: an aluminum plate was anodized in a H2SO4 solution, and then TiO2 was electrodeposited into nano- pores by the same method as that used in electrolytic coloring. After that, the prepared film was sintered at 723 K. The photocatalytic activity of the prepared film was analyzed by photodegradation of the methylene blue (MB) aqueous solution.
2. Experimental procedures
An aluminum plate (purity: 99.85%, 30×50×0.4 mm) was pretreated by immersion in a NaOH aqueous solution, after which it was anodized by DC constant- current electrolysis under a current density of 2×10² A· m−2 in a mixed solution of 50 mol · m−3 Al2(SO4)3 and 1.5 kmol · m−3 H2SO4 for 30 min at 298 K.14-15) A platinum plate (30×50×0.2 mm) was used as the counter electrode. Next, the TiO2 was electrodeposited into the anodic porous alumina by AC constant-voltage elect- rolysis for electrolytic times of 1-10 min under impressed voltages of 6-15 V and 283 K in a mixed aqueous solution consisting of 50 mol×m−3 TiOSO4 and 300
mol·m−3 H2C2O4 dissolved by heating in water at 323 K, and then adjusted to pH 5 by an NH4OH solution. The TiO2-loaded anodic porous alumina (TiO2/Al2O3) was then sintered at 723 K.
Quantitative analysis of the TiO2 was carried out by inductively coupled plasma (ICP) emission spectrometry, where the films were dissolved in heated conc. H2SO4, followed by analysis of the resulting solution. The deposited TiO2 was distinguished by X-ray diffraction (XRD) with CuKα radiation in the range of angles 20o- 90o because the peak of anatase-type TiO2 can be detected with in this range. In addition, the prepared film was distinguished by MgKα excited X-ray photoelectron spectrometry (XPS). The TiO2/Al2O3 was analyzed using thermal analysis equipment (TG/DTA). After being flaked and comminuted, the film was analyzed within the range of 298-1273 K (10 K/min) in an air. A micro-type pla- tinum cell was used as the sample cell. The absorption spectrum of the film was measured by UV/vis absorption spectrometry within wavelength range of 250-500 nm, with absorbance defined as the logarithm of the intensity ratio of incident beam (I0) and transmitted beam (I); - log(I/I0). Deposition behavior of electrodeposited TiO2
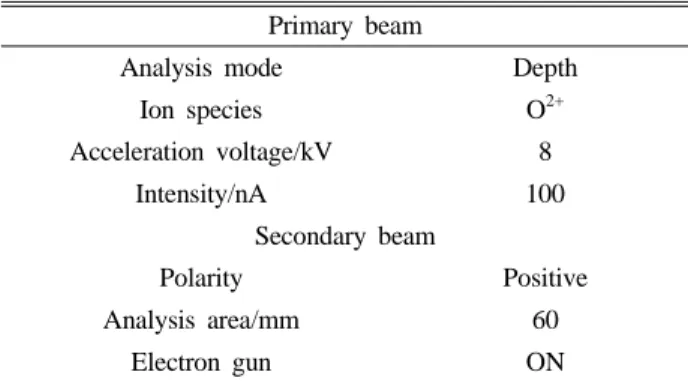
was confirmed by depth direction analysis and cross- sectional observation. The depth profile was examined using secondary ion mass spectroscopy (SIMS) under the conditions presented in Table 1.
The cross-sectional images were observed by trans-
mission electron microscopy (TEM) under 300 kV of acceleration voltage. The photocatalytic activity was analyzed for the photocatalytic reduction of the MB. The MB solution was set to 10 ppm and placed into a 4×10⁻⁵ m3 vessel with samples and the vessel were illuminated with UV light from a black light during 2 h. Analysis was carried out under the conditions shown in Table 2, and then absorbance was determined using a UV/vis spectrophotometer at a wavelength of 663 nm.
3. Results and Discussion
3.1 State analysis of electrolytic solution Fig. 1 shows the result that confirmed the state of titanium ions in the electrolytic solution by conduc- tometric titration. The titrant was H2C2O4, and the sample solution was set to 50 mol m−3 TiOSO4 (eq.-i). The molar ratio of titanium to H2C2O4 was 1 : 1 because endpoint appeared when H2C2O4 was titrated to about 50 mol m−3. Thus, the TiOC2O4complex was formed in the solution (eq.-ii).
The solution’s pH didn’t change to the end point but had begun to decrease after that. H+ concentration there- fore didn't change before and behind the end point.
Chemical equation in the solution based on results of them is as follows:
TiOSO4+ 2H2O→ TiO(OH)2+ SO42−+ 2H+ (i)
TiO(OH)2+ SO42−+ 2H++ H2C2O4
→ TiOC2O4+ SO42−+ 2H++ 2H2O (ii) Table 1. Analysis conditions of SIMS.
Primary beam
Analysis mode Depth
Ion species O2+
Acceleration voltage/kV 8
Intensity/nA 100
Secondary beam
Polarity Positive
Analysis area/mm 60
Electron gun ON
Table 2. Working conditions on MB degradation
Test piece size/mm2 1500
Source of light Black light (λmax= 254 nm, 3 WÅEm-2) Volume of
methylene bule/m3 4×10⁻⁵
UV illumination time/h 2
Analysis wavelength/nm 663
Fig. 1. Conductometric titration and pH change curves of TiOSO4 solution using H2C2O4 as titrant. Titrant: H2C2O4; Sample solution: 50 mol m-3 TiOSO4.
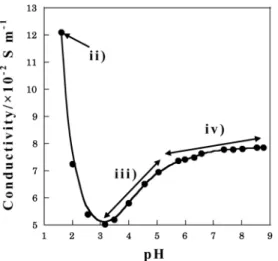
Fig. 2 shows relationships between conductivity and pH of electrolytic solution and the chemical equation considered from it is indicated in the following. Eq.-iii shows addition of NH3 aq. to the solution of eq.-ii. The conductivity was increased when the solution’s pH was more than 3 because TiOC2O4 complex changed [TiO(C2O4)2]2− complex ion by configuration of C2O42−.
On the other hand the inclination of the curve decreases in iii to iv. This is because TiO(OH)2 formed by hydrolyzation of [TiO(C2O4)2]2− anion.
TiOC2O4+ SO42−+ 2H++ H2C2O4+ 4NH4OH
→ [TiO(C2O4)2]2−+ SO42−+ 4NH4+
+ 4H2O (iii) [TiO(C2O4)2]2−+ SO42−+ 4NH4++ 2NH4OH
→ TiO(OH)2+ 2C2O42−+ SO42−+ 6NH4+ (iv)
3.2 Electrodeposition behavior of TiO2
Fig. 3 shows the depth profile of TiO2/Al2O3. The elements of being measured are 48Ti and 46Ti, and for reference, anodic porous alumina without TiO2 was analyzed. Film thickness of the TiO2/Al2O3 and anodic porous alumina was set to 2 µm. The 46Ti and 48Ti exhibited different behavior in reference sample, but in TiO2/Al2O3 they behaved identically. The SIMS results, therefore, proved that TiO2 was electrodeposited into the anodic porous alumina.
3.3 I-E curve in TiO2 electrodeposition Fig. 4 shows the I-E curve when electrodepositing TiO2 in a mixed solution of TiOSO4 and H2C2O4. Current density was measured using a multimeter for an
electrolytic time of 5 min under impressed voltages of 6- 15 V. Current density increased as an exponential function with voltage, and it was confirmed that the anodic porous alumina flaked off from the Al substrate when the impressed exceeded 10 V. This occurred because the increase of current density generated remarkable quantities of hydrogen and that lifted the film from the substrate.
The appropriate voltage, therefore, was 8-9 V when electrolyzing in this solution. However the appropriate voltage is considered to change due to anodic porous alumina because breakthrough voltage of the barrier layer depends on kind of the film.
Fig. 2. pH vs conductivity curves of H2C2O4 and TiOSO4
mixture solution using conc.NH4 aqueous solution as titrant.
Fig. 3. Depth profile of TiO2/Al2O3 and anodic porous alumina by SIMS.
Fig. 4. I-E curve when electrodepositing TiO2 in anodic porous alumina of film thickness 15µm.
3.4 Amount of TiO2 inside nanopores
Fig. 5 shows the amount of electrodeposited TiO2
when changing voltage. It is clear that when the voltage was changed, the amount of TiO2 increased propor- tionally with voltage to 9 V, but began to decrease when voltage exceeded 10 V. In other words, anodic porous alumina and/or deposited TiO2 became flaked with impression of more than 10 V.
The temporal amount change of TiO2 at AC 9 V is shown in Fig. 6. The amount of TiO2 increased in pro- portion with time as the voltage changed, and began to decrease when electrolytic time exceeded 10 min. The electrodeposited amount of TiO2 was limited to about 2.5
×10−5kg·m−2 when the thickness of the porous alumina was 15µm.
3.5 Characterization of TiO2/Al2O3
Flaked and comminuted TiO2/Al2O3, and as a reference anodic porous alumina without TiO2 and amorphous TiO2
were analyzed using TG-DTA measurement, and the respective peaks were denoted with A, B, C, D and E.
The measurement results are shown in Fig. 7. The amor- phous TiO2 particles were synthesized by hydrolyzation of the electrolytic solution with NH4OH, and then analyzed after drying. Peak A was confirmed in all samples. This is the endothermic peak at approximately 380 K in a DTA spectrum that is considered to be due to removal of adsorbed water. Peaks B and C were peaks of TiO2 because they were not confirmed in the anodic porous alumina but appeared in the TiO2 and the TiO2/ Al2O3. First, peak B was the endothermic peak at about 580 K representing the elimination of water from TiO2. Next, peak C at approximately 600 K was considered the peak denoting the phase transition to anatase-type TiO2 because it was the exothermic peak. Peaks D and E appeared only in the anodic porous alumina and TiO2/ Al2O3 these peaks are therefore considered to depend on the anodic porous alumina. Peak D at around 900 K was considered to denote the wide endothermic reaction according to the dehydration reaction from the anodic
Fig. 6. Amount of TiO2 in anodic porous alumina when changing electrolytic time in impressing voltage under AC 9 V.
Fig. 5. Amount of TiO2 in anodic porous alumina when changing voltage in electrolytic time for 5 min.
Fig. 7. TG/DTA curves of a) anodic porous alumina; b) amorphous TiO2· H2O and c) TiO2/Al2O3.
porous alumina, and peak E at 1300 K represented the changing of amorphous Al2O3 to α-Al2O3. In the TG result for TiO2 particles (Fig. 6-b), this is regarded as the halting of the dehydration reaction in TiO2. This product was proved to be TiO2· H2O because a decrease of about 18wt% was detected at temperatures of about 580 K.
Fig. 8 shows the XRD patterns of TiO2. The anodic porous alumina was electrolyzed by AC 30 V in a mixed solution of TiOSO4 and H2C2O4, and then settled TiO2
particles were analyzed by powder XRD, which revealed that morphology of electrodeposited product was amor- phous. However, the product crystallized to anatase-type TiO2 upon heating.
Fig. 9 shows the XPS of the product deposited into pores. The spectra when insulating material was analyzed
and had to be calibrated with the standard sample.
Generally, the calibration is often carried out using the C 1s (284.6 eV) spectrum of impurity carbon that exists on all samples. The Ti 2p spectrum (Fig. 9-a) shows two peaks located at 458.5 eV and 464.2 eV, respectively;
only the peak that indicates TiO2 was observed in the Ti 2p spectrum as well as the XRD results. On the other hand, The O 1s spectrum is shown in Fig. 9-b. The spectrum includes two peaks located at 529.9 eV and 531.8 eV that respectively indicate TiO2 and anodic porous alumina (Al2O3) respectively.
Thus, from the results of TG/DTA, XRD and XPS, the product electrodeposited into nanopores was amorphous TiO2· H2O, which then crystallized to anatase-type TiO2 by heating at around 600 K.
The electrodepositing process of TiO2 in this method is different from metal deposition in conventional electrolytically colored anodic oxide coating, depending on hydrolyzation and not on electrochemical reduction.
The considered TiO2 electrodeposition mechanism based on results of the conductometric titration and charac- terization is as follows:
TiOSO4+ 2H2C2O4+ 4NH4OH
→ [TiO(C2O4)2]2−+ SO42−+ 4NH4+ (v)
2H2O + 2e−→ H2+ 2OH− (vi)
[TiO(C2O4)2]2−+ 2OH−→ TiO2· H2O + 2C2O42− (vii) First, Eq.-v is the equation for the electrolytic solution explained already in sect. 3.1. Next, water electrolyzed to hydrogen and the hydrate anion by impression of the AC Fig. 8. XRD patterns of precipitated products after electrolysis.
Fig. 9. XPS of electrodeposited products: a) crystallized product at 723 K (TiO2); b) electrodeposited product.
voltage at more than 8 V (Eq.-vi). Thus, the pH of the interface was increased, and TiO2 was deposited by hydrolysis of the [TiO(C2O4)2]2− ion (Eq.-vii).
The UV/vis absorption spectrum of sintered TiO2/ Al2O3 at 723 K and reference samples [anodic porous alumina, the marketed anatase-type TiO2 (average dia- meter: 150 nm), and the marketed rutile-type TiO2
(average diameter: 300 nm)] are shown in Fig. 10. The red-shift in the absorption region depends on deposited TiO2 because the absorption edge of TiO2/Al2O3 was around 340 nm; the absorption wavelength was clearly greater than that of the oxidation film. On the other hand, the absorption edge was shorter than that of the bulk TiO2 because the blue shift is caused by the quantum size effect, which has already been explained.16-19) The size of TiO2 is sufficiently small because it was immobilized into nanopores (pore diameter: approx. 10 nm) of the anodic porous alumina, so it is possible that the quantum size effect is manifested in TiO2/Al2O3.20-22)
3.6 Photocatalytic activity of the TiO2/Al2O3 Fig. 11 illustrates the temporal concentration changes of MB in photocatalytic reactions, and the rate constant of MB degradation is shown in Table 3. The rate constant was calculated using the following equation.
Rate const. k = ln(C/C0)· t−1 (C = MB concentration, C0= MB initial concentration, t = UV illumination time) The photocatalytic activity was evaluated from the logarithm of the concentration ratio of MB, which was
proportional in terms of ultraviolet ray illumination time and decreased in a straight line. The results confirmed the clear differences in absorbance changes: photo- catalytic activity was confirmed to manifest when impressed voltage was more than 8 V, and it was higher than TiO2
onto anodic porous alumina produced by the sol-gel
Fig. 10. UV/vis absorption spectra of a) marketed rutile-type TiO2 (average diameter:300 nm); b) marketed anatase-type TiO2 (average diameter:150 nm); c) TiO2/Al2O3 and d) anodic porous alumina.
Table 3. Rate constant of MB degradation
Sample k/h-1
Blank Sol-gel TiO2
AC 6 V AC 8 V AC 9 V
0.113 0.249 0.131 0.940 3.016
Fig. 11. Time course of concentration of methylene blue under black light illumination (λ = 254 nm) for 2 hour: a) Blank; b) AC 6 V-TiO2/Al2O3; c) sol-gel TiO2 on anodic porous alumina;
d) AC 8 V-TiO2/Al2O3 and e)AC 9 V-TiO2/Al2O3.
Fig. 12. Absorbance change of methylene blue for time course in 9 V- TiO2/Al2O3: a) 0 hour; b) 0.5 hour c) 1 hour and d) 1.5 hour.
method. This is because TiO2 was electrodeposited uniformly along the walls of pores and its large surface area was utilized effectively. The activity of 9 V-TiO2/ Al2O3 in particular was the highest under every condition because most TiO2 was loaded into the anodic porous alumina, and the 10 ppm MB was perfectly decolored by 9 V-TiO2/Al2O3 at about 1.5 hours as shown in Fig. 12.
However, TiO2 deposited under AC 6 V almost did not decompose the MB. The rate constant of degradation was almost same as a blank because TiO2 was not electro- deposited when impressing AC 6 V at all, as already indicated by ICP analysis.
3.7 Cross-sectional images of films
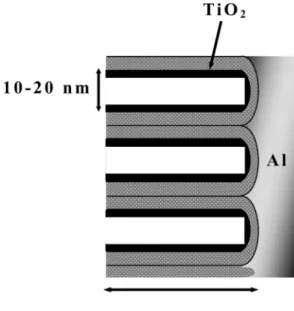
Fig. 13 shows the cross-sectional micrographs of the TiO2/Al2O3 films by TEM. Nanopores formed vertical
lines lengthwise to an aluminum substrate from the interface, and diameter of the pores was about 10-20 nm.
TiO2 nanoparticles of smaller than 10 nm of diameter were electrodeposited on wall of anodic porous alumina.
Also, Fig. 14 shows the cross-sectional scheme of TiO2/ Al2O3. The SIMS and TEM results concluded the TiO2 was electrodeposited uniformly along the walls of the pores.
4. Conclusion
It was possible to electrodeposit TiO2 into anodic porous alumina in a mixed solution of TiOSO4 and H2C2O4. It was synthesized into nanopores by hydrolysis of a titanium complex ion ([TiO(C2O4)2]2-) under AC 8-9 V when film thickness of anodic porous alumina was about 15-20 µm. TiO2/Al2O3 manifested high photocatalytic activity, which in particular at an impressed voltage of 9 V was about 12 times as high as sol-gel TiO2 on anodic porous alumina. This is because TiO2 was electrode- posited uniformly along the walls of pores and that its large surface area was utilized effectively.
Therefore, anodic porous alumina is effective as a substrate for photocatalytic film and high-activity TiO2
since it is inexpensive to produce, making it attractive to industry.
Acknowledgements
This work was supported by funding from the Ministry of Education, Culture, Sports, Science and Technology private school grant. The authors thank them for their immense assistance in the development of anodic alumina and its applicability.
References
1. A. Fujishima and K.Honda, Nature, 238[5358] (1972) 37-38 2. T. Inoue, A. Fujishima, S. Konishi and K. Honda, Nature,
277 (1979) 637-638.
3. N. Negishi, K. Takeuchi and T. Ibusuki, Applied surface science, 121/122 (1997) 417-420.
4. Y. Komazaki, H. Shimizu and S. Tanaka, Atmospheric Environment, 33[27] (1999) 4363-4371.
5. A. Ishizaki, Hyoumen gijutsu, 50 (1999) 251-255. (in Japanese)
6. Y. Yamaguchi, Hyoumen gijutsu, 50 (1999) 256-259. (in Japanese)
7. H. Takeuchi, Hyoumen gijutsu, 50 (1999) 260-264. (in Japanese)
8. M. Anpo, T. Morizane, T. Inui, K. Kato, E. Nomura, and Fig. 13. Cross-sectional image of TiO2/Al2O3 film by TEM
Fig. 14. Scheme of TiO2/Al2O3 expected from the SIMS result.
H. Taoda, in Saishin hikarishokubai gijutsu (NTS Co.Ltd, 2000), p. 11-12. (in Japanese)
9. Z. S. Wang, C. H. Huang, Y. Y. Huang, and B. W. Zhang, Solar Energy Materials and Solar Cells, 71[2] (2002) 261-271.
10. K. Hara, T. Horiguchi, T. Kinoshita, K. Sayama, and H.
Arakawa, Solar Energy Materials and Solar Cells, 70[2]
(2001) 151-161.
11. R. N. Viswanath and A. Chandra, J. Physics and Chemistry of Solids, 62[11] (2001) 1991-1998.
12. R. Fretwell and P. Douglas, J. Photochemistry and Photobiology A, 143[2-3] (2001) 229-240.
13. Y. Guo, M. Sakurai, H. Kameyama, A. Matsuyama, and Y.
Kudoh, J. of The Surface Finishing Society of Japan, 55 (2004) 366-372. (in Japanese)
14. T. Fujino and T. Nara, Kinki Aruminiumu Hyomen Shori Kenkyukai Kaishi, 216 (2002) 1-4. (in Japanese) 15. T. Fujino and T. Nara, Keikinzoku, 53[10] (2003) 410-415.
(in Japanese)
16. M. Anpo, N. Aikawa, Y. Kubokawa, M. Che, C. Louis, E.
Giamello, J. Physical Chemistry, 89 (1985) 5017.
17. Z. Hua, J. Shi, L. Zhang, M. Ruan, J. Yan, Advanced Materials, 14[11] (2002) 830-833
18. J. J .Schneider, N. Czap, J. Hagen, J. Engstler, J. Ensling, L. Jos De Jongh, M. Wark, G. Grubert, G. L. Hornyak, R.
Zanoni, Chemistry-A European Journal, 6[23] (2000) 4305-4321
19. H. Yamashita, S. Kawasaki, Y.I chihashi, M. Harada, M.
Takeuchi, M. Anpo, G.Stewart, M. A. Fox, C. Louis, M.
Che, J. Physical Chemistry B, 102[30] (1998) 5870-5875 20. Li, Jinhong; Shi, Xiaoying; Wang, Lijuan; Liu, Fei, Journal of Colloid and Interface Science, 315[1] (2007) 230-236.
21. T. Maiyalagan, B. Viswanathan, U. V. Varadaraju, Bulletin of Materials Science, 29[7] (2006) 705-708.
22. K. Honda, T. Yoshikawa, Bunseki Kagaku, 56[1] (2007), 51-54. (in Japanese)