저작자표시-비영리-변경금지 2.0 대한민국 이용자는 아래의 조건을 따르는 경우에 한하여 자유롭게 l 이 저작물을 복제, 배포, 전송, 전시, 공연 및 방송할 수 있습니다. 다음과 같은 조건을 따라야 합니다: l 귀하는, 이 저작물의 재이용이나 배포의 경우, 이 저작물에 적용된 이용허락조건 을 명확하게 나타내어야 합니다. l 저작권자로부터 별도의 허가를 받으면 이러한 조건들은 적용되지 않습니다. 저작권법에 따른 이용자의 권리는 위의 내용에 의하여 영향을 받지 않습니다. 이것은 이용허락규약(Legal Code)을 이해하기 쉽게 요약한 것입니다. Disclaimer 저작자표시. 귀하는 원저작자를 표시하여야 합니다. 비영리. 귀하는 이 저작물을 영리 목적으로 이용할 수 없습니다. 변경금지. 귀하는 이 저작물을 개작, 변형 또는 가공할 수 없습니다.
1
TABLE OF CONTENTS
TABLE OF CONTENTS 1 ABSTRACT 2 LIST OF ABBREVIATIONS 1 LIST OF FIGURES 2 LIST OF TABLES 5 INTRODUCTION 6MATERIALS AND METHODS 15
RESULTS 24
Radical scavenging activity 24
Cellular toxicity 26
Nitric oxide suppression in RAW264.7 cells 28
Inhibitory effects of NE on COX-2 and iNOS protein levels 30
Inhibitory effects of NE on TNF-α, IL-6 and IL-1β 34
RNA sequencing quality analysis 40
Gene Ontology analysis 44
Differential gene expression 49
STRING protein-protein analysis of differentially expressed proteins 55
IPA gene network analysis 56
Regulator effect network analysis in IPA 57
Cellular toxicity 67
Inhibitory effect on mushroom tyrosinase activity 69
Inhibitory effect on cellular tyrosinase activity 71
Inhibitory effect on melanin synthesis 73
DISCUSSION 77
CONCLUSION 85
REFERENCES 86
2
ABSTRACT
The present study was performed to evaluate the inhibitory activity of extracts of Narcissus tazetta var. Chinensis on inflammation in RAW 264.7 and melanin synthesis in
B16-F10 melanoma cells. Functional effects of Narcissus flower extract (NFE), Narcissus stem extract (NSE), and Narcissus root extract (NRE) were analyzed. Narcissus extracts (NE) displayed DPPH free radical scavenging activity in a dose-dependent manner. Based on cell viability assay, NFE, NSE and NRE had no cytotoxicity up to 10, 4, 20 µg/mL concentrations in RAW 264.7 cells and 20, 5, 20 µg/mL concentrations in B16-F10 melanoma cells respectively. Based on Western blot analysis, NE significantly inhibited the production of inducible nitric oxide synthase (iNOS) and cyclooxygenase-2 (COX-2) protein expression levels, with concomitant reductions in the production of nitric oxide (NO) in LPS stimulated RAW 264.7 cells. In addition, NE inhibited pro-inflammatory cytokine levels including TNF-α, IL-1β, and IL-6 in LPS stimulated RAW 264.7 cells. NE inhibited both melanin synthesis and tyrosinase activity in α-MSH stimulated B16-F10 melanoma cells in a dose dependent manner. RNA sequencing analysis showed differential gene expression patterns in genes related to immune response, inflammatory response and antioxidant activity in LPS stimulated RAW 264.7 macrophage cells. LPS stimulated differentially expressed 39 genes related to inflammatory response including NF-κB2, AXL, APOE, LDL, TLR4, NF-κB1, IFNB1, IRAK2, NR1H4, Cxcr2, Cxcr6, Ccl28 and Cxcl9 were normalized to the control level by each NE. Overall results suggest that NE scavenged DPPH free radicles dose dependently, exhibited anti-inflammatory effects via attenuating iNOS, COX-2 protein expression, TNF-α, IL-6 and IL-1β pro-inflammatory cytokines expression and normalizing the expression of genes related to inflammation which were perturbed by LPS in RAW 264.7 macrophage cells, and showed anti-melanogenesis effects on α-MSH stimulated B16-F10 melanoma cells by suppressing the cellular tyrosinase activity and melanin synthesis in B16-F10 melanoma cells. Bioactive compounds in NE can
3
be applied for the development of anti-inflammatory drugs in pharmaceutical industry and for the development of anti-melanogenesis drugs in cosmetic industry.
Key Words – Narcissus, antioxidant effect, anti-inflammatory effect, melanin synthesis inhibition, RNA sequencing analysis
1
LIST OF ABBREVIATIONS
AEAC Ascorbic acid Equivalent Antioxidant Capacity
ANOVA One-way analysis of variance
COX-2 Cyclooxygenase-2
DMEM Dulbecco's Modified Eagle Medium
DPPH 2,2-diphenyl-1-picryl-hydrazyl-hydrate
EC50 Effective concentration
ELISA Enzyme-linked immunosorbent assay
FBS Fetal bovine serum
HPLC High-performance liquid chromatography
LPS Lipopolysaccharides
L-DOPA L-3,4-dihydroxyphenylalanine
IL-1β Interleukin 1β
IL-6 Interleukin 6
iNOS Inducible nitric oxide synthase
NF-κb Nuclear factor-κB
NE Narcissus extracts
NFE Narcissus flower extracts
NRE Narcissus root extracts
NSE Narcissus stem extracts
PrepLC Preparative high-performance liquid chromatography
TNF-α Tumor Necrosis Factor-α
2
LIST OF FIGURES
Figure 1. Mechanism of iNOS and COX-2 expression ... 7
Figure 2. Production of nitric oxide from arginine as catalyzed by nitric oxide synthase (NOS) ... 9
Figure 3. Melanin synthesis pathway [88]. ... 12
Figure 4. Melanin biosynthesis [82]... 13
Figure 5. RNA Sequencing ... 21
Figure 6. Effects of NE on DPPH radical scavenging ... 25
Figure 7. Effects of NE on RAW 264.7 macrophage cell viability. ... 27
Figure 8. Inhibitory effects of Effects of NE on NO production in LPS-stimulated Raw 264.7 macrophage cells. ... 29
Figure 9. Effects of NFE on COX-2 and iNOS production in LPS-stimulated Raw 264.7 macrophage cells. ... 31
Figure 10. Effects of NSE on COX-2 and iNOS production in LPS-stimulated Raw 264.7 macrophage cells. ... 32
Figure 11. Effects of NRE on COX-2 and iNOS production in LPS-stimulated Raw 264.7 macrophage cells. ... 33
Figure 12. Inhibitory effect of NE on the proinflammatory cytokine production in LPS stimulated RAW 264.7 macrophage cells ... 35
Figure 13. Inhibitory effect of NE on the proinflammatory cytokine production in LPS stimulated RAW 264.7 macrophage cells. ... 36
Figure 14. Inhibitory effect of NE on the proinflammatory cytokine production in LPS stimulated RAW 264.7 macrophage cells. ... 37
Figure 15. Migration patterns of RAW 264.7 cells treated with or without LPS and NE. .... 42
3
Figure 17. The Gene Ontology analysis of RAW 264.7 cells treated with or without LPS and NE as a percentage of total significant ... 45 Figure 18. Gene Ontology annotation analysis of RAW 264.7 cells treated with or without
LPS and NE as a percentage of up significant and percentage of down significant . 46 Figure 19. Protein-protein interaction (PPI) network constructed of differentially expressed
genes (DEGs) identified in RAW 264.7 macrophage cells treated with LPS and NFE. ... 58 Figure 20. IPA gene network analysis of differentially expressed genes (DEGs) identified in
RAW 264.7 macrophage cells treated with LPS and NFE. ... 59 Figure 21. Upstream regulator effect analysis of chemotaxis and cell migration pathways of
differentially expressed genes (DEGs) identified in RAW 264.7 macrophage cells treated with LPS and NFE.using Ingenuity Pathway Analysis (IPA). ... 60 Figure 22. Protein-protein interaction (PPI) network constructed of differentially expressed
genes (DEGs) identified in RAW 264.7 macrophage cells treated with LPS and NSE. ... 61 Figure 23. IPA gene network analysis of differentially expressed genes (DEGs) identified in
RAW 264.7 macrophage cells treated with LPS and NSE. ... 62 Figure 24. Upstream regulator effect analysis of chemotaxis and cell migration pathways of
differentially expressed genes (DEGs) identified in RAW 264.7 macrophage cells treated with LPS and NSE.using Ingenuity Pathway Analysis (IPA). ... 63 Figure 25. Protein-protein interaction (PPI) network constructed of differentially expressed
genes (DEGs) identified in RAW 264.7 macrophage cells treated with LPS and NRE. ... 64 Figure 26. IPA gene network analysis of differentially expressed genes (DEGs) identified in
4
Figure 27. Upstream regulator effect analysis of chemotaxis and cell migration pathways of differentially expressed genes (DEGs) identified in RAW 264.7 macrophage cells treated with LPS and NRE.using Ingenuity Pathway Analysis (IPA). ... 66 Figure 28. Effects of NE on B16-F10 melanoma cell viability. ... 68 Figure 29. Inhibitory effect of NE on mushroom tyrosinase activity ... 70 Figure 30. Inhibitory effect of NE on α-MSH-stimulated cellular tyrosinase activity in
B16-F10 melanoma cells. ... 72 Figure 31. Inhibitory effect of NE on α-MSH-stimulated melanogenesis in B16-F10
melanoma cells. ... 74 Figure 32. Microscopic images (100X) of α-MSH-stimulated B16-F10 melanoma cells
incubated with varying concentration of (A) NFE (B) NSE and (C) NRE ... 76 Figure 33. Model of the effects of NE on LPS stimulated RAW 264.7 macrophage cells .... 83 Figure 34. Model of the effects of NE on α-MSH stimulated B16-F10 melanoma cell ... 84
5
LIST OF TABLES
Table 1. Chromatographic conditions in Agilent 1220 Infinity II LC ... 16
Table 2. RNA QC Results ... 41
Table 3. Differential gene expression of LPS stimulated RAW 264.7 macrophage cells... 47
Table 4. Differential gene expression of LPS stimulated RAW 264.7 macrophage cells treated with NFE (5µg/mL) ... 47
Table 5. Differential gene expression of LPS stimulated RAW 264.7 macrophage cells treated with NSE (2µg/mL). ... 48
Table 6. Differential gene expression of LPS stimulated RAW 264.7 macrophage cells treated with NRE (10µg/mL) ... 48
Table 7. Up-regulated genes in LPS treated RAW 264.7 cells and normalized by NFE ... 51
Table 8. Up-regulated genes in LPS treated RAW 264.7 cells and normalized by NSE ... 52
Table 9. Up-regulated genes in LPS treated RAW 264.7 cells and normalized by NRE ... 53 Table 10. Down-regulated genes in LPS treated RAW 264.7 cells and normalized by NFE 54 Table 11. Down-regulated genes in LPS treated RAW 264.7 cells and normalized by NSE 54 Table 12. Down-regulated genes in LPS treated RAW 264.7 cells and normalized by NRE 54
6
INTRODUCTION
Narcissus belong to the family of Amaryllidaceous are widely used as medicinal plants due to their biological properties including inflammation, oxidant and anti-melanogenesis activities [46, 64]. Narcissus tazetta var. Chinensis species have flavonoids and phytochemicals including glucomannan, pseudolycorine, lycorine, and tazettine which have biological activities [21, 34, 43]. The present study was performed to evaluate the diverse biological activities including oxidant, inflammatory, and anti-melanogenesis effects of phytochemicals in Narcissus tazetta var. Chinensis.
Inflammation is a complex biological process and a part of the defense mechanism of organisms in response to noxious stimuli including pathogens, chemicals or microbiological toxins which results in various pathologies [1, 27, 54]. Inflammation could be divided into two major groups as acute or chronic. Acute inflammation is the initial response of the body in the presence of harmful stimuli which is short term. Chronic inflammation is known to be the prolonged inflammatory response which is caused by pro-inflammatory mediators and involved in changing the types of cells present at inflamed site [42].
During inflammation, the influx of neutrophils and macrophages into the site of inflammation causes the pathogenesis of inflammatory conditions [38]. Macrophages become activated in response to microbial infections and rapidly differentiate to express several inflammatory responses including phagocytosis, secretion of cytokines and chemokines [30, 68, 76]. Lipopolysaccharide (LPS), cell wall component of gram-negative bacteria stimulates through Toll-like receptor 4 (TLR4), a membrane- bound pattern recognition receptor, resulting in the activation of a series of signaling events including NF-κB, and triggers inflammation through the production and release of pro-inflammatory
7
mediators and cytokines which initiate and maintain the inflammatory response [20]. Inflammatory mediators and cytokines induce the recruitment of neutrophils and increase the ROS production with mitochondrial interaction [6, 81]. Neutrophils abundantly express myeloperoxidase, which increase the bacterial lysis and amplifies the LPS release during gram-negative bacteria infection and subsequently promotes inflammation. Hence, attenuating macrophage activation could be a potential therapeutic target in inflammatory diseases [31].
8
Typically, NF-κB retains in a latent cytoplasmic form bound to nuclear factor of kappa light polypeptide gene enhancer in B-cells inhibitor, alpha (IκBα) and beta (IκBβ) inhibitor proteins, which prevent nuclear translocation of NF-κB [2]. Following cell stimulation, IκBα inhibitor protein is rapidly phosphorylated and degraded, and NF-κB is activated [15]. Activated NF-κB regulates the transcription of immune and inflammatory related genes including IL-1β, IL-6, and TNF-α like pro-inflammatory cytokines, and COX-2 and iNOS like inflammatory mediators [3, 25, 35] [Figure 1].
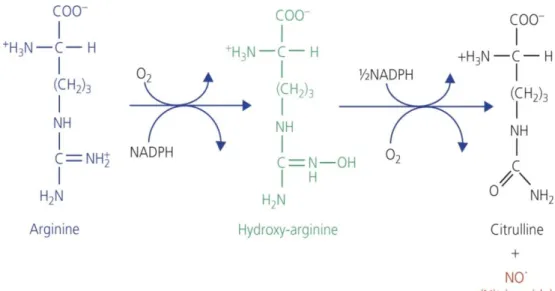
iNOS is induced in response to LPS, and a variety of pro-inflammatory cytokines increase the NO production intensifying inflammation [50]. NO, a pro-inflammatory mediator, and is significantly elevated during inflammation in LPS-stimulated macrophages by nitric oxide synthase (NOS) converting L- arginine into citrulline, and then peroxynitrite (ONOO-) is synthesized. Presence of large amount of cytotoxic ONOO- leads to tissue damage as a consequence of oxidative stress and DNA damage [28] [Figure 2].
9
Figure 2. Production of nitric oxide from arginine as catalyzed by nitric oxide synthase (NOS)
10
The expression of COX-2 is induced by inflammatory stimulus, inflammatory cytokines or growth factors. COX-2 is important for the production of pro-inflammatory factor PGE2 which further contributes to inflammation. [44, 77]. Therefore, discovery of therapeutic agents that can inhibit pro-inflammatory cytokines (TNF-α, IL-1β, and IL-6), NO, iNOS, COX-2, and NF-κB translocation are critical for the treatment of inflammation. The present study was performed to evaluate the anti-inflammatory effect of NE on LPS stimulated RAW 264.7 macrophage cells.
Mitochondrial respiration, NADPH oxidase and the xanthine/xanthine oxidase system, generates. superoxide (O2
-) which can either react with NO to form highly reactive peroxynitrite (ONOO-) or converts into H2O2 under the influence of SOD (superoxide
dismutase). Oxidative stress can have both direct and indirect effects on macrophage function [37]. Oxidative stress affects pro-inflammatory chemokine and cytokine production, and macrophage recruitment and inflammation [61].
UV induces photo-aging with uneven pigment distribution, and induces cutaneous melanomas and melanocyte dysplasia in chronically sun-exposed skin [53]. UVR-induced photo damage, and its repair signals induce melanogenesis in skin [4]. Antioxidants which scavenge free radicals have a potential whitening effect on skin [87].
Melanogenesis is a physiological process resulting the synthesis and distributing melanin pigments [19]. Melanin is produced in melanocytes within membrane-bound organelles known as melanosomes and provide colour to skin, hair and eyes of animals while protecting the underlying tissues from UV damage [39, 74]. Since abnormal melanism including freckles, solar lentigines and dark spots are considered to be aesthetically undesired, introduction of an effective melanin inhibitor has a great attention in the field of cosmetics [91].
11
Melanogenesis can be directly stimulated by ultraviolet radiation (UV) of solar light or indirectly by keratinocyte-derived factors including α-MSH (α-melanocyte stimulating hormone) endothelins, growth factors, and cytokines [12]. α-MSH is released by keratinocytes, and binds with melanocortin 1 receptor (MC1R), which increases cAMP levels within the melanocytes and increases the transcription of microphthalmia-associated transcription factor (MITF). MITF triggers transcription of numerous pigmentation genes essential for melanin synthesis including tyrosinase, TRP1, and TRP2 [10] [Figure 4].
12
13
14
Melanin synthesis is mainly controlled by tyrosinase, TRP1, and TRP2 enzymes among which tyrosinase is a bi-functional rate-limiting enzyme that modulates melanin production by catalyzing the first and rate limiting steps, the hydroxylation of tyrosine to L-DOPA and the oxidation of L-L-DOPA in dopaquinone [19]. Therefore, inhibition of tyrosinase, is a common target for depigmenting agents in modulating skin pigmentary abnormalities. The present study revealed inhibitory effect of Narcissus tazetta var. Chinensis against melanogenesis via inhibition of tyrosinase in α-MSH stimulated B16-F10
15
MATERIALS AND METHODS
Materialsα-melanocyte stimulating hormone (α-MSH), 2,2-diphenyl-1-picrylhydrazyl (DPPH), L-Ascorbic Acid (AA), L-3,4-dihydroxyphenylalanine (L-DOPA), mushroom tyrosinase, phenylmethylsulfonyl fluoride (PMSF) Lipopolysaccharides (LPS), iNOS and COX-2 primary antibodies were purchased from Sigma Aldrich [40]. Beta Actin primary antibody was purchased from Thermofisher [40], Griess Reagent System from Promega [40] and Mouse IL-2, Mouse IL-1β, Mouse IL-6 ELISA Complete Kit and Tris-Glycine-PAG non SDS Precast Gel (10%) from Koma biotech (Korea). B16-F10 mouse melanoma cell line was purchased from ATCC [40] and RAW 264.7 cells from the Korean Cell Line Bank (Korea). Triton X-100 was purchased from Bio-Rad Laboratories [40], Dulbecco’s modified Eagle’s medium (DMEM) from Life Technologies [40] Western Lumi Pico, and EZ-Cytox from DogenBio (Korea). All other reagents were purchased from commercial sources and were of the analytical grade.
Sample preparation
Narcissus tazetta var. Chinensis was collected and samples were washed and
rinsed carefully in fresh water and allowed to dry at room temperature. Dried samples were separated into flower, stem, and root and fifty grams of Narcissus powder was soaked in 1 L of 80% ethanol (ethanol/water=80/20, v/v) and was incubated for 24 hrs at room temperature to facilitate extraction. The extract was filtered using Whatman 0.45 µm pore sized filter paper, and the filtrate was diluted to final concentration of 16mg/mL (w/v).
16
Chromatographic analysis
Ethanolic NE with final concentration of 16mg/mL (w/v) was rotary evaporated to remove ethanol and 80mg/mL (w/v) of aqueous NE was obtained. Waters 2998 photodiode array detector (Waters, UK) with SunFire C18 column was used to identify HPLC chromatograms. Following identification of peaks using HPLC, 80mg/mL NE was filtered and diluted into 30mg/mL using Methanol. 500 μL of the 30mg/mL standard solutions were injected into the column set at 30 °C. The analysis was carried out using YMC-PACK ODS-A column in ODS-Agilent Technologies 1229 Infinity II LC preparative LC machine (ODS-Agilent Technologies, USA).
Table 1. Chromatographic conditions in Agilent 1220 Infinity II LC
Chromatographic condition
Solvent Acetonitrile
Flow rate 2,000mL/min
Retention time 90 Min
Injection Volume 30.00µL
Temperature 30˚C
VWD (Variable wavelength detector) 230nm
Cell culture and treatment
Murine macrophage cell (RAW 264.7) cells and murine melanoma cell B16-F10 melanoma cells were cultured in DMEM supplemented with 10% FBS and 1% penicillin-streptomycin. Cells were maintained and incubated in modified atmospheric condition of 5% CO2 and at 37˚C ambient temperature. Cells were sub-cultured within two days intervals.
Cultured cells in exponential phase at 80% confluence from passage 4-6 were used for the experiments.
17
DPPH assay
The antioxidant activity of Narcissus extracts were determined by measuring the DPPH scavenging ability of Narcissus extracts according to Sanchez-Moreno et al. with slight modifications [71]. Various concentrations of Narcissus extracts dissolved in DMSO were incubated with ethanolic 0.1mM DPPH at room temperature for 30 minutes. DPPH free radicals react with antioxidants in samples, turn violet colour DPPH in to a colourless form decreasing the absorbance at 525 nm in UV spectrophotometer (Mecasys, Korea). Results were expressed as percentages of control (100%), and the concentration of extracts required to cause a 50% decrease in the absorbance was calculated as EC50 value. The radical scavenging ability (%) of the samples was calculated as [1 – (Absorbance of a group added to sample/ Absorbance of a group non-added to sample)] x 100 and calculated as EC50, the concentration of sample needed to scavenge DPPH free radicals by 50%. EC50 of GTFE was expressed as ascorbic acid equivalent antioxidant capacity (AEAC). AEAC (mg AA/100g sample) = EC50 (AA) / EC50 (sample) × 105 [63]. The EC50 of AA used for the calculation of AEAC was 0.0062 mg/Ml
Cell viability assay (MTT assay)
The commonly used cytotoxicity assay, MTT assay proved the
cytocompatibility of NE with
RAW 264.7 macrophage and B16-F10 melanoma cells. RAW 264.7 macrophage and B16-F10 melanoma cells were cultured separately in 5 × 10⁴ cells/well cell density in 96 well plates. After 24 hrs of cell seeding, cells were treated with various concentrations of Narcissus samples for 24 hrs. Cell media was removed using a suction valve and 10 μl of EZ-Cytox Cell Viability Assay Kit solution mixed with 90 μL DMEM was then added into each well followed by 2 hrs incubation at 37 °C in a 5% CO2 incubator, and the absorbance at 450 nm was determined in a ELISA micro plate reader (Gordig, Austria). The percentage of cell viability was calculated.18
Cell viability (%) = (mean absorbency in test wells)/(mean absorbency in control wells) × 100.
Measurement of Nitric oxide levels
RAW 264.7 cells were seeded in 6 well plates at a cell density of 1 × 10⁶ cells/well for 24 hrs. Cells were treated with Narcissus samples for 1 hr, and then incubated with LPS for 24 hrs. Culture supernatant 50 µL from each sample was mixed with an equal volume of sulfanilamide and N-1-naphthylethylenediamine dihydrochloride (Griess Reagent System) under acidic (phosphoric acid) conditions and incubated for 10 min at room temperature (RT) [49]. The absorbance was measured against a standard sodium nitrite curve at 550 nm wavelength in a ELISA micro plate reader [13].
Western blot analysis
RAW 264.7 cells were seeded in 6 well plates at a cell density of 1 × 10⁶ cells/well for 24 hrs. Cells were treated with Narcissus samples for 1 hr, and then incubated with LPS for 24 hrs. Following incubation, the cells were washed with PBS and frozen at -80°C for 30 min and RIPA buffer with protease inhibitor was added at RT. Then, the whole-cell lysate was transferred to micro-centrifuge tubes and centrifuged at 12,000 rpm at 4°C for 10 min. The supernatant was separated and sample protein concentrations were assessed by Bradford assay. Cellular proteins were mixed with loading buffer and boiled at 94°C for 5 min. Based on the Bradford assay equal amount of proteins were loaded into Tris-Glycine-Polyacrylamide gels, non-sodium dodecyl sulfate precast gel (10%). After electrophoresis (100 V, 120 min), cellular proteins were transferred onto a nitrocellulose membrane (Koma Biotech, Korea) and subjected to immunoblotting for overnight at 4°C. Then membranes were blocked with 5 % skim milk and incubated with primary antibodies in various dilutions suggested by manufactures. After three washes (10 min/wash) with TBST, blots were further
19
incubated with an anti-mouse or anti-rabbit IgG-horseradish peroxidase-conjugate antibody at a 1:3000 dilution for 1 h at RT and were developed using EZ-Westeren Lumi Pico solution (Dogen, Korea) in an enhanced Chemi-luminescence Bioimaging Instrument (NeoScience Co., Ltd., Korea). Protein expression of COX-2, iNOS and Beta-actin proteins were determined by western blot analysis [36].
Enzyme-linked immunosorbent assay (ELISA)
RAW 264.7 cells were cultured and treated with Narcissus samples and stimulated with LPS for 24 hrs as they were for the western blot analysis. The concentration of TNF-α, Interleukin-1, Interleukin-1β and Interleukin-6 production were assayed using an enzyme-linked immunosorbent assay (ELISA) kits (Koma biotech, Korea) according to the manufacturer’s instructions. Briefly plate was prewashed with washing solution and incubated with samples for 2 hrs, detection antibody for 2 hrs, colour development enzyme for 30 min at RT following 4 times washing at each step. Then colour development solution was added and reaction was stopped by adding stop solution based on visual observation. Absorbance was measured using a micro titer plate reader at 450nm wavelength.
Total RNA isolation, library preparation, sequencing and data analysis
RAW 264.7 cells were cultured in 6 well plates (1 × 10⁶ cells/well) and incubated at 37°C, for 48 hrs. Cells were exposed to α-MSH and different concentrations of NE. Following RAW 264.7 cell cultivation and NE sample treatment, total RNA was collected by dissolving cells by addition of 500 μL of Trizol reagent/well (Invitrogen, USA) according to manufacturer’s instructions, and were stored at -80°C until use. RNA quality was evaluated by Agilent 2100 bioanalyzer using the RNA 6000 Nano Chip (Agilent Technologies, Netherlands), and RNA quantification was carried out using ND-2000 Spectrophotometer (Thermofisher, USA). Based on manufacturer’s instructions a library for control and test RNAs was constructed using SENSE 3’ mRNA-Seq Library Prep Kit (Lexogen, Austria).
20
Total RNA 500 ng was prepared and an oligo-dT primer containing an Illumina-compatible sequence at its 5’ end was hybridized to the RNA and reverse transcription was performed. Following RNA degradation complimentary strand synthesis was started by random primer containing an Illumina-compatible linker sequence at its 5’ end. Magnetic beads were used to remove all reaction components. The library was amplified to add the complete adapter sequences required for cluster generation. The completed library was purified from PCR components. High-throughput sequencing was performed as single-end 75 sequencing using NextSeq 500 (Illumina, USA). SENSE 3’ mRNA-Seq reads were aligned using Bowtie2 version 2.1.0 [41]. Bowtie2 indices were either generated from genome assembly sequence or the representative transcript sequences for aligning to the genome and transcriptome. The alignment file was used for assembling transcripts, estimating their abundances and detecting differential expression of genes. Differentially expressed genes were determined based on counts from unique and multiple alignments using EdgeR within R version 3.2.2 (R development Core Team, 2011) using Bioconductor version 3.0 [24]. The RT (Read Count)data were processed based on Quantile normalization method using the Genowiz ™ version 4.0.5.6 (Ocimum Biosolutions, India). Cytoscape (version 2.7), an open source bioinformatics platform developed by the Institute of Systems Biology, Seattle, WA, was used to construct network diagrams and to illustrate clustering of the genes in our dataset within specific pathways. Gene classification was based on searches done by Medline databases (National Centre for Biotechnology Information, USA).
21
22
Mushroom tyrosinase inhibition assay
The inhibitory effect of NE on, mushroom tyrosinase activity was measured as described previously. 130 µL of varying concentrations of NE samples 0, 250, 500, 1,000, 2,000, 4,000 and 8,000 µg/mL were mixed with 20 µL of mushroom tyrosinase (1250 U/mL) in 96-well micro plate. Mixtures were incubated with 120 µL of 1.5 mM L-DOPA at 37°C for 5 min and absorbance was measured at 490 nm using ELISA micro plate reader
.
Cellular tyrosinase inhibition assay
Cellular tyrosinase activity was determined as described previously with slight modifications [84]. Briefly, B16-F10 melanoma cells were incubated at a density of 1 × 10⁶ cells in 6 well plates for 24 hrs. Cells were treated with increasing concentrations of Narcissus samples for 1 hr, and then incubated with 20nM α-MSH for 48 hrs. Then the cells were washed twice with ice-cold PBS and lysed in 500 μL of PBS containing 1% Triton X-100 and 2 mM PMSF by freezing and thawing. The cell lysates were centrifuged at 15,000 rpm for 30 min at 4 °C. Then 150 µL of the supernatant was mixed with 150 µL of reaction solution 2 mM L-DOPA, incubated at 37°C for 10 min, and the absorbance at 490 nm was measured using an ELISA plate reader.
Cellular melanin synthesis inhibition assay
Melanin contents were measured as previously described with slight modifications [72]. B16-F10 murine melanocytes were seeded at 1 × 10⁶ cells/well cell density for overnight in 6 well plates and then treated Narcissus samples for 1 hr, and then incubated with 20nM α-MSH for 48 hrs. Cells were washed with PBS, harvested by trypsinization, and centrifuged for 5 min at 1200 × g. The cell pellets were oven dried at 60°C and then pellets were dissolved in 500 µL of 1.0 M NaOH containing 10% DMSO for 30 min at 80 °C
23
heating block. Melanin wad dissolved by vortexing and then melanin contents of 300 µL supernatants were measured at 490 nm.
Data analysis
Data were expressed as means ± S.D. from minimum three independent experiments. Data were statistically analyzed with IBM SPSS Statistics (Ver.17.0; USA). The statistical differences among groups were analyzed with one way analysis (ANOVA) followed by Turkey’s test. *p<0.01, **p<0.001 and ***p<0.0001 indicate statistically significant differences from the control group.
STRING analysis was done using STRING software version 9.0 and IPA data were analyzed through the use of QIAGEN’s Ingenuity® Pathway Analysis (IPA®, QIAGEN Redwood City, www.qiagen.com/ingenuity).
24
RESULTS
Radical scavenging activity
DPPH radical scavenging activity assay was conducted to evaluate the antioxidant activity of NE. NE expressed DPPH free radical scavenging activity concentration dependently. DPPH radical scavenging activities of 100, 200, 400, and 800 µg/mL of NFE were estimated to be 35%, 70%, 89%, and 93% respectively (Fig. 6A). DPPH radical scavenging activities of 100, 200, 400, and 800 µg/mL of NSE was estimated to be 19%, 33%, 61%, and 91% respectively (Fig. 6B). For NRE, DPPH radical scavenging activities of 100, 200, 400, and 800 µg/mL was estimated to be 4%, 9%, 17%, and 29% respectively (Fig. 6C). The EC50 values of NFE, NSE, and NRE for 0.1Mm DPPH were estimated to be 182 µg/mL, 319 µg/mL, and 1155 µg/mL which are corresponding to 3,406, 1,943, and 536 mg of ascorbic acid / g based on the ascorbic acid equivalent antioxidant capacity (AEAC) calculation as described in Materials and Methods.
25 0 5 10 15 20 25 30 35 40 0 100 200 400 800 DPPH ra dical scav ending act ivity (% of cont rol) NRE Concentration (µg/mL) ** ***
DPPH - Root
0 10 20 30 40 50 60 70 80 90 100 0 100 200 400 800 DPPH ra dical scav ending act ivity (% of cont rol) NSE Concentration (µg/mL) *** *** *** ***DPPH - Stem
0 10 20 30 40 50 60 70 80 90 100 0 100 200 400 800 DPPH ra dical scav ending act ivity (% of cont rol) NFE Concentration (µg/mL) *** *** *** ***DPPH -Flower
A
B
C
Figure 6. Effects of NE on DPPH radical scavenging
(A) DPPH radical scavenging activity of NFE, (B) NSE, and (C) NRE. Data are the means
of ± S.E. for three independent experiments. (*p < 0.01, **p < 0.001, and ***p < 0.0001 compared with the control).
26
Cellular toxicity
To determine whether Narcissus samples have a cytotoxic effect, RAW 264.7 macrophage cells were treated with indicated concentrations of samples for 24 hrs, and cell viabilities were observed using an MTT assay. No cytotoxicity was observed with NFE in RAW 264.7 cells upto the concentrations of 10 μg/mL, whereas the cellular cytotoxicity was increased significantly by 24% at the concentrations of 15 μg/mL in RAW 264.7 cell (Fig. 7A). NSE showed cytotoxicity which was increased significantly by 42% at the concentrations of 5 μg/mL in RAW 264.7 cell (Fig. 7B). In addition, cellular cytotoxicity was significantly increased in exposure to NRE by 40% at the concentration of 40 μg/mL in RAW 264.7 cell (Fig. 7C).
27 0 20 40 60 80 100 120 0 1 5 10 15 20 40 80 Cell Viabil ity (% of Co nt rol) NRE Concentration (µg/mL) *** ***
MTT - Root
0 20 40 60 80 100 120 0 1 2 4 5 10 15 20 Cell Viabil ity (% of Co nt rol) NSE Concentration (µg/mL) *** *** *** ***MTT - Stem
0 20 40 60 80 100 120 0 1 5 10 15 20 40 80 Cell Viabil ity (% of Co nt rol) NFE Concentration (µg/mL) *** *** *** ***MTT - Flower
A
B
C
Figure 7. Effects of NE on RAW 264.7 macrophage cell viability.
(A) RAW 264.7 macrophage cell viability in different concentrations of NFE,. (B) RAW
NSE, and (C) NRE. Data are the means of ± S.E. for three independent experiments. (*p < 0.01, **p < 0.001 and ***p < 0.0001 compared with the control).
28
Nitric oxide suppression in RAW264.7 cells
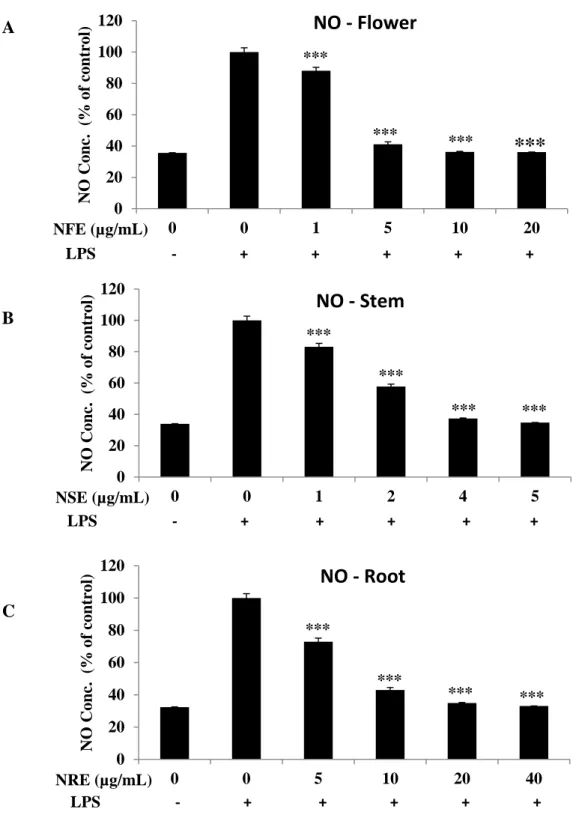
Since multiple intracellular mechanisms make NO to act as a pro-inflammatory mediator, the present study examined the effects of NE on NO production in LPS stimulated RAW264.7 cells. As shown in Fig. 8, NO level in media was markedly increased following LPS treatment. However, NO production was decreased by 12%, 60%, 64% and 66% by addition of 1, 5, 10 and 20 µg/mL of NFE. By addition of 1, 2, 5 and 10 µg/mL of NSE 17%, 43%, 63% and 66% of NO productions were inhibited. 28%, 57%, 66% and 67% of NO productions were attenuated by addition of 5, 10, 20 and 30 µg/mL of NRE respectively.
29 0 20 40 60 80 100 120 0 0 5 10 20 40 NO Con c. ( % o f co ntro l) *** NRE (µg/mL) LPS - + + + + + *** *** ***
NO - Root
0 20 40 60 80 100 120 0 0 1 2 4 5 NO Con c. ( % o f co ntro l) *** NSE (µg/mL) LPS - + + + + + *** *** ***NO - Stem
0 20 40 60 80 100 120 0 0 1 5 10 20 NO Con c. ( % o f co ntro l)***
NFE (µg/mL) LPS - + + + + + *** *** ***NO - Flower
A
B
C
Figure 8. Inhibitory effects of Effects of NE on NO production in LPS-stimulated Raw 264.7 macrophage cells.
Inhibition of NO production with different concentrations of (A) NFE, (B) NSE, and (C) NRE. Data are the means of ± S.E. for three independent experiments. (*p < 0.01, and ***p < 0.0001 compared with the control).
30
Inhibitory effects of NE on COX-2 and iNOS protein levels
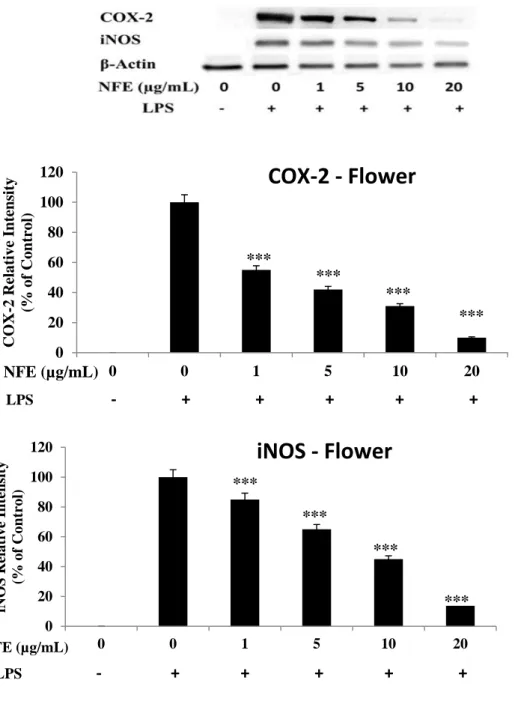
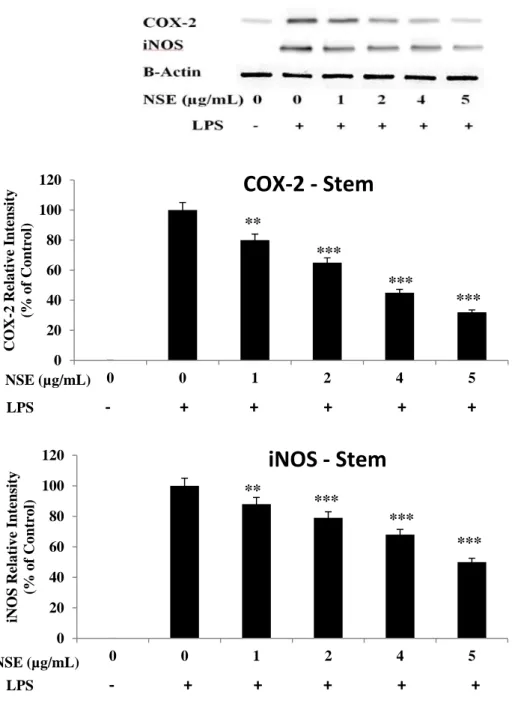
The effects of NE on COX-2 and iNOS protein expression levels were investigated by Western blotting. Based on densitometry, NE markedly suppressed COX-2 and iNOS protein expression levels concentration dependently. LPS-induced COX-2 expressions were reduced by 42%, 58%, 70%, and 85% at 1, 5, 10 and 20 µg/mL of NFE; 15%, 30%, 50%, and 65%, at 1, 2, 4 and 5 µg/mL of NSE; and 10%, 18%, 60%, and 90% at 5, 10, 20 and 30 µg/mL of NRE respectively. LPS-induced iNOS expressions were reduced by 15%, 30%, 50%, and 90% at 1, 5, 10 and 20 µg/mL of NFE; 10%, 18%, 32%, and 45%, at 1, 2, 4 and 5 µg/mL of NSE; and 23%, 76%, 83%, and 95% at 5, 10, 20 and 30 µg/mL of NRE respectively (Fig. 9, 10, 11).
31 0 20 40 60 80 100 120 0 0 1 5 10 20 COX -2 Rela tiv e Int ensity (% of Co nt ro l) *** NFE (µg/mL) LPS
- + + + + +
*** ***COX-2 - Flower
*** 0 20 40 60 80 100 120 0 0 1 5 10 20 iNOS Relat ive Int ensity (% of Co nt rol) *** NFE (µg/mL) LPS- + + + + +
*** ***iNOS - Flower
***Figure 9. Effects of NFE on COX-2 and iNOS production in LPS-stimulated Raw 264.7 macrophage cells.
Raw 264.7 cells were preincubated with LPS for 24 h, and then incubated without or with indicated concentrations of NFE for 24 h. Cell lysates were resolved by 10% SDS–PAGE, transferred to nitrocellulose membranes, and probed with antibodies against iNOS and 2. Band intensities were measured by ImageJ software. Relative amounts of iNOS and COX-2 (B) compared to β-actin. Data are the means of ± S.E. for three independent experiments.
32 0 20 40 60 80 100 120 0 0 1 2 4 5 iNOS Relat ive Int ensity (% of Co nt rol) *** NSE (µg/mL) LPS
- + + + + +
*** ***iNOS - Stem
** 0 20 40 60 80 100 120 0 0 1 2 4 5 COX -2 Relat ive Int ensity (% of Co nt rol) *** NSE (µg/mL) LPS- + + + + +
*** ***COX-2 - Stem
**Figure 10. Effects of NSE on COX-2 and iNOS production in LPS-stimulated Raw 264.7 macrophage cells.
Raw 264.7 cells were preincubated with LPS for 24 h, and then incubated without or with indicated concentrations of NFE for 24 h. Cell lysates were resolved by 10% SDS–PAGE, transferred to nitrocellulose membranes, and probed with antibodies against iNOS and 2. Band intensities were measured by ImageJ software. Relative amounts of iNOS and COX-2 (B) compared to β-actin. Data are the means of ± S.E. for three independent experiments.
33 0 20 40 60 80 100 120 0 0 5 10 20 40 COX -2 Relat ive Int ensity (% of Co nt rol) *** NRE (µg/mL)
LPS - + + + + +
*** ***COX-2 - Root
** 0 20 40 60 80 100 120 0 0 5 10 20 40 iNOS Relat ive Int ensity (% of Co nt rol) *** NRE (µg/mL)LPS - + + + + +
*** ***iNOS - Root
**Figure 11. Effects of NRE on COX-2 and iNOS production in LPS-stimulated Raw 264.7 macrophage cells.
Raw 264.7 cells were preincubated with LPS for 24 h, and then incubated without or with indicated concentrations of NFE for 24 h. Cell lysates were resolved by 10% SDS–PAGE, transferred to nitrocellulose membranes, and probed with antibodies against iNOS and 2. Band intensities were measured by ImageJ software. Relative amounts of iNOS and COX-2 (B) compared to β-actin. Data are the means of ± S.E. for three independent experiments.
34
Inhibitory effects of NE on TNF-α, IL-6 and IL-1β
The effects of NE on TNF-α, IL-6 and IL-1β pro-inflammatory cytokines production were investigated by ELISA. NE markedly suppressed TNF-α, IL-6 and IL-1β pro-inflammatory cytokines production concentration dependently. LPS-induced TNF-α production was reduced by 10%, 33%, 54% and 78%, by 1, 5, 10 and 20 µg/mL of NFE; 49%, 58%, 60% and 79% by 1, 2, 4 and 5 µg/mL of NSE; and 31%, 48%, 50% and 86% by 5, 10, 20 and 30 µg/mL of NRE respectively. LPS-induced IL-6 production was reduced by 7%, 10%, 22% and 45% by 1, 5, 10 and 20 µg/mL of NFE; 7%, 11%, 23% and 38% by 1, 2, 4 and 5 µg/mL of NSE; and 6%, 23%, 41% and 52% by 5, 10, 20 and 30 µg/mL of NRE respectively. LPS-induced IL-1β production was reduced by 11%, 28%, 21% and 23% by 1, 5, 10 and 20 µg/mL of NFE; 6%, 13%, 15% and 29% by 1, 2, 4 and 5 µg/mL of NSE; and 20%, 24%, 27% and 43% by 5, 10, 20 and 30 µg/mL of NRE respectively (Fig. 12, 13, 14).
35 0 20 40 60 80 100 120 0 0 5 10 20 40 TNF -α Co nc. (% of cont roo l) ** NRE (µg/mL) LPS - + + + + + ** **
TNF-α - Root
0 20 40 60 80 100 120 0 0 1 2 4 5 TNF -α Conc. (% of c ontro ol ) ** NSE (µg/mL) LPS - + + + + + *** ** **TNF-α - Stem
0 20 40 60 80 100 120 0 0 1 5 10 20 TNF -α Co nc. (% of cont roo l) *** NFE (µg/mL) LPS - + + + + + *** ***TNF-α - Flower
A B C .Figure 12. Inhibitory effect of NE on the proinflammatory cytokine production in LPS stimulated RAW 264.7 macrophage cells
The production of TNF-α in LPS stimulated RAW 264.7 cells was determined by ELISA using the supernatant. Data are the means of ± S.E. for three independent experiments. (*p < 0.01, **p < 0.001, and ***p < 0.0001 compared with the control). (A) NFE (B) NSE (C) NRE
36 0 20 40 60 80 100 120 0 0 5 10 20 40 IL -6 Co nc. (% of cont roo l) * NRE (µg/mL) LPS - + + + + + **
IL-6 - Root
0 20 40 60 80 100 120 0 0 1 2 4 5 IL -6 Co nc. (% of cont roo l) * NSE (µg/mL) LPS - + + + + +IL-6 - Stem
0 20 40 60 80 100 120 0 0 1 5 10 20 IL -6 Co nc. (% of cont roo l) *** NFE (µg/mL) LPS - + + + + + *IL-6 - Flower
A BC
Figure 13. Inhibitory effect of NE on the proinflammatory cytokine production in LPS stimulated RAW 264.7 macrophage cells.
The production of IL-6 in LPS stimulated RAW 264.7 cells was determined by ELISA using the supernatant. Data are the means of ± S.E. for three independent experiments. (*p < 0.01, and ***p < 0.0001 compared with the control). (A) NFE (B) NSE (C) NRE
37 0 20 40 60 80 100 120 0 0 5 10 20 40 IL -1 β Co nc. (% of cont roo l) * NRE (µg/mL) LPS - + + + + +
IL-1β - Root
0 20 40 60 80 100 120 0 0 1 2 4 5 IL -1 β Co nc. (% of cont roo l) * NSE (µg/mL) LPS - + + + + +IL-1β - Stem
0 20 40 60 80 100 120 0 0 1 5 10 20 IL -1 β Co nc. (% of cont roo l) * NFE (µg/mL) LPS - + + + + +IL-1β - Flower
A BC
Figure 14. Inhibitory effect of NE on the proinflammatory cytokine production in LPS stimulated RAW 264.7 macrophage cells.
The production of IL-1β in LPS stimulated RAW 264.7 cells was determined by ELISA using the supernatant. Data are the means of ± S.E. for three independent experiments. (*p < 0.01 compared with the control). (A) NFE (B) NSE (C) NRE
38
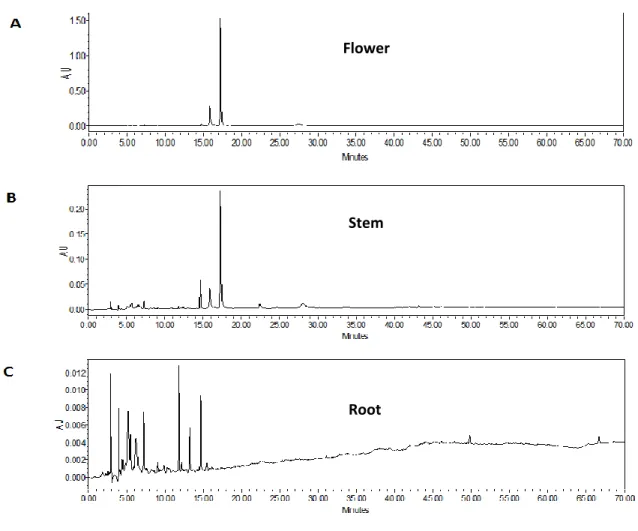
Figure 15. Chromatograms od analytical HPLC analysis of crude Narcissus tazetta var. Chinensis extracts (NE).
HPLC analysis was performed using Waters Model 2489 UV / Visible detector, a Model 2998 Photodiode Array Detector, and a Model 2707 Auto sampler. NE (80 mg / mL) were diluted with methanol to a final concentration of 5 mg / mL. A binary mobile phase SunFire Column, Reversed-Phase 5 μm Spherical Silica (4.6 mm x 250 mm column) consisted with solvent (A) acetonitrile and (B) distilled water was used. (0 to 60 min: 0: 100, 60 to 70 min: 100: 0). The eluate was measured at 230 nm with a VWD detector at a flow rate of 1 mL / min for 90 minutes and the temperature of the column was maintained at 30 ° C. (A) NFE (B) NSE (C) NRE
Flower
Stem
39
Figure 16. Conventional preparative HPLC chromatograms of the crude Narcissus tazetta var. Chinensis extracts (NE)
The PrepLC device was a 1220 Infinity II LC from Agilent Technologies (Agilent, Santa Clara, Calif., USA). Each daffodil flower, stem, and root extract (80 mg / mL) was diluted with methanol to a final concentration of 30 mg / mL. The column was a YMC-Pack ODS-A column (250 mm × 10.0 mm id, 5 μm, 12 nm column) and two mobile phases consisting of solvent (A) distilled water and acetonitrile (B) / Min (0 to 60 min: 0: 100, 60 to 70 min: 100: 0). The eluate was measured at a flow rate of 2 mL / min for 90 minutes with a VWD detector at 230 nm and the temperature of the column was maintained at 30 ° C (A) NFE (B) NSE (C) NRE
40
RNA sequencing quality analysis
RAW 264.7 cells were cultured in 6 well plates (1 × 10⁶ cells/well) and incubated at 37°C, for 48 hrs. Cells were exposed to α-MSH and different concentrations of NE. Following RAW 264.7 cell cultivation and NE sample treatment, total RNA was isolated by dissolving cells in 500 μL of Trizol reagent/well (Invitrogen, USA) according to manufacturer’s instructions, and were stored at -80°C until use. RNA quality of all 5 sample groups including (A) No LPS, (B) LPS, (C) NFE, (D) NSE, and (E) NRE were analyzed prior to further processing and labelling for microarray hybridization. RNA integrity number (RIN) values were checked to assess RNA quality using a mRNA Pico chip. The Agilent 2100 Bioanalyzer system with the RNA Integrity Number (RIN) provides a quantitative measure of RNA degradation. (A) No LPS, (B) LPS, (C) NFE, (D) NSE, and (E) NRE sample groups were qualified for further processing with RIN higher than 7. Based on (28s/18s) data Control (+),Control (-),Flower+LPS, Stem+LPS, and Root+LPS groups showed 1.9, 2, 2, 2.1, and 2 values respectively (Table 2).
41
Table 2. RNA QC Results
No. Sample ng/µl Total
(µg) OD260/280 OD260/230 Ratio(28s/18s) RIN Result
1 Control (+) 5048.9 100.978 1.97 2.01 1.9 9.8 Qualified
2 Control (-) 7399.9 147.998 2.06 2.09 2.0 10.0 Qualified
3 Flower+LPS 4901.5 98.030 1.99 2.05 2.0 10.0 Qualified
4 Stem+LPS 7607.2 152.144 2.11 2.19 2.1 10.0 Qualified
42
Figure 15. Migration patterns of RAW 264.7 cells treated with or without LPS and NE.
Gel electrophoresis of total RNA was isolated from LPS stimulated RAW 264.7 macrophage cells treated with NE and quality control assessment of total RNA (500ng) was determined using the Agilent 2100
43
Figure 16. Peak patterns of RAW 264.7 cells treated with or without LPS and NE.
Electropherogram showing the evaluation of RNA integrity using the Agilent 2100 BioAnalyzer. Samples of total RNA preparations (500 ng) from LPS treated RAW 264.7 cells treated with NE were fractionated resolved. and integrity was evaluated. (A) No LPS
44
Gene Ontology analysis
Gene Ontology (GO) is an important bioinformatics tool to evaluate genome-scale protein function annotation. Roles of genes or proteins are explained by GO terms in eukaryotic cellular process. GO mainly has consists of three separate ontologies: cellular component, molecular function and biological process. GO categories of aging, angiogenesis, apoptotic process, cell cycle, cell death, cell differentiation, cell migration, cell proliferation, DNA repair, extracellular matrix, immune response, neurogenesis, RNA splicing, secretion, antioxidant activity, inflammatory responses and macrophage receptor activity genes up-regulated by LPS are summarized in Table3.
In particular, higher ratio of genes in GO categories of immune response (18-19%), and inflammatory response (17-21%) were up-regulated in all LPS treated cells compared to control (untreated cells) (Table 3).
Particularly, higher ratio of genes in GO categories of immune response (6-8%), and inflammatory response (8-12%) were down-regulated in all LPS treated cells compared to control (untreated cells) (Table 3).
45
Figure 17. The Gene Ontology analysis of RAW 264.7 cells treated with or without LPS and NE as a percentage of total significant
The transcripts RAW 264.7 cells treated with or without LPS and NE were classified into GO categories of (A) LPS/ No LPS (B) NFE+LPS/ No LPS (C) NSE+LPS/ No LPS (D) NRE+LPS/ No LPS on the basis of GO terms as a percentage of total significant
LPS+Flower/ No LPS LPS+Stem / No LPS LPS+ Root/ No LPS LPS / No LPS (A) (B) (C) (D)
46
Figure 18. Gene Ontology annotation analysis of RAW 264.7 cells treated with or without LPS and NE as a percentage of up significant and percentage of down significant
The transcripts RAW 264.7 cells treated with or without LPS and NE were classified into GO categories of (A) LPS/ No LPS (B) NFE+LPS/ No LPS (C) NSE+LPS/ No LPS (D) NRE+LPS/ No LPS on the basis of GO terms as a percentage of up significant and percentage of down significant
A
C
B
47
Table 3. Differential gene expression of LPS stimulated RAW 264.7 macrophage cells
Table 4. Differential gene expression of LPS stimulated RAW 264.7 macrophage cells treated with NFE (5µg/mL)
Total Aging An gioge nesis Ap optos is proce ss Cell cyc le Cell death Cell differ entiat ion Cell m igr ation Cell proli fe rat ion DN A r epair Extrac ell ular matr ix Immu ne re sp ons e Neuroge nesis RN A sp li ci ng Secr et ion An tioxi dan t act ivi ty In flamm ator y re sp ons e Mac rophage re ceptor a cti vit y Gene Number 23282 217 254 638 895 698 2812 608 471 332 449 804 1277 252 418 78 439 48 % of Total 100.0 0.9 1.1 2.7 3.8 3.0 12.1 2.6 2.0 1.4 1.9 3.5 5.5 1.1 1.8 0.3 1.9 0.2 Up significant 1760 23 22 68 43 71 257 71 48 13 37 148 105 9 63 10 75 4 % of Up significant 7.6 10.6 8.7 10.7 4.8 10.2 9.1 11.7 10.2 3.9 8.2 18.4 8.2 3.6 15.1 12.8 17.1 8.3 Dn significant 1671 16 35 50 65 55 265 67 41 20 53 63 125 9 27 7 40 9 % of Dn significant 7.2 7.4 13.8 7.8 7.3 7.9 9.4 11.0 8.7 6.0 11.8 7.8 9.8 3.6 6.5 9.0 9.1 18.8 Total Aging An gioge nesis Ap optos is proc ess Cell cyc le Cell death Cell differ entiat ion Cell m igr ation Cell pro li fe rat ion DN A r epair Extrac ell ular matr ix Immu ne re sp on se Neuroge nesis RN A sp li ci ng Secr et ion An tioxi dan t act ivi ty In flamm ator y re sp ons e Mac rophage re ceptor a cti vit y Gene Number 23282 217 254 638 895 698 2812 608 471 332 449 804 1277 252 418 78 439 48 % of Total 100.0 0.9 1.1 2.7 3.8 3.0 12.1 2.6 2.0 1.4 1.9 3.5 5.5 1.1 1.8 0.3 1.9 0.2 Up significant 2056 23 35 85 56 92 305 75 60 15 49 153 13 10 65 12 92 5 % of Up significant 8.8 10.6 13.8 13.3 6.3 13.2 10.8 12.3 12.7 4.5 10.9 19.0 1.0 4.0 15.6 15.4 21.0 10.4 Dn significant 1507 17 37 50 115 52 237 71 40 32 69 61 116 14 29 7 51 10 % of Dn significant 6.5 7.8 14.6 7.8 12.8 7.4 8.4 11.7 8.5 9.6 15.4 7.6 9.1 5.6 6.9 9.0 11.6 20.8
48
Table 5. Differential gene expression of LPS stimulated RAW 264.7 macrophage cells treated with NSE (2µg/mL).
Table 6. Differential gene expression of LPS stimulated RAW 264.7 macrophage cells treated with NRE (10µg/mL)
Total Aging An gioge nesis Ap optos is proce ss Cell cyc le Cell death Cell differ entiat ion Cell m igr ation Cell proli fe rat ion DN A r epair Extrac ell ular matr ix Immu ne re sp ons e Neuroge nesis RNA sp li ci ng Secr et ion An tioxi dan t act ivi ty In flamm ator y re sp ons e Mac rophage re ceptor act ivi ty Gene Number 23282 217 254 638 895 698 2812 608 471 332 449 804 1277 252 418 78 439 48 % of Total 100.0 0.9 1.1 2.7 3.8 3.0 12.1 2.6 2.0 1.4 1.9 3.5 5.5 1.1 1.8 0.3 1.9 0.2 Up significant 1937 26 36 67 52 73 303 78 48 15 48 153 120 4 64 13 87 4 % Up significant 8.3 12.0 14.2 10.5 5.8 10.5 10.8 12.8 10.2 4.5 10.7 19.0 9.4 1.6 15.3 16.7 19.8 8.3 Dn significant 1708 24 36 65 129 67 266 81 50 42 51 54 127 15 24 9 36 6 % of Dn significant 7.3 11.1 14.2 10.2 14.4 9.6 9.5 13.3 10.6 12.7 11.4 6.7 9.9 6.0 5.7 11.5 8.2 12.5 Total Aging An gioge nesis Ap optos is proce ss Cell cyc le Cell death Cell differ entiat ion Cell m igr ation Cell proli fe rat ion DN A r epair Extrac ell ular matr ix Immu ne re sp ons e Neuroge nesis RN A sp li ci ng Secr et ion An tioxi dan t act ivi ty In flamm ator y re sp ons e Mac rophage re ceptor a cti vit y Gene Number 23282 217 254 638 895 698 2812 608 471 332 449 804 1277 252 418 78 439 48 % of Total 100.0 0.9 1.1 2.7 3.8 3.0 12.1 2.6 2.0 1.4 1.9 3.5 5.5 1.1 1.8 0.3 1.9 0.2 Up significant 2023 24 37 69 58 77 300 81 50 18 53 154 121 6 61 12 87 4 % Up significant 8.7 11.1 14.6 10.8 6.5 11.0 10.7 13.3 10.6 5.4 11.8 19.2 9.5 2.4 14.6 15.4 19.8 8.3 Dn significant 1745 24 30 60 137 62 257 73 49 39 52 60 121 14 33 8 45 6 % of Dn significant 7.5 11.1 11.8 9.4 15.3 8.9 9.1 12.0 10.4 11.7 11.6 7.5 9.5 5.6 7.9 10.3 10.3 12.5
49
Differential gene expression
The differential gene expression of RAW 264.7 cells treated with LPS and NE were observed using RNA sequencing analysis. Based on RNA sequencing results, among 23,282 of total genes in RAW 264.7 cells, 1,760 genes were up-regulated (higher than 2.0) and 1,671 genes were down-regulated (lower than 0.5) in LPS treated cells compared to control (untreated cells). In contrast, 2,056 genes were up-regulated and 1,507 genes were down-regulated in both LPS and 5 µg/mL NFE treated cells compared to control (Table 7). Considering NSE, 1,937 genes were up-regulated and 1,708 genes were down-regulated in both LPS and 2 µg/mL NSE treated cells compared to control (Table 8). In addition 2,023 genes were up-regulated and 1,745 genes were down-regulated in both LPS and 10 µg/mL NRE treated cells compared to control (Table 9).
Analysis of RNA sequencing data showed that 8 genes related to inflammatory response, immune response, antioxidant activity and macrophage receptor activity were screened using ExDEGA 1.1.9.0 software. The expression levels of 39, 43, 41 genes related to inflammation, were down-regulated in exposure to LPS and were normalized to control level by the addition of NFE, NSE and NRE respectively (Table 10, 11, 12). The expression levels of 8, 12, 12 genes related to inflammation were down-regulated in exposure to LPS and were normalized to control level by the addition of NFE, NSE and NRE respectively (Table 10, 11, 12).
Genes including Vpreb3, Nr1h4, IL12B, Cxcl9, Cxcl11, Ccl28, Tnfrsf13c, Sod2 and H2-Eb2 were up-regulated by more than 2 folds compared to the control level by addition of LPS. However, the levels were normalized to control level by the addition of NE. In particular, the expression levels of NF-κB1 and NF-Κb2 genes which are key regulating genes in inflammation were up-regulated by 3 and 2 fold compared to control level by LPS, and were normalized to control level by addition of NE (Table. 7, 8).
50
Genes related to inflammation including Apoe, Hp, Havcr2 were down-regulated by 0.2, 0.3, and 0.2 fold compared to control level by α-MSH, and were normalized to control level by addition of NE (Table. 7, 8, 9).
51
Table 7. Up-regulated genes in LPS treated RAW 264.7 cells and normalized by NFE
Gene Symbol LPS /Control LPS+NFE /Control Gene Name
Vpreb3 3.617 1.000 Pre-B lymphocyte 3
Nr1h4 2.352 1.000 Nuclear receptor subfamily 1 group H member 4
Grap 4.257 1.258 GRB2-related adaptor protein
Hist1h2bf 2.049 0.879 Histone cluster 1, h2b
F12 2.550 1.000 Coagulation factor XII
Ccl28 2.352 1.000 C-C motif chemokine ligand 28
Slc30a8 3.687 1.000 Solute carrier family 30 member 8
Tnfrsf13c 2.458 1.000 TNF receptor superfamily member 13C
Ifnar1 2.155 1.089 Interferon alpha and beta receptor subunit 1
Mx1 3.509 1.079 MX dynamin like gtpase 1
Sod2 2.045 1.130 Superoxide dismutase 2, mitochondrial
H2-Eb2 3.617 1.000 Histocompatibility 2, class II antigen E beta2
Lta 4.878 0.989 Lymphotoxin alpha
H2-L 2.288 1.051 Histocompatibility 2, D region locus L
H2-Q7 3.221 1.062 Histocompatibility 2, Q region locus 7
Trem3 2.256 1.097 Triggering receptor expressed on myeloid cells 3
Camk4 4.555 1.192 Calcium/calmodulin dependent protein kinase IV
Malt1 2.035 1.207 MALT1 paracaspase
Nfkb2 2.121 1.491 Nuclear factor kappa B subunit 2
Card9 2.098 1.329 Caspase recruitment domain family, member 9
Zp3 3.918 1.000 Zona pellucida glycoprotein 3
Rasgrp1 2.352 1.000 RAS guanyl releasing protein 1
Cd1d1 2.748 1.457 CD1d1 antigen
Polr3c 3.286 0.971 Polymerase (RNA) III (DNA directed) polypeptide C
Cxcl9 3.617 1.000 Chemokine (C-X-C motif) ligand 9(
Gbp6 2.187 1.349 Guanylate binding protein 6
Oas1f 2.352 1.000 2'-5' oligoadenylate synthetase 1F
Irak2 2.777 1.395 Interleukin 1 receptor associated kinase 2
Tarm1 3.101 1.396 T cell-interacting, activating receptor on myeloid cells 1
Axl 2.307 0.691 AXL receptor tyrosine kinase
Isg20 2.894 1.397 Interferon-stimulated protein
Gcnt3 2.352 1.000 Glucosaminyl (N-acetyl) transferase 3, mucin type
Ltf 2.352 1.000 Lactotransferrin
Cxcr2 2.957 0.735 Chemokine (C-X3-C motif) receptor 1
Il13 2.352 1.000 Suppression inducing transmembrane adaptor 1
Cd300a 3.311 1.230 CD300a molecule
Cxcr6 2.352 1.000 C-X-C motif chemokine receptor 6
Hhipl1 2.352 1.000 Hedgehog interacting protein-like 1
52
Table 8. Up-regulated genes in LPS treated RAW 264.7 cells and normalized by NSE
Gene Symbol LPS /Control LPS+NSE /Control Gene Name
Gja1 3.397 1.168 Gap junction protein alpha 1
Vpreb3 3.617 1.000 Pre-B lymphocyte 3
Nr1h4 2.352 1.000 Nuclear receptor subfamily 1 group H member 4
Il12b 3.686 1.000 Interleukin 12B
Cplx2 3.750 1.000 Complexin 2
Ccl28 2.352 1.000 C-C motif chemokine ligand 28
Ifnar1 2.155 0.920 Interferon alpha and beta receptor subunit 1
Sod2 2.045 0.931 Superoxide dismutase 2, mitochondrial
H2-Eb2 3.617 1.000 Histocompatibility 2, class II antigen E beta2
H2-T23 3.690 0.815 Histocompatibility 2, T region locus 23
Malt1 2.035 1.271 MALT1 paracaspase
Anxa1 4.026 1.083 Annexin A1
Fas 6.759 1.114 TNF receptor superfamily member 6
Kynu 2.408 1.000 Kynureninase
Nmi 2.143 1.321 N-myc (and STAT) interactor
Rasgrp1 2.352 1.000 RAS guanyl releasing protein 1
Cd1d1 2.748 1.337 CD1d1 antigen
Ripk2 2.637 1.061 Receptor interacting serine/threonine kinase 2
Exosc3 3.029 0.964 Exosome component 3
Tnfsf15 5.041 1.000 Tumor necrosis factor (ligand) superfamily, member 15
Ifnb1 12.395 1.000 Interferon beta 1
Nfkb1 3.033 1.424 Nuclear factor of kappa light polypeptide gene enhancer
in B cells 1, p105
Cxcl9 3.617 1.000 Chemokine (C-X-C motif) ligand 9
Cxcl11 2.469 0.872 Chemokine (C-X-C motif) ligand 11
Gbp6 2.187 1.304 Guanylate binding protein 6
Oas1f 2.352 1.000 2'-5' oligoadenylate synthetase 1F
Irak2 2.777 1.367 Interleukin 1 receptor associated kinase 2
Psg17 2.458 1.000 Pregnancy specific glycoprotein 17
Axl 2.307 0.984 AXL receptor tyrosine kinase
Trim12a 2.458 1.000 Tripartite motif-containing 12A
Nxnl1 3.905 1.002 Nucleoredoxin-like 1
Gcnt3 2.352 1.000 Glucosaminyl (N-acetyl) transferase 3, mucin type
Ltf 2.352 1.000 Lactotransferrin
Cxcr2 2.957 0.836 C-X-C motif chemokine receptor 2
Il13 2.352 1.000 Interleukin 13
Cd300a 3.311 0.850 CD300a molecule
Il1rap 2.842 1.277 Interleukin 1 receptor accessory protein
Cxcr6 2.352 1.000 C-X-C motif chemokine receptor 6