http://dx.doi.org/10.7236/IJASC.2021.10.1.216
Classification of Warm Temperate Vegetations and GIS-based Forest Management
System
Sung-Min Cho
Ph.D., Professor, Dept. of Landscape Architecture, Honam University, Gwangju, S. Korea.
E-mail: [email protected]
Abstract
Aim of this research was to classify forest types at Wando in Jeonnam Province and develop warm temperate forest management system with application of Remote Sensing and GIS. Another emphasis was given to the analysis of satellite images to compare forest type changes over 10 year periods from 2009 to 2019. We have accomplished this study by using ArcGIS Pro and ENVI. For this research, Landsat satellite images were obtained by means of terrestrial, airborne and satellite imagery. Based on the field survey data, all land uses and forest types were divided into 5 forest classes; Evergreen broad-leaved forest, Evergreen Coniferous forest, Deciduous broad-leaved forest, Mixed fores, and others. Supervised classification was carried out with a random forest classifier based on manually collected training polygons in ROI. Accuracy assessment of the different forest types and land-cover classifications was calculated based on the reference polygons. Comparison of forest changes over 10 year periods resulted in different vegetation biomass volumes, producing the loss of deciduous forests in 2019 probably due to the expansion of residential areas and rapid deforestation.
Key Words: Warm Temperate Forest, Satellite Image, Supervised Classification, Management System
1. INTRODUCTION
Managing and cultivating forests generates increasingly complex demands being made on skills, resources and time. When adequate forest data is available, improved management programs can be implemented to ensure the sustainable utilization of the available forest resources for timber, construction, fiber, fuel, furniture and so on. The systematic methods to collect and analyze data to extract pertinent in formation that allows for cost-effective and justifiable decision making is central to strategic forest planning and management. The Korean Forest Service applies those methods for the management of forest harvesting operations, recreational areas, wildlife habitat preservations, mining monitoring and the
protection of endangered species [1]. Warm temperate forests in Korea are important natural products with economical values such as aroma, medicine, antiseptic, roadside trees, and forest grown for scenic beauty because of its unique appearance and tolerance to environmental pollutions.
IJASC 21-1-23
Manuscript Received: March. 9, 2021 / Revised: March. 12, 2021 / Accepted: March. 14, 2021 Corresponding Author: [email protected]
Tel: +82-62-940-5504, Fax: +82-62-940-5617
In the past, warm temperate forests in Korea were used for household fire woods but now they have become important components because of uniqueness in appearance and needs for preservation. In general, warm temperate forests grow in the areas with mean annual temperature between 11oC and
15oC. Mean annual precipitation for growth is about 900~1500mm. Total areas of warm-temperate
forests in Korea are about 9,850ha and most of them are found in Chonnam Province. Wando has about 1,779ha of warm temperate forests, taking about 18% of total areas. Managing the complex natural resources and assessing multiple values of them are difficult planning processes but they can be greatly aided by using Geographic Information System and Remote Sensing. GIS has been used in Korea for forest inventory, timber harvest planning, and wildlife habitat protection [2]. Remote sensing can be defined as a process whereby information is gathered about an object, area or phenomenon without being in direct contact with it [3]. Remotely sensed data are useful tools to analyze vast areas in short period of time, saving time and money for field survey to monitor the changes in natural resources. By combining remotely sensed data and field inventory, large areas of vegetation can be mapped to preserve the high-valued forests and to maintain sustainable monitoring system, meaning GIS and remote sensing techniques are being widely applied. Image interpretation with satellite data was performed in this research to analyze forest types and land covers. The majority of image classification was based on the detection of the spectral response patterns of land cover classes. Although perennial cloud cover often poses problems for passive remote sensing in vegetation analysis, remotely sensed data have been successfully applied in seperating areas of dense forest from degraded and non-forest land cover types [4]. Numerous factors affect the potential success of forest classification using satellite images. One challenge is to select the best image features to be used as the basis of the classification. For the purpose of vegetation mapping, the near and mid infrared bands contain more relevant information than the visible bands, but the most efficient features vary from one application to another [5]. In warm temperate forest, easily recognizable limits between forest types are rare. This makes the allocation of sites to discrete vegetation classes difficult and quite often subjective, and therefore care must be taken in defining the forest classes to be mapped.
2. OBJECTIVES
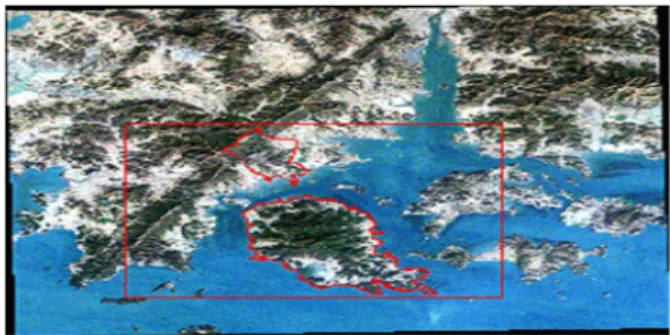
In the past, most land-cover and vegetation classifications have been created using a pixel-based analysis of remotely sensed imagery. These procedures analyse the spectral properties of every pixel within the area of interest without considering the spatial or contextual information related to the pixel of interest [6]. Main goal of this research is the classification of warn temperate forests using multispectral and high spatial resolution Landsat satellite images. This is important for the monitoring of green infrastructure by means of terrestrial, airborne and satellite imagery project, especially for detection and monitoring of forest vegetation as one of the most important factors of life quality [7]. Another emphasis was given to build forest database and analyze warm temperate forest changes over 10 year period from 2009 to 2019. Figure 1 shows the study area located in Wando, Jeonnam Province. This study area was selected as some of the areas were field surveyed manually several times.
Figure 1. This map shows the study area of Wando located in Chonnam Province
3. MATERIALS and METHODS
There are two general methods for image classification: supervised and unsupervised classification. In supervised classification, the software delineates specific land cover types based on statistical characterization data drawn from known examples in the image which is known as training sites. Supervised classification detects the spectral signatures of known categories and then software assigns each pixel in the image to the cover type to which its signature is most similar [8]. The two frequently used algorithms are the K-mean and the ISODATA algorithm. Both of these algorithms are iterative procedures, assigning first an arbitrary initial cluster vectors. The ROI method is a technique to obtain a function value represented by each vegetation of interest by selecting a plurality of regions of interest in an image and applying a function based on the average time and wavelength curve of the reflection values of ROIs of different vegetation. In order to understand the distribution area and different forest types of warm vegetation, the area of interest(ROI) which selects pixels with same reflectance values in the area choosed pixels identified as evergreen broad-leaved forest, coniferous forest, deciduous broad-leaved forest, mixed forest and others. Table 1 shows 5 types of reclassified forests. The ROI setting of the target area of interest was used to precisely analyze the wavelength values that are different for each vegetation in the satellite image, and to set classification items according to pixels with the same reflection value and to generate training data for them. As ROI is pixel-based analysis only, ISODATA analysis was conducted to classify forest types based on reflected vlaues of wavelength in the pixels. With ISODATA algorithm, ENVI grouped pixels into categories of same signature, and then identified what cover types were represented by those categories. The classifier quantitatively evaluated both the variance and correlation of the category spectral response patterns when classifying an unknown pixel [9, 10].
Table 1. Reclassified forest types from field surveyed data
Field Surveyed forest types Reclassified forest types
∙ Quercus acuta
∙ Machilus thunbergii ∙ Evergreen broad-leaved forests
∙ Pinus thunbergii ∙ Pitch pine
∙ Evergreen coniferous forests ∙ Forests mixed with broad-leaved and
coniferous vegetation ∙ Mixed forests
∙ Quercus serrata ∙ Quercus variabilis ∙ Quercus dentata
∙ Deciduous broad-leaved forests ∙ Orchards, Barren, Agricultural fields,
4. RESULTS AND DISCUSSION
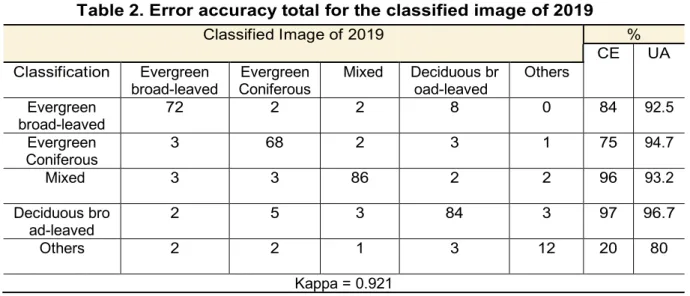
After data were acquired, supervised classification was carried out for this research. The classification was done in several steps involving map masks. Definition of the forest type classes to be mapped in the project was a first step. Using the 1:10,000 scale land-cover map, the satellite images were masked into separate images of vegetation and others(agriculture, roads, and urban). The vegetation image was further divided by using an ISODATA clustering to separate it into the classes of 5 forest types. Each image was clustered using ISODATA and assigned a class using the vegetation map and the Landsat image as a guide. Whether a pixel is considered to be deciduous, or whether a pixel belongs to the coniferous was determined by using the 1:10,000 map as a mask. The 1:10,000 map was considered to coarse for a good division of these classes while the satellite data provided a better separation [11]. Thematic maps were generated after classifying the vegetation types, degraded forests, and roads. Attribute data included forest name, species composition, deforestation degree, and land owners. Avenue was used to develop user interface system which consisted of top-down style menu bar to execute commands. Discriminant analysis was used to build a discriminant function, which consists of a linear combination of spectral features variables that discriminate predefined forest type classes based on reflectance values. For this, Kappa analysis was applied to verify the parameters on the basis of field surveyed data of forest types. The Kappa coefficient is a measure of overall statistical agreement of an error matrix, which takes non-diagonal elements into account. Kappa analysis is recognized as a powerful method for comparing the differences between various error matrices [12]. The Kappa coefficient(ķ) was calculated from the error matrix equation. Kappa indicates to what extent classification accuracy is due to true agreement of the field data and the classification data, and to what extent it could have been achieved by chance. Table 2 represents data of the results of accuracy assessment of satellite images and field survey. It showsOverall accuracy(OA), Kappa statistics(KS). Omission error(OE), Commission error(CE), Producer accuracy(PA) and User accuracy(UA).
Table 2. Error accuracy total for the classified image of 2019
Classified Image of 2019 %
CE UA
Classification Evergreen
broad-leaved Coniferous Evergreen Mixed Deciduous broad-leaved Others
Evergreen broad-leaved 72 2 2 8 0 84 92.5 Evergreen Coniferous 3 68 2 3 1 75 94.7 Mixed 3 3 86 2 2 96 93.2 Deciduous bro ad-leaved 2 5 3 84 3 97 96.7 Others 2 2 1 3 12 20 80 Kappa = 0.921
Considering the categories accuracy, the stratified random method provided very high accuracy assessment in evergreen broad-leaved forests, coniferous forest, and mixed forests, providing high accuracy of 92.5%, 94.7% and 93.2%. This reduction in accuracy is due to the similarity between forest types and surrounding vegetation covers in the mechanized farming. Similar studies displayed different accuracy assessment. This is
because the probability that a reference pixel correctly classified is determined by the producer’s accuracy. The probability that a classified pixel from the map accurately corresponds with the referenced data is determined by the user’s accuracy, while Kappa statistic measures the difference between the true agreement of classified map and chance agreement of random classifier compared to reference data [13]. It is stated that Kappa values of more than 0.80 indicate good classification performance. Kappa values between 0.40 and 0.80 indicate moderate classification performance and Kappa values of less than 0.40 indicate poor classification performance [14]. Based on this judgement, this study has proved high accuracy with Kappa values of 0.921 for the assessment for forest type classsfication with the image of 2019. Figure 2 shows that the ROI selected to include evenly the categories of different forest types such as evergreen broad-leaved forests and coniferous forests.
Figure 2. Map of 15 ROI points in the study area
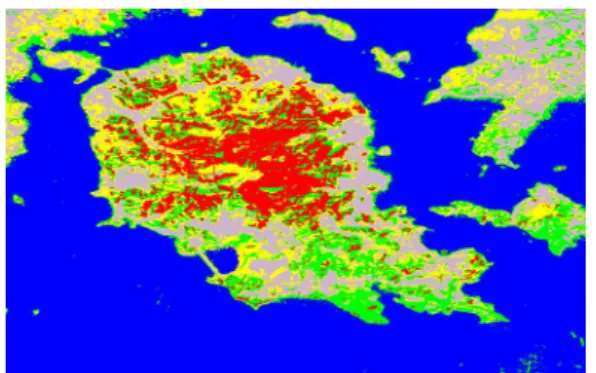
Figure 3 shows the distribution and types of classified forests. Analysis results using 2009 images revealed that the evergreen broad-leaved forests were calculated as 1,817.8ha, while the evergreen coniferous forests were 2,919.9ha, the deciduous broad-leaved forests 3,998.9ha, and the others were calculated as 3,440.6ha.
Figure 3. Classified image of Wando
The areas of different forest types classified with 2019 image were 2,027.2ha for evergreen broad-leaved forests, 2,154.4ha for evergreen coniferous, 2,854.5ha for deciduous broad-leaved forests, and 3,852.3ha for others. Evergreen broad-leaved forests areas were about 1,799ha in 2009 when the forests were field survery by Oh and the difference was about 248ha compared to that of areas in 2019 [15]. This number was a bit more than the areas in 2009, but this number was almost identical because of the difference resulted from mixed forest types which were main components of upper part of forest stands and treated as evergreen broad-leaved forests. As a result of comparing and analyzing the images in 2009 and 2019 in order to understand the trend of changes in warm vegetation, the evergreen broad-leaved forest increased slightly compared to 10 years ago by 209.4ha and the evergreen coniferous forest 143.5ha,
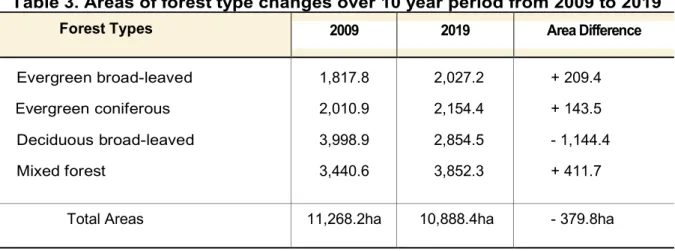
but the deciduous broad-leaved forest was 1,144.4 ha decreased. The total vegetation area decreased by 379.8ha in 2009 compared to that in 2019. It was concluded that evergreen broad-leaved and evergreen coniferous slightly increased over 10 year periods but deciduous broad-leaved decreased in areas. The overall vegetation of the warm temperate vegetation decreased in 2019 compared to 2009, but because of satellite image resolution it was impossible to accurately analyze the distribution area [16]. For example, Pinus thunbergii and Rigida pine forests have similar wavelength characteristics in satellite images, and similarly, deciduous broad-leaved trees such as Quercus glauca and Machilus thunbergii forests also have similar wavelength characteristics [17]. Table 3 shows that coniferous forests increased slightly compared to 10 years ago, but deciduous broad-leaved forests decreased significantly. In the case of mixed forest, two or more species showed different spectral values, but in the pixels of the image, the difference was expressed as the average value of the reflected wavelength [18].
Table 3. Areas of forest type changes over 10 year period from 2009 to 2019
Forest Types 2009 2019 Area Difference
Evergreen broad-leaved Evergreen coniferous Deciduous broad-leaved Mixed forest 1,817.8 2,010.9 3,998.9 3,440.6 2,027.2 2,154.4 2,854.5 3,852.3 + 209.4 + 143.5 - 1,144.4 + 411.7
Total Areas 11,268.2ha 10,888.4ha - 379.8ha
When the image was classified, it was classified as the closest category according to the mixed ratio. In addition, since the spectral characteristics of areas marked as orchards, agricultural lands, and open fields have similar reflected wave values to each other, it was not easy to grasp the differences in different forest types and classify them in detail. Since the satellite images classified and analyzed were grid-shaped raster data with low visual effect and poor spatial resolution, it was converted into vector data appearing in the form of lines to more accurately express it. In order to convert raster data to vector data, the raster data was first converted to DXF format to correct the error data, and then separated into each layer and integrated into the GIS database using ArcGIS Pro.
4.1 Forest Management System
Warm temperate forest management system was developed after forest type classification with satellite images was completed along with thematic maps and attribute data. The management system was completed using macro programming language Avenue and is composed of 4 modules, which allows users to edit the spatial and attribute data and directly display maps on the screen. The system consisted of 4 major modules; display module for generating thematic maps on the screen, analysis module for editing and query, overlay module for overploting different thematic maps, and finally output module for generating outputs in tables, maps, and graphs. Figure 4 shows the attribute data and thematic maps created with forest management system. Users can enter and edit data while generating thematic maps of forest types, degraded and regenerated forests.
Figure 4. Thematic map of forest types with attribute data and table
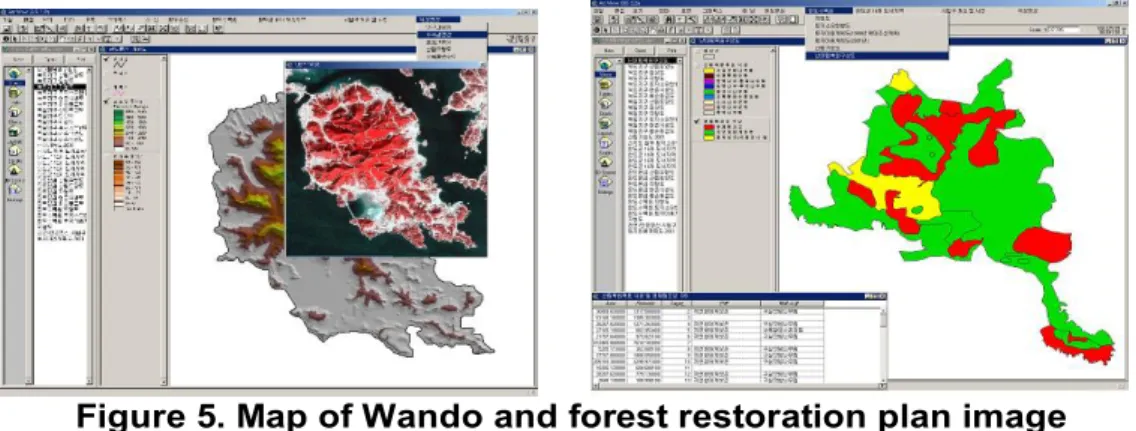
Thematic maps or spatial data such as forest types, land use and covers, land ownership, soils, existing vegetation, degraded forests and restoration plan forest maps can be displayed and querried. Figure 5 shows the type and topographical map of the forest vegetation in the Wando and a thematic map menu that has a menu to query necessary attribute information linked to spatial information.
Figure 5. Map of Wando and forest restoration plan image
Attribute data also included forest types, land ownership, land use, soils, restoration plan, deforested area, and existing forest. Yearly digital photos were also combined into the management system so that the user could display them to understand the progress of restoration plans. Figure 6 shows the existing vegetation and attribute information related to the Bugil island in Wando. The warm temperate forest management system was developed mainly in the Wando Arboretum and adjacent islands due to lack of vegetation data on other areas, but the final goal is to develop a system that manages the entire warm temperate forests and suggests a plan to restore degraded vegetations and forests. With the system, users can directly input and edit attribute data through a map displayed on a computer screen to search for and modify the distribution map by grade, restoration method and restoration site of warm temperate forests.
5. CONCLUSION
Classification of warm temperate forests and development of forest management system with GIS and remote sensing provided efficient and scientific way by saving time and man power to manage and preserve the degraded forests. This research suggested the pilot system to be applied in managing warm temperate forest in Korea. To achieve this objective, Wando was selected as study areas and two different satellite images from 2009 and 2019 were analyzed for forest type change analysis. Forested areas calculated with Landsat ETM in 2009 were 2,027ha. Comparison of satellite data from 2009 and 2019 yielded increase of coniferous forests in 2019, but severe decrease of deciduous broad-leaved forests was detected in 2019, compared to those in 2009. Forest management system consisted of 4 different modules which the user could use to display analyzed results. Using satellite images with ENVI and ArcGIS Pro for forest classification and detection of forest changes over 10 year periods was efficient techniques although resolution of satellite image was not enough to acquire detailed results when mixed forests were growing. From this result, it was suggested that use of better resolution data such as IKONOS is more desirable to pursue forest type classification and change detection research. GIS and remote sensing are important to a broad range of disciplines. These will continue to grow with the greater availability of data promised by an increasing number of space technology and operational systems, providing opportunities for environmental applications, land use mapping and change detection.
REFERENCES
[1] KFS, “Warm-temperate Forests and Preservation,” in Proc. Workshop on Temperate Forests, pp 26-31, Oct. 5. 2005. [2] S, Kim and Jung, Hyungsup, “Classification of Forest Vertical Structure in South Korea from Aerial Orthophoto and
Lidar Data using an Artificial Neural Network,” Appl. Sci., Vol. 7, No 10, pp. 1046, Oct. 2017. DOI: https://doi.org/10.3390/app7101046
[3] M, Thomas and R. Kiefer, “Remote Sensing and Image Interpretation.” 3rdEd. John Wiley, New York, pp. 98. 1994.
[4] R. Jensen, “Introductory Digital Image Processing: Remote Sensing Perspective,” 3rd ed., Pearson Education Inc., Upper Saddle River. pp. 145-146. 2005.
[5] T. Lilesand, and T. M. Kiefer, “Remote Sensing and Image interpretation,” 5thed. USA: John Wiley and Sons Inc. pp.
87. 2004.
[6] A. Singh, “Spectral Separability of Forest Cover Classes,” International Journal of Remote Sensing, Vol. 8, pp 971-979. June. 2007.
DOI:10.1080/01431168708954741
[7] V. Rodriguez-Galiano, B. Ghimire, and J. Rogan, “An assessment of the Effectiveness of a Random Forest Classifier for Land-Cover Classification,” ISPRS Journal of Photogrammetry and Remote Sensing, Vol. 67, pp 93-104, Jan. 2012. DOI: https://doi.org/10.1016/j.isprsjprs.2011.11.002.
[8] P. Thenkabail, Enclona, E. A., and Ashton. M. S. “Hyperion, IKONOS, ALI, and ETM Sensors in the Study of Rainforest.” Remote Sensing of Environment, Vol. 90, No. 1, pp 23-43. March, 2004.
DOI: 10.1016/j.rse.2003.11.018
[9] G. Rosenfield, and K. Fitzpatrick, “A Coefficient of Agreement as a Measure of Thematic Classification Accuracy.” Photogrammetric Engineering & Remote Sensing, Vol. 52, No. 2, pp. 223-227. April, 1986.
DOI: https://doi.org/10.1177/001316446002000104
[10] L Weng, “A Survey Image Classification Methods and Techniques for Improving Classification Performance,” International Journal of Remote Sensing, Vol. 28, No. 5, pp. 823-870. March, 2007.
DOI: http://doi.org/10.1080/ 01431160600746456.
pp.156. 1998.
[12] F. Gomariz-Castillo and F. Alonso-Sarria, “Improving Classification Accuracy of Multi-Temporal and Images by Assessing the Use of Different Algorithms, Textural and Ancillary Information for a Mediterranean Semiarid Area from 2000 to 2015.” Journal Remote Sensing, Vol.9, No. 1058. pp 2-23. July, 2016.
DOI: 10.3390/rs9101058
[13] G. Asner, “Cloud Cover in Landsat Observation of the Brazilian Amazon,” International Journal of Remote Sensing, Vol. 22, Issue 18, pp. 3855-3862. Nov. 2010.
DOI: https://doi.org/10.1080/01431160010006926
[14] G. Foody, “Status of Land Cover Classification Accuracy Assessment,” Remote Sensing of Environment. Vol. 80, No. 1, pp.185-201. April, 2002.
DOI: https://doi.org/10.1016/S0034-4257(01)00295-4
[15] Oh, Kyukoon, “Modeling of Temperate Forest Management,” KEOPS. Vol. 10, No. 1, pp.97-102. 2002. [16] Lee, Soodong, Kim Jiseok, Kim Mijeong, and Kang Hyunkyong, “Plant Community Structure
Characteristic of the Evergreen Forest,” Korean Journal of Environment and Ecology, Vol.30, No.2 pp.228-242. April, 2018. DOI: https://doi.org/10.13047/KJEE.2016.30.2.228
[17] E. Achard and H. Eva., “Tropical Forest Mapping from Coarse Spatial Resolution Data,” International Journal of Remote Sensing, Vo. 22, No 14. pp 2271-2762, Nov, 2010.
DOI : https://doi.org/10.1080/01431160120548
[18] Kim, Jongyoumg, “Cultivating the Seedlings in Greenhouse for Evergreen Broad-leaved Target Species and Artificial Regeneration in Warm-temperate Forests,” Ph, D Thesis. Chonnam Univ. pp. 94-96. 2010.