저작자표시-비영리-변경금지 2.0 대한민국 이용자는 아래의 조건을 따르는 경우에 한하여 자유롭게 l 이 저작물을 복제, 배포, 전송, 전시, 공연 및 방송할 수 있습니다. 다음과 같은 조건을 따라야 합니다: l 귀하는, 이 저작물의 재이용이나 배포의 경우, 이 저작물에 적용된 이용허락조건 을 명확하게 나타내어야 합니다. l 저작권자로부터 별도의 허가를 받으면 이러한 조건들은 적용되지 않습니다. 저작권법에 따른 이용자의 권리는 위의 내용에 의하여 영향을 받지 않습니다. 이것은 이용허락규약(Legal Code)을 이해하기 쉽게 요약한 것입니다. Disclaimer 저작자표시. 귀하는 원저작자를 표시하여야 합니다. 비영리. 귀하는 이 저작물을 영리 목적으로 이용할 수 없습니다. 변경금지. 귀하는 이 저작물을 개작, 변형 또는 가공할 수 없습니다.
Doctoral Thesis in
Failure of monotherapy in patients
with type 2 diabetes: The Korean
National Diabetes Program
Ajou University Graduate School
Department of Medical Sciences
Major in Medicine
Ja Young Jeon
Failure of monotherapy in patients
with type 2 diabetes: The Korean
National Diabetes Program
Kwan-Woo Lee, Advisor
I submit this thesis as the Doctoral thesis in Medicine.
February, 2019
Ajou University Graduate School
Department of Medical Sciences
Major in Medicine
Ja Young Jeon
The Doctoral thesis of Ja Young Jeon in Medicine is hereby
approved.
Thesis Defense Committee President
전 기 홍 Seal
Member 이 관 우 Seal
Member 김 대 중 Seal
Member 김 혜 진 Seal
Member 조 용 욱 Seal
Ajou University Graduate School
I
- ABSTRACT -
Failure of monotherapy in patients with type 2 diabetes: The Korean National Diabetes Program
Aims: We investigated the failure of monotherapy in patients with type 2 DM in real practice settings.
Methods: The Korea National Diabetes Program was a prospective, multicenter observational cohort study of type 2 DM patients in Korea. Of the 3,950 patients enrolled in the study, we studied 998 who were continuously maintained on monotherapy for at least 90 days at six participating centers. To balance the baseline characteristics of patients in each group, we employed propensity-matching at a 1:1 ratio (metformin vs. sulfonylureas) and 4:1 ratios (metformin vs. meglitinides and metformin vs. alpha-glucosidase inhibitors [aGIs]). The hazard ratios of treatments (compared with metformin) were determined via Cox’s proportional hazards regression modeling.
Results: The median follow-up time was 56 months and monotherapy failed in 45% of all patients. The annual incidences of failure were 15.6%, 21.3%, 27%, and 9.6% in the metformin, sulfonylurea, meglitinide, and aGI groups. Compared with metformin, sulfonylureas and meglitinides were associated with higher risks of monotherapy failure (HR 1.39, CI 1.08–1.80; HR 1.92, CI 1.13–3.27) and aGIs with risk similar to that of metformin (HR 0.80, CI 0.44–1.45). When analyzed by failure type, sulfonylureas, meglitinides and aGIs were associated with a higher risk of a switch to other agents (HR 4.43, CI 2.14–9.17; HR 18.80, CI 6.21–56.93; HR 4.25 CI 1.49–12.13) and aGIs with a lower risk of prescription of add-on second agents (HR 0.16, CI 0.04–0.64).
Conclusions: Metformin was associated with a lower failure risk than were sulfonylureas and meglitinides, but a comparable aGI failure rate.
II
III
Table of Contents
Abstract ‧‧‧‧‧‧‧‧‧‧‧‧‧‧‧‧‧‧‧‧‧‧‧‧‧‧‧‧‧‧‧‧‧‧‧‧‧‧‧‧‧‧‧‧‧‧‧‧‧‧‧‧‧‧‧‧‧‧‧‧‧‧‧‧‧‧‧‧‧‧‧‧‧‧‧‧‧‧‧‧‧‧‧‧‧‧‧‧‧‧‧‧‧‧‧‧‧‧‧‧‧‧‧‧‧‧‧‧‧‧‧‧‧ I Table of Contents ‧‧‧‧‧‧‧‧‧‧‧‧‧‧‧‧‧‧‧‧‧‧‧‧‧‧‧‧‧‧‧‧‧‧‧‧‧‧‧‧‧‧‧‧‧‧‧‧‧‧‧‧‧‧‧‧‧‧‧‧‧‧‧‧‧‧‧‧‧‧‧‧‧‧‧‧‧‧‧‧‧‧‧‧‧‧‧‧‧‧‧‧‧‧‧ III List of Figures ‧‧‧‧‧‧‧‧‧‧‧‧‧‧‧‧‧‧‧‧‧‧‧‧‧‧‧‧‧‧‧‧‧‧‧‧‧‧‧‧‧‧‧‧‧‧‧‧‧‧‧‧‧‧‧‧‧‧‧‧‧‧‧‧‧‧‧‧‧‧‧‧‧‧‧‧‧‧‧‧‧‧‧‧‧‧‧‧‧‧‧‧‧‧‧‧‧‧‧‧ IV List of Tables ‧‧‧‧‧‧‧‧‧‧‧‧‧‧‧‧‧‧‧‧‧‧‧‧‧‧‧‧‧‧‧‧‧‧‧‧‧‧‧‧‧‧‧‧‧‧‧‧‧‧‧‧‧‧‧‧‧‧‧‧‧‧‧‧‧‧‧‧‧‧‧‧‧‧‧‧‧‧‧‧‧‧‧‧‧‧‧‧‧‧‧‧‧‧‧‧‧‧‧‧‧‧‧ V
I. Introduction ‧‧‧‧‧‧‧‧‧‧‧‧‧‧‧‧‧‧‧‧‧‧‧‧‧‧‧‧‧‧‧‧‧‧‧‧‧‧‧‧‧‧‧‧‧‧‧‧‧‧‧‧‧‧‧‧‧‧‧‧‧‧‧‧‧‧‧‧‧‧‧‧‧‧‧‧‧‧‧‧‧‧‧‧‧‧‧‧‧‧‧‧‧‧‧‧‧‧‧‧‧‧ 1
II. Methods ‧‧‧‧‧‧‧‧‧‧‧‧‧‧‧‧‧‧‧‧‧‧‧‧‧‧‧‧‧‧‧‧‧‧‧‧‧‧‧‧‧‧‧‧‧‧‧‧‧‧‧‧‧‧‧‧‧‧‧‧‧‧‧‧‧‧‧‧‧‧‧‧‧‧‧‧‧‧‧‧‧‧‧‧‧‧‧‧‧‧‧‧‧‧‧‧‧‧‧‧‧‧‧‧‧‧‧‧ 3 A. Ethics statement ‧‧‧‧‧‧‧‧‧‧‧‧‧‧‧‧‧‧‧‧‧‧‧‧‧‧‧‧‧‧‧‧‧‧‧‧‧‧‧‧‧‧‧‧‧‧‧‧‧‧‧‧‧‧‧‧‧‧‧‧‧‧‧‧‧‧‧‧‧‧‧‧‧‧‧‧‧‧‧‧‧‧‧‧‧‧‧‧ 3 B. Study design and participants ‧‧‧‧‧‧‧‧‧‧‧‧‧‧‧‧‧‧‧‧‧‧‧‧‧‧‧‧‧‧‧‧‧‧‧‧‧‧‧‧‧‧‧‧‧‧‧‧‧‧‧‧‧‧‧‧‧‧‧‧‧‧‧‧‧ 3 C. Baseline variables ‧‧‧‧‧‧‧‧‧‧‧‧‧‧‧‧‧‧‧‧‧‧‧‧‧‧‧‧‧‧‧‧‧‧‧‧‧‧‧‧‧‧‧‧‧‧‧‧‧‧‧‧‧‧‧‧‧‧‧‧‧‧‧‧‧‧‧‧‧‧‧‧‧‧‧‧‧‧‧‧‧‧‧‧‧ 4 D. Primary endpoint ‧‧‧‧‧‧‧‧‧‧‧‧‧‧‧‧‧‧‧‧‧‧‧‧‧‧‧‧‧‧‧‧‧‧‧‧‧‧‧‧‧‧‧‧‧‧‧‧‧‧‧‧‧‧‧‧‧‧‧‧‧‧‧‧‧‧‧‧‧‧‧‧‧‧‧‧‧‧‧‧‧‧‧‧‧ 4 E. Statistical analyses ‧‧‧‧‧‧‧‧‧‧‧‧‧‧‧‧‧‧‧‧‧‧‧‧‧‧‧‧‧‧‧‧‧‧‧‧‧‧‧‧‧‧‧‧‧‧‧‧‧‧‧‧‧‧‧‧‧‧‧‧‧‧‧‧‧‧‧‧‧‧‧‧‧‧‧‧‧‧‧‧‧‧‧‧ 4
III. Results ‧‧‧‧‧‧‧‧‧‧‧‧‧‧‧‧‧‧‧‧‧‧‧‧‧‧‧‧‧‧‧‧‧‧‧‧‧‧‧‧‧‧‧‧‧‧‧‧‧‧‧‧‧‧‧‧‧‧‧‧‧‧‧‧‧‧‧‧‧‧‧‧‧‧‧‧‧‧‧‧‧‧‧‧‧‧‧‧‧‧‧‧‧‧‧‧‧‧‧‧‧‧‧‧‧‧‧‧‧ 6 A. Baseline patient characteristics ‧‧‧‧‧‧‧‧‧‧‧‧‧‧‧‧‧‧‧‧‧‧‧‧‧‧‧‧‧‧‧‧‧‧‧‧‧‧‧‧‧‧‧‧‧‧‧‧‧‧‧‧‧‧‧‧‧‧‧‧‧‧‧ 6 B. Monotherapy failure in each treatment group ‧‧‧‧‧‧‧‧‧‧‧‧‧‧‧‧‧‧‧‧‧‧‧‧‧‧‧‧‧‧‧‧‧‧‧‧ 20
IV. Discussion ‧‧‧‧‧‧‧‧‧‧‧‧‧‧‧‧‧‧‧‧‧‧‧‧‧‧‧‧‧‧‧‧‧‧‧‧‧‧‧‧‧‧‧‧‧‧‧‧‧‧‧‧‧‧‧‧‧‧‧‧‧‧‧‧‧‧‧‧‧‧‧‧‧‧‧‧‧‧‧‧‧‧‧‧‧‧‧‧‧‧‧‧‧‧‧‧‧‧‧‧‧ 27
V. Conclusion ‧‧‧‧‧‧‧‧‧‧‧‧‧‧‧‧‧‧‧‧‧‧‧‧‧‧‧‧‧‧‧‧‧‧‧‧‧‧‧‧‧‧‧‧‧‧‧‧‧‧‧‧‧‧‧‧‧‧‧‧‧‧‧‧‧‧‧‧‧‧‧‧‧‧‧‧‧‧‧‧‧‧‧‧‧‧‧‧‧‧‧‧‧‧‧‧‧‧‧‧‧‧ 32
References ‧‧‧‧‧‧‧‧‧‧‧‧‧‧‧‧‧‧‧‧‧‧‧‧‧‧‧‧‧‧‧‧‧‧‧‧‧‧‧‧‧‧‧‧‧‧‧‧‧‧‧‧‧‧‧‧‧‧‧‧‧‧‧‧‧‧‧‧‧‧‧‧‧‧‧‧‧‧‧‧‧‧‧‧‧‧‧‧‧‧‧‧‧‧‧‧‧‧‧‧‧‧‧‧‧‧‧ 33
IV
List of Figures
Figure 1. Mean HbA1c levels during follow-up period in total population ‧‧‧‧‧‧‧‧‧‧‧‧‧‧‧‧‧‧‧‧‧‧‧‧‧‧‧‧‧‧‧‧‧‧‧‧‧‧‧‧‧‧‧‧‧‧‧‧‧‧‧‧‧‧‧‧‧‧‧‧‧‧‧‧‧‧‧‧‧‧‧‧‧‧‧‧‧‧‧‧‧‧‧‧‧‧‧‧‧‧‧‧‧‧‧‧‧‧‧‧‧‧‧‧‧‧‧‧‧‧ 12
Figure 2. Mean HbA1c levels in patients taking metformin and
sulfonylureas after propensity-score matching during follow-up period ‧‧‧‧‧‧‧‧‧‧‧‧‧‧‧‧‧‧‧‧‧‧‧‧‧‧‧‧‧‧‧‧‧‧‧‧‧‧‧‧‧‧‧‧‧‧‧‧‧‧‧‧‧‧‧‧‧‧‧‧‧‧‧‧‧‧‧‧‧‧‧‧‧‧‧‧‧‧‧‧‧‧‧‧‧‧‧‧‧‧‧‧‧‧‧‧‧‧ 14
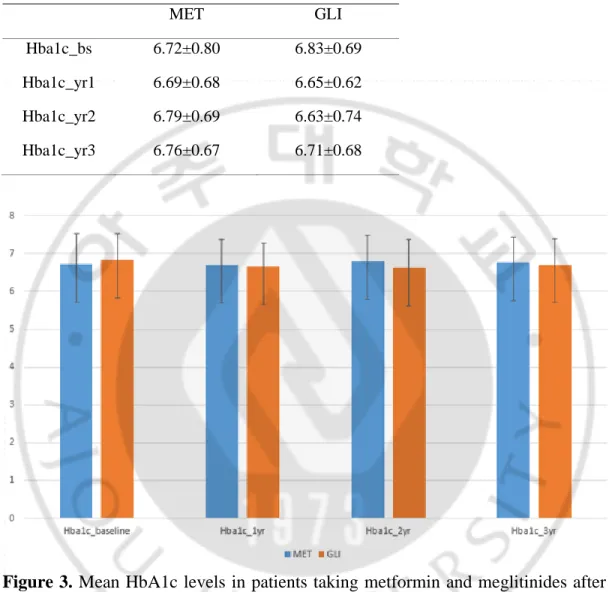
Figure 3. Mean HbA1c levels in patients taking metformin and meglitinides after propensity-score matching during follow-up period ‧‧‧‧‧‧‧‧‧‧‧‧ 15
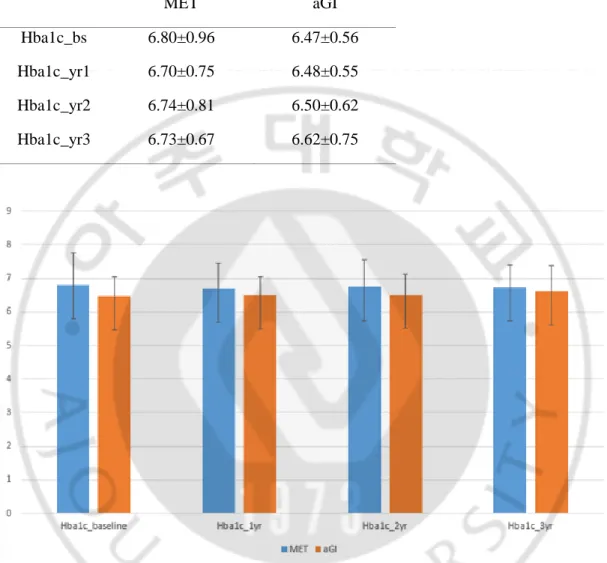
Figure 4. Mean HbA1c levels in patients taking metformin and alph-glucosidase inhibitors after propensity-score matching during follow-up period ‧‧‧‧‧‧‧‧‧‧‧‧‧‧‧‧‧‧‧‧‧‧‧‧‧‧‧‧‧‧‧‧‧‧‧‧‧‧‧‧‧‧‧‧‧‧‧‧‧‧‧‧‧‧‧‧‧‧‧‧‧‧‧‧‧‧‧‧‧‧‧‧‧‧‧‧‧‧‧‧ 16
Figure 5. Kaplan-Meier curve of monotherapy failure after propensity-score matching (metformin vs. sulfonylureas) ‧‧‧‧‧‧‧‧‧‧‧‧‧‧‧‧‧‧‧‧‧‧‧‧‧‧‧‧‧‧‧‧ 21
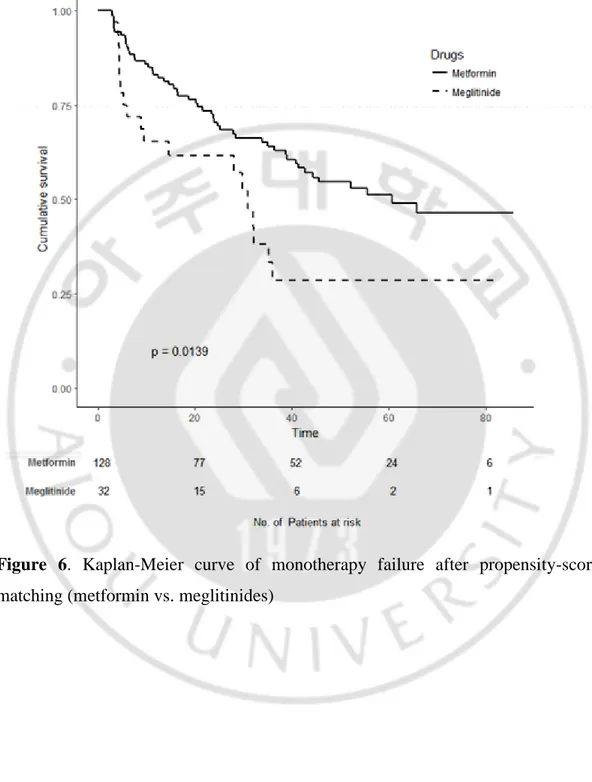
Figure 6. Kaplan-Meier curve of monotherapy failure after propensity-score matching (metformin vs. meglitinides). ‧‧‧‧‧‧‧‧‧‧‧‧‧‧‧‧‧‧‧‧‧‧‧‧‧‧‧‧‧‧‧‧‧ 22
Figure 7. Kaplan-Meier curve of monotherapy failure after propensity-score matching (metformin vs. alpha-glucosidase inhibitors). ‧‧‧‧‧‧ 23
V
List of Tables
Table 1. Demographic data and baseline characteristics of all study
patients ‧‧‧‧‧‧‧‧‧‧‧‧‧‧‧‧‧‧‧‧‧‧‧‧‧‧‧‧‧‧‧‧‧‧‧‧‧‧‧‧‧‧‧‧‧‧‧‧‧‧‧‧‧‧‧‧‧‧‧‧‧‧‧‧‧‧‧‧‧‧‧‧‧‧‧‧‧‧‧‧‧‧‧‧‧‧‧‧‧‧‧‧‧‧‧‧‧ 7
Table 2. Demographic data and baseline characteristics of all study
patients by monotherapy groups ‧‧‧‧‧‧‧‧‧‧‧‧‧‧‧‧‧‧‧‧‧‧‧‧‧‧‧‧‧‧‧‧‧‧‧‧‧‧‧‧‧‧‧‧‧‧‧‧‧‧‧‧‧‧‧ 9
Table 3. Mean HbA1c levels in total population during follow-up period ‧‧‧‧‧‧‧‧‧‧‧‧‧‧‧‧‧‧‧‧‧‧‧‧‧‧‧‧‧‧‧‧‧‧‧‧‧‧‧‧‧‧‧‧‧‧‧‧‧‧‧‧‧‧‧‧‧‧‧‧‧‧‧‧‧‧‧‧‧‧‧‧‧‧‧‧‧‧‧‧‧‧‧‧‧‧‧‧‧‧‧‧‧‧‧‧‧‧‧‧‧‧‧‧‧‧‧‧‧‧ 12
Table 4. Mean HbA1c levels in patients taking metformin and
sulfonylureas after propensity-score matching during follow-up period ‧‧‧‧‧‧‧‧‧‧‧‧‧‧‧‧‧‧‧‧‧‧‧‧‧‧‧‧‧‧‧‧‧‧‧‧‧‧‧‧‧‧‧‧‧‧‧‧‧‧‧‧‧‧‧‧‧‧‧‧‧‧‧‧‧‧‧‧‧‧‧‧‧‧‧‧‧‧‧‧‧‧‧‧‧‧‧‧‧‧‧‧‧‧‧‧‧‧ 14
Table 5. Mean HbA1c levels in patients taking metformin and meglitinides after propensity-score matching during follow-up period ‧‧‧‧‧‧‧‧‧‧‧‧ 15
Table 6. Mean HbA1c levels in patients taking metformin and alpha-glucosidase inhibitors after propensity-score matching during follow-up period ‧‧‧‧‧‧‧‧‧‧‧‧‧‧‧‧‧‧‧‧‧‧‧‧‧‧‧‧‧‧‧‧‧‧‧‧‧‧‧‧‧‧‧‧‧‧‧‧‧‧‧‧‧‧‧‧‧‧‧‧‧‧‧‧‧‧‧‧‧‧‧‧‧‧‧‧‧‧‧‧ 16
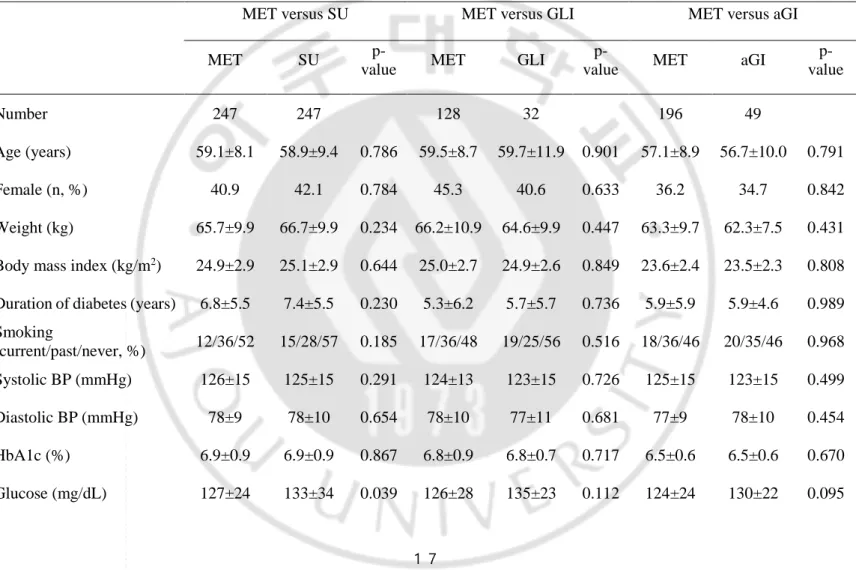
Table 7. Demographic data and baseline characteristics of all patients after propensity-score matching ‧‧‧‧‧‧‧‧‧‧‧‧‧‧‧‧‧‧‧‧‧‧‧‧‧‧‧‧‧‧‧‧‧‧‧‧‧‧‧‧‧‧‧‧‧‧‧‧‧‧‧‧‧‧‧‧‧‧‧‧‧‧‧ 17
Table 8. Subtype failure of Monotherapy failure after propensity-score matching ‧‧‧‧‧‧‧‧‧‧‧‧‧‧‧‧‧‧‧‧‧‧‧‧‧‧‧‧‧‧‧‧‧‧‧‧‧‧‧‧‧‧‧‧‧‧‧‧‧‧‧‧‧‧‧‧‧‧‧‧‧‧‧‧‧‧‧‧‧‧‧‧‧‧‧‧‧‧‧‧‧‧‧‧‧‧‧‧‧‧‧‧‧ 25
VI
1
I. Introduction
The fundamental goal of type 2 diabetes mellitus (DM) treatment is to attain and maintain near-normal glucose levels to prevent the development of various diabetic complications. Current clinical guidelines recommend that the glycemic target in most patients be an HbA1c < 7% 1. Currently, metformin is the preferred initial treatment, in combination with lifestyle management in
combination with lifestyle management 2. However, some patients are intolerant of and/or are not candidates for metformin therapy; other anti-diabetic drugs must thus be considered for them. Recently, individualized therapy has become popular, based on individual patient characteristics.Therefore, it is essential to compare the performances of various anti-hyperglycemic agents. It is important to define treatment durabilities; DM exhibits a chronic, progressive natural course during which blood glucose concentrations rise gradually over time 3,4. Both features present early in the natural course of disease 6. However, some differences in the pathophysiological contributions to DM development or course may exist among various populations or ethnic groups 7-12. In particular, East Asians have limited
β-cell function and are thus susceptible to type 2 DM 7, 8, 10, 11.
Although the pathophysiology of type 2 DM is complex, declines in insulin secretion and peripheral insulin resistance are the principal problems 5. In patients
who have been recently diagnosed or in whom the disease is of short duration, anti-hyperglycemic agents differing in terms of their mechanisms of action may show different treatment responses in various populations.
The UKPDS trial enrolling patients newly diagnosed with type 2 DM found that monotherapy failure increased over time 3. Additional therapy was required by approximately 50% of patients by 3 years and 75% by 9 years. The representative Diabetes Outcome Progression Trial (ADOPT) explored the durabilities of three monotherapies 13; rosiglitazone (thiazolidinedione) was the most durable therapy and
2
metformin (a biguanide) therapy was more durable than that with glyburide (a sulfonylurea). However, little data on monotherapy durabilities are available. Furthermore, data from Asian populations, and those obtained in real clinical practice, are very limited.
Therefore, we investigated monotherapy failure rates (including that of metformin) during a multicenter, observational cohort study performed in South Korea; we used propensity-score matching to compare durabilities.
3
II. Methods
A. Ethics statement
Our study protocol was approved by the institutional review boards of all participating hospitals and conformed to the ethical guidelines of the Declaration of Helsinki. All participants gave written informed consent.
B. Study design and participants
The Korea National Diabetes Program (KNDP) cohort study has been described previously 14. In brief, the KNDP was a prospective, multicenter, observational cohort study enrolling patients with type 2 DM and those at risk of DM in South Korea. All patients were enrolled between May 2006 and December 2012 and followed up to December 2013. The type 2 DM cohort included patients ≥ 20 years of age who satisfied the 2004 diagnostic criteria of the American Diabetes Association. Of the 3,950 patients enrolled in the KNDP, the present study population consisted of 998 patients receiving continuous oral hypoglycemic agent monotherapy for at least 90 days in six KNDP centers. The index date was that of monotherapy commencement. The monotherapies were restricted to metformin, sulfonylureas, meglitinides and alpha-glucosidase inhibitors (aGIs). Patients prescribed thiazolidinedione or dipeptidyl peptidase-4 inhibitor monotherapies were excluded; their numbers were too small. Patients prescribed metformin, sulfonylureas, aGIs, and meglitinides numbered 666, 249, 49, and 34, respectively. The sulfonylureas were glimepiride and gliclazide (58% and 42%); the aGIs were voglibose and acarbose (65% and 35%); and the meglitinides were nateglinide, repaglinide, and mitiglinide (68%, 24%, and 9%). We used propensity-score matching to balance baseline characteristics (age, gender, body mass index, DM duration, glycated hemoglobin [HbA1c] level, and estimated glomerular filtration rate [eGFR]) among groups at a 1:1 ratio (metformin vs. sulfonylureas) and 4:1 ratios (metformin vs. meglitinides and metformin vs. aGIs).
4
C. Baseline variables
The baseline variables were based on the last values of the index dates. We recorded age, DM duration, body mass index, smoking status, systolic/diastolic blood pressure, diabetic complications, and comorbidities. After 12-h overnight fasts, the HbA1c, plasma glucose, serum creatinine, lipid, and insulin levels were measured at baseline and at every 3- or 6-month visits. Diabetic retinopathy was diagnosed by ophthalmologists, or via a history of photocoagulation or vitrectomy. Subjects with hypertension, as diagnosed by a physician or those taking anti-hypertensive medications, were classified as patients with hypertension. Similarly, dyslipidemia was defined as cases of having a history of dyslipidemia or taking lipid-lowering medications. Cardiovascular disease included any history of myocardial infarction, angina, heart failure, or an intervention triggered by coronary artery obstructive disease. Cerebrovascular disease included any history of ischemic or hemorrhagic stroke, or a transient ischemic attack. The eGFR was calculated using the Chronic Kidney Disease Epidemiology Collaboration equation 15. The homeostatic indices of insulin resistance IR) and β-cell function (HOMA-β) were also calculated 16. The medication possession ratio (MPR) was the
percentage of sum of days supply divided by the number of days in the evaluation period. An MPR >100% was scored as 100%.
D. Primary endpoint
The primary outcome was the time to monotherapy failure, defined as an HbA1c level ≥ 7.5%, a switch to another anti-DM agent, or add-on of another agent.
E. Statistical analyses
Continuous variables are presented as means ± standard deviations (SDs); Student’s t-test was used for comparisons. Categorical variables are presented
5
as numbers with percentages; the chi-squared (χ2) or Fisher’s exact test was used to
compare the two groups. Monotherapy failure rates were calculated as the ratios of incident case numbers to the person-years of the entire study population. To minimize bias, group baseline characteristics were balanced via propensity-scorematching using a 1:1 ratio for metformin to sulfonylureas, and 4:1 ratios of metformin to both aGIs and meglitinides, prior to survival analysis. We matched age, sex, body mass index, DM duration, HbA1c level, and eGFR. We next ensured that that the covariates were balanced using the chi-squared or Fisher’s exact test for categorical variables and Student’s t-test for continuous variables. Monotherapy failure curves were plotted employing the Kaplan-Meier method and compared using the log-rank test. We performed Cox’s proportional hazard regression (after propensity-score matching) to derive hazard ratios for monotherapy failure. A two-sided p-value < 0.05 was considered to reflect statistical significance. All data were analyzed using SPSS (version 23.0; SPSS Inc., Chicago, IL, USA) and R (R version 3.3.2; R Foundation for Statistical Computing; Vienna, Austria; http://www.R-project.org/) software packages.
6
Ⅲ. Results
A. Baseline patient characteristics
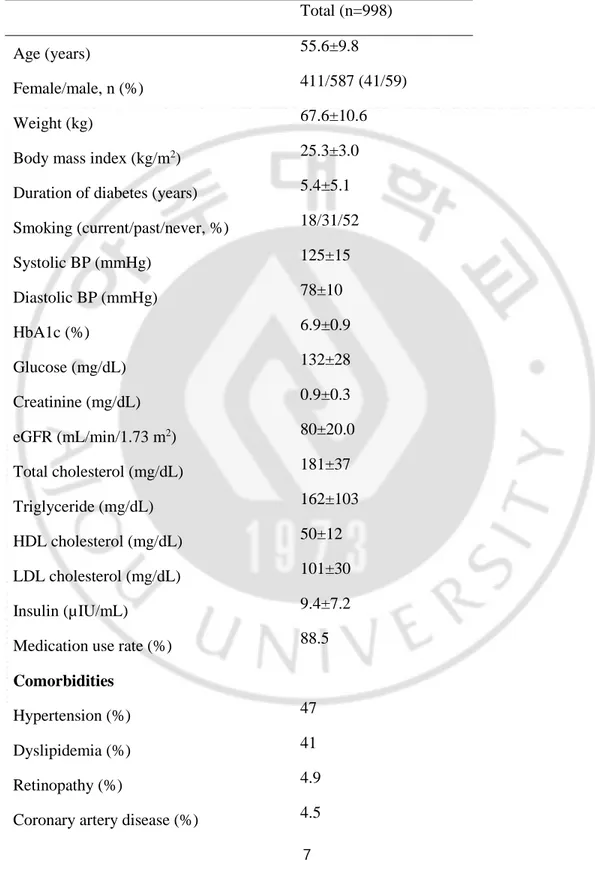
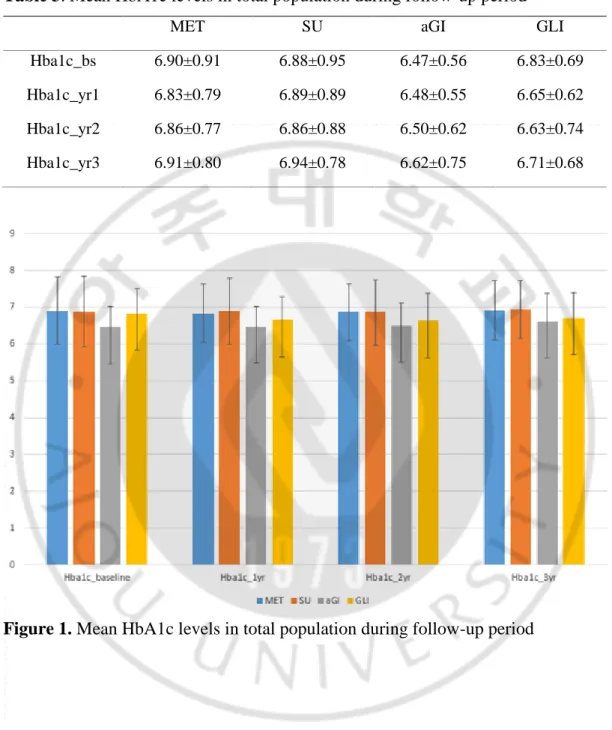
The median (interquartile range [IQR]) follow-up duration was 56.1 (34.4– 70.2) months for all patients, of whom approximately 45% (454/998) exhibited monotherapy failure (17% per year; Table 1 and Table 2). The annual monotherapy failure rates were 15.6%, 21.3%, 27%, and 9.6% for metformin, sulfonylureas, meglitinides, and aGIs, respectively (HR 1.35 [95% CI, 1.10–1.66], HR 1.64 [95% CI, 1.04–2.58], and HR 0.61 [0.35–1.06] when sulfonylureas, meglitinides, and aGIs were compared with metformin, respectively). The mean (SD) age and DM duration were 55.6 (9.8) years and 5.4 (5.1) years, respectively. The mean baseline HbA1c level was 6.9% (0.9) and the MPR 88.5%. Figure 1 and table 3 showed mean HbA1c levels during follow-up period. About 5% of all patients had histories of diabetic retinopathy and 4.5% and 5.7% had previously been diagnosed with coronary artery disease and cerebrovascular disease, respectively.
7
Table 1. Demographic data and baseline characteristics of all study patients.
Total (n=998)
Age (years) 55.6±9.8
Female/male, n (%) 411/587 (41/59)
Weight (kg) 67.6±10.6
Body mass index (kg/m2) 25.3±3.0
Duration of diabetes (years) 5.4±5.1
Smoking (current/past/never, %) 18/31/52 Systolic BP (mmHg) 125±15 Diastolic BP (mmHg) 78±10 HbA1c (%) 6.9±0.9 Glucose (mg/dL) 132±28 Creatinine (mg/dL) 0.9±0.3 eGFR (mL/min/1.73 m2) 80±20.0 Total cholesterol (mg/dL) 181±37 Triglyceride (mg/dL) 162±103 HDL cholesterol (mg/dL) 50±12 LDL cholesterol (mg/dL) 101±30 Insulin (µIU/mL) 9.4±7.2
Medication use rate (%) 88.5
Comorbidities
Hypertension (%) 47
Dyslipidemia (%) 41
Retinopathy (%) 4.9
8
Cerebrovascular disease (%) 5.7
Total failure (%, 100 person-years) 45.4/17.0
9
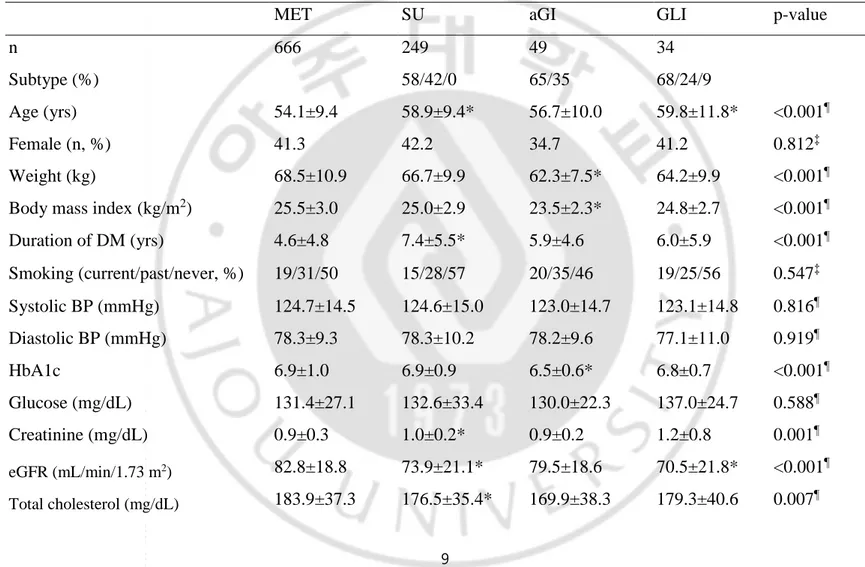
Table 2. Demographic data and baseline characteristics of all study patients by monotherapy groups.
MET SU aGI GLI p-value
n 666 249 49 34
Subtype (%) 58/42/0 65/35 68/24/9
Age (yrs) 54.1±9.4 58.9±9.4* 56.7±10.0 59.8±11.8* <0.001¶
Female (n, %) 41.3 42.2 34.7 41.2 0.812‡
Weight (kg) 68.5±10.9 66.7±9.9 62.3±7.5* 64.2±9.9 <0.001¶
Body mass index (kg/m2) 25.5±3.0 25.0±2.9 23.5±2.3* 24.8±2.7 <0.001¶
Duration of DM (yrs) 4.6±4.8 7.4±5.5* 5.9±4.6 6.0±5.9 <0.001¶ Smoking (current/past/never, %) 19/31/50 15/28/57 20/35/46 19/25/56 0.547‡ Systolic BP (mmHg) 124.7±14.5 124.6±15.0 123.0±14.7 123.1±14.8 0.816¶ Diastolic BP (mmHg) 78.3±9.3 78.3±10.2 78.2±9.6 77.1±11.0 0.919¶ HbA1c 6.9±1.0 6.9±0.9 6.5±0.6* 6.8±0.7 <0.001¶ Glucose (mg/dL) 131.4±27.1 132.6±33.4 130.0±22.3 137.0±24.7 0.588¶ Creatinine (mg/dL) 0.9±0.3 1.0±0.2* 0.9±0.2 1.2±0.8 0.001¶ eGFR (mL/min/1.73 m2) 82.8±18.8 73.9±21.1* 79.5±18.6 70.5±21.8* <0.001¶ Total cholesterol (mg/dL) 183.9±37.3 176.5±35.4* 169.9±38.3 179.3±40.6 0.007¶
10 Triglyceride (mg/dL) 163.2±106.2 161.2±84.9 139.2±125.1 190.6±121.6 0.165¶ HDL cholesterol (mg/dL) 49.1±11.1 52.6±12.4* 55.3±13.5* 48.0±12.6 <0.001¶ LDL cholesterol (mg/dL) 101.9±30.7 98.9±28.4 91.9±29.4 105.3±26.6 0.077¶ Insulin (uIU/ml) 9.8±7.8 8.9±5.0 8.6±8.5 8.2±5.0 0.266¶ HOMA-IR 3.2±2.7 2.9±1.8 2.8±2.5 3.0±2.0 0.499¶ HOMA-B 59.1±55.1 56.0±41.7 53.2±73.6 45.0±25.0 0.481¶
Medication use rate (%) 88.0±17.8 93.7±16.4* 86.9±20.4 94.9±13.2* <0.001¶
Complications Retinopathy (%) 3.2 8.4 4.1 14.7 0.001† Nephropathy (%) 0.2 1.6 2.0 2.9 0.008† Comorbidities Hypertension (n, %) 44.6 54.6 40.8 52.9 0.036‡ Dyslipidemia (%) 40.5 44.6 40.8 23.5 0.129‡
Coronary artery disease (%) 3.8 7.2 4.1 0.0 0.098†
Cerebrovascular disease (%) 4.7 8.8 2.0 8.8 0.048†
Values are presented as means ± standard deviations or as numbers (with %). Subtype means; SUs are composed of glimepiride, gliclazide, and glipizide (%), aGIs are composed of voglibose and acarbose (%), and GLIs are composed of
11
nateglinide, repaglinide, and mitiglinide (%).¶, ‡, and † performed ANOVA test, Chi-squared test, and Fisher’s exact test, respectively. * p<0.05 vs. MET.
MET, metformin; SU, sulfonylurea; aGI, alpha-glucosidase inhibitor; GLI, meglitinide; eGFR, estimated glomerular filtration rate; HOMA-IR, homeostasis model assessment of insulin resistance; HOMA-B, homeostasis model assessment of β-cell function.
12
Table 3. Mean HbA1c levels in total population during follow-up period
MET SU aGI GLI
Hba1c_bs 6.90±0.91 6.88±0.95 6.47±0.56 6.83±0.69
Hba1c_yr1 6.83±0.79 6.89±0.89 6.48±0.55 6.65±0.62
Hba1c_yr2 6.86±0.77 6.86±0.88 6.50±0.62 6.63±0.74
Hba1c_yr3 6.91±0.80 6.94±0.78 6.62±0.75 6.71±0.68
13
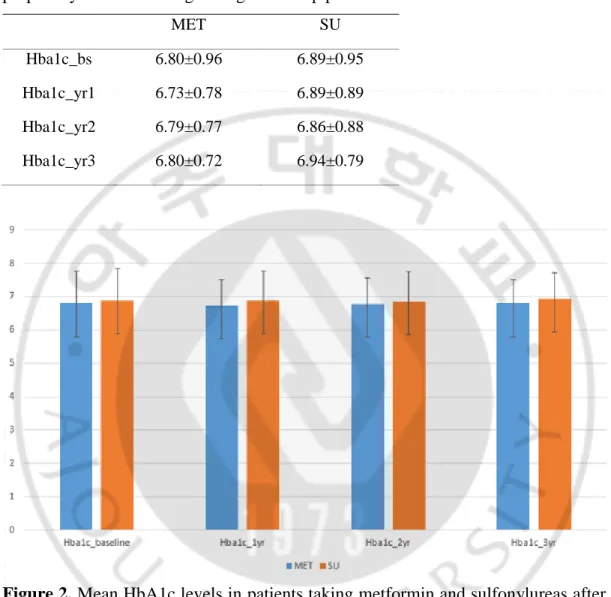
After 1:1 propensity-score matching of patients taking metformin and sulfonylureas (247:247); and 4:1 matching of those taking metformin and meglitinides (128:32) and metformin and aGIs (196:49), most baseline characteristics were balanced (Table 3), although the sulfonylurea group had higher fasting glucose and HDL levels; and the meglitinide group had a higher MPR, a lower HOMA-B score, and fewer diagnoses of dyslipidemia; aGI groups had lower total cholesterol and higher HDL levels, compared with the metformin group. Figure 2, 3, and 4 (Table 4, 5, and 6) showed mean HbA1c levels between propensity-score matching groups during follow-up period.
14
Table 4. Mean HbA1c levels in patients taking metformin and sulfonylureas after propensity-score matching during follow-up period
MET SU
Hba1c_bs 6.80±0.96 6.89±0.95
Hba1c_yr1 6.73±0.78 6.89±0.89
Hba1c_yr2 6.79±0.77 6.86±0.88
Hba1c_yr3 6.80±0.72 6.94±0.79
Figure 2. Mean HbA1c levels in patients taking metformin and sulfonylureas after propensity-score matching during follow-up period
15
Table 5. Mean HbA1c levels in patients taking metformin and meglitinides after propensity-score matching during follow-up period
MET GLI
Hba1c_bs 6.72±0.80 6.83±0.69
Hba1c_yr1 6.69±0.68 6.65±0.62
Hba1c_yr2 6.79±0.69 6.63±0.74
Hba1c_yr3 6.76±0.67 6.71±0.68
Figure 3. Mean HbA1c levels in patients taking metformin and meglitinides after propensity-score matching during follow-up period
16
Table 6. Mean HbA1c levels in patients taking metformin and alpha-glucosidase inhibitors after propensity-score matching during follow-up period
MET aGI
Hba1c_bs 6.80±0.96 6.47±0.56
Hba1c_yr1 6.70±0.75 6.48±0.55
Hba1c_yr2 6.74±0.81 6.50±0.62
Hba1c_yr3 6.73±0.67 6.62±0.75
Figure 4. Mean HbA1c levels in patients taking metformin and alpha-glucosidase inhibitors after propensity-score matching during follow-up period
17
Table 7. Demographic data and baseline characteristics of all patients after propensity-score matching.
MET versus SU MET versus GLI MET versus aGI
MET SU
p-value MET GLI
p-value MET aGI
p-value Number 247 247 128 32 196 49 Age (years) 59.1±8.1 58.9±9.4 0.786 59.5±8.7 59.7±11.9 0.901 57.1±8.9 56.7±10.0 0.791 Female (n, %) 40.9 42.1 0.784 45.3 40.6 0.633 36.2 34.7 0.842 Weight (kg) 65.7±9.9 66.7±9.9 0.234 66.2±10.9 64.6±9.9 0.447 63.3±9.7 62.3±7.5 0.431
Body mass index (kg/m2) 24.9±2.9 25.1±2.9 0.644 25.0±2.7 24.9±2.6 0.849 23.6±2.4 23.5±2.3 0.808
Duration of diabetes (years) 6.8±5.5 7.4±5.5 0.230 5.3±6.2 5.7±5.7 0.736 5.9±5.9 5.9±4.6 0.989
Smoking (current/past/never, %) 12/36/52 15/28/57 0.185 17/36/48 19/25/56 0.516 18/36/46 20/35/46 0.968 Systolic BP (mmHg) 126±15 125±15 0.291 124±13 123±15 0.726 125±15 123±15 0.499 Diastolic BP (mmHg) 78±9 78±10 0.654 78±10 77±11 0.681 77±9 78±10 0.454 HbA1c (%) 6.9±0.9 6.9±0.9 0.867 6.8±0.9 6.8±0.7 0.717 6.5±0.6 6.5±0.6 0.670 Glucose (mg/dL) 127±24 133±34 0.039 126±28 135±23 0.112 124±24 130±22 0.095
18 Creatinine (mg/dL) 0.9±0.2 1.0±0.2 0.093 1.0±0.3 1.1±0.8 0.367 0.9±0.2 0.9±0.2 0.959 eGFR (mL/min/1.73 m2) 75.9±17.3 73.9±21.1 0.259 72.8±15.7 72.0±20.2 0.815 79.3±17.7 79.5±18.6 0.961 Total cholesterol (mg/dL) 179±35 176±36 0.363 186±37 180±42 0.456 182±37 170±38 0.040 Triglyceride (mg/dL) 157±104 161±85 0.590 178±125 195±124 0.475 152±98 139±125 0.441 HDL cholesterol (mg/dL) 50±11 53±12 0.016 48±10 49±12 0.889 49±12 55±14 0.001 LDL cholesterol (mg/dL) 100±30 99±29 0.622 99±28 105±27 0.324 101±30 92±29 0.051 Insulin (µIU/mL) 9.2±6.6 8.9±5.0 0.642 10.5±7.0 7.9±4.8 0.059 8.0±5.6 8.6±8.5 0.601 HOMA-IR 2.9±2.3 2.9±1.8 0.991 3.4±2.7 2.8±1.8 0.276 2.5±2.0 2.8±2.5 0.359 HOMA-B 58.2±48.3 56.1±41.8 0.637 66.8±48.1 45.1±25.5 0.002 53.5±38.1 53.2±73.6 0.971
Medication use rate (%) 88.7±16.1 91.6±13.0 0.032 89.3±15.9 93.9±9.9 0.045 89.1±16.2 85.9±19.1 0.225
Hypertension (%) 52.2 54.7 0.588 53.1 50.0 0.752 42.9 40.8 0.796
Dyslipidemia (%) 39.7 44.9 0.236 48.4 21.9 0.007 34.2 40.8 0.386
Retinopathy (%) 4.5 8.5 0.068 3.9 12.5 0.080 3.1 4.1 0.662
Coronary artery disease
(%) 4.5 7.3 0.180 5.5 0.0 0.346 3.1 4.1 0.662
Cerebrovascular disease
19
Values are presented as means ± standard deviations or as numbers (with %).
MET, metformin; SU, sulfonylurea; aGI, alpha-glucosidase inhibitor; GLI, meglitinide; eGFR, estimated glomerular filtration rate; HOMA-IR, homeostasis model assessment of insulin resistance; HOMA-B, homeostasis model assessment of β-cell function
20
B. Monotherapy failures in each treatment group
When monotherapy failure rates were compared after propensity-score matching (Table 7), the sulfonylurea and meglitinide groups had higher failure rates and the aGI group had a similar failure rate compared with the metformin group (Figure 5; p = 0.011, Figure 6; p = 0.014, and Figure 7; p = 0.465, respectively). The monotherapy failure rates of the sulfonylurea and meglitinide groups did not differ significantly.
21
Figure 5. Kaplan-Meier curve of monotherapy failure after propensity-score matching (metformin vs. sulfonylureas)
22
Figure 6. Kaplan-Meier curve of monotherapy failure after propensity-score matching (metformin vs. meglitinides)
23
Figure 7. Kaplan-Meier curve of monotherapy failure after propensity-score matching (metformin vs. alpha-glucosidase inhibitors)
24
Monotherapy failure was defined as attainment of an HbA1c level ≥ 7.5%, a switch to another anti-diabetic agent, and/or add-on treatment. By failure subtype, sulfonylurea failures often switched to other anti-diabetic agents compared with the metformin group (Table 8; HR 4.43 [95% CI, 2.14–9.17]). As was true of the sulfonylurea group, meglitinide patients were switched more often to other anti-diabetic agents than were metformin patients (HR 18.8 [95% CI, 6.21–56.93]). Add-on treatment failure was less common in the aGI than in the metformin group, although overall failure in the aGI group did not differ significantly from that in the metformin group (HR 0.16 [95% CI, 0.04–0.64]). After monotherapy failure, switched or added anti-diabetic agents are described in Table 9.
25
Table 8. Subtype failure of Monotherapy failure after propensity-score matching.
Drugs Type of failure Events (%) HR (95% CI)* p-value
SU vs. MET Overall 53.4 vs. 42.1 1.39 (1.08 to 1.80) 0.011
Switch 15.0 vs. 3.6 4.43 (2.14 to 9.17) <0.001
Add-on 36.4 vs. 32.8 1.23 (0.91 to 1.66) 0.177
HbA1c >7.5% 20.6 vs. 15.0 1.48 (0.97 to 2.26) 0.069
GLI vs. MET Overall 59.4 vs. 39.8 1.92 (1.13 to 3.27) 0.015
Switch 46.9 vs. 3.1 18.80 (6.21 to 56.93) <0.001
Add-on 0.9 vs. 33.6 0.37 (0.11 to 1.20) 0.096
HbA1c >7.5% 21.9 vs. 10.9 2.16 (0.87 to 5.37) 0.096
aGI vs. MET Overall 26.5 vs. 35.7 0.80 (0.44 to 1.45) 0.467
Switch 14.3 vs. 3.6 4.25 (1.49 to 12.13) 0.007
Add-on 4.1 vs. 28.6 0.16 (0.04 to 0.64) 0.010
HbA1c >7.5% 10.2 vs. 8.7 1.17 (0.43 to 3.18) 0.752
HR, hazard ratio; CI, confidence interval; SU, sulfonylurea; MET, metformin; GLI, meglitinide; aGI, alpha glucosidase inhibitor
26
Table 9. Medications switched or added from original monotherapy
Drugs Type of
failure
Events (%) Switching (adding) drugs Events (%)
MET Switch 3.9 insulin 2.6
others 1.3
Add-on 34.7 DPPIV inhibitor 19.4
SU 11.1
others 4.2
SU Switch 14.9 MET + DPPIV inhibitor 4.8
insulin 4 DPPIV inhibitor 3.2 others 2.8 Add-on 36.5 MET 17.1 aGI 12 others 7.4
GLI Switch 47.1 SU + MET 17.6
MET + DPPIV inhibitor 8.8
SU 8.8
others 11.9
Add-on 8.8 MET 8.8
aGI Switch 14.3 DPPIV inhibitor 6.1
SU 4.1
others 4.1
Add-on 4.1 SU 4.1
MET, metformin; SU, sulfonylurea; aGI, alpha glucosidase inhibitor; GLI, meglitinide
27
Ⅳ. Discussion
The KNDP was a prospective, multicenter, observational, South Korean cohort study. Of these, our study patients had been recently diagnosed with type 2 DM, were obese (BMI ≥25 kg/m2), and exhibited good MPRs; a few patients had
diabetic complications. Overall, the annual monotherapy failure rate was 17%; attaining 40% at 3 years and 60% at 6 years. To the best of our knowledge, this is the first report of monotherapy failure in South Korea. The failure rate was somewhat lower than that of the UKPDS trial 17, which employed stricter failure cut-offs (an HbA1c level > 7% or a fasting plasma glucose level > 140 mg/dL). Compared with the ADOPT trial, the annual monotherapy failure rates of our present study were threefold higher (15.6% vs. 4.3% in the metformin group; 21.3% vs. 7.5% in the sulfonylurea group) 13. The study designs differed significantly. Although the primary ADOPT cut-off levels, determined by reference to consecutive fasting plasma glucose levels > 180 mg/dL, may be somewhat less rigid than ours (an HbA1c level > 7.5%), monotherapy failure, reflected in a switch to or addition of other anti-diabetic agents, may develop before the fasting plasma glucose level attains 180 mg/dL, to afford better glycemic control. In the ADOPT trial, most withdrawals (12%–15%) were attributable to adverse drug events and were included in the analysis, but this was not counted as the monotherapy failure. As the ADOPT was a clinical trial, the participants would have been better motivated than those of our observational cohort study reflecting real clinical practice. Our patients exhibited a somewhat longer DM duration than those of the ADOPT trial which the time since DM diagnosis was < 2 years in most participants. This difference may increase the incidence of monotherapy failure in our study. An observational Swedish study of monotherapy durability reported that failure of sulfonylurea, meglitinide, and metformin monotherapies rose to almost 50% by 5.5 years 18. Analysis of health care
28
databases in the United States revealed that the annual, metformin, monotherapy failure rate was 17% 19. The results of both studies were comparable to our findings.
This study consisted of patients taking one oral hypoglycemic agent for 90 days or longer. So, this study included non-responders who did not show an initial good response or did not tolerate a specific monotherapy. These patients were presented as rapid initial failure of the Kaplan-Meier curve in the metformin vs. sulfonylurea group and the metformin vs. meglitinide group. In comparison between metformin and sulfonylurea group, early non-responders with a monotherapy duration of less than 6 months had longer diabetes duration and higher baseline HbA1c levels than responders (data not shown). In comparison between metformin and meglitinide group, early non-responders in meglitinide group also showed higher baseline HbA1c levels than responders (data not shown). These, such as long diabetes duration and high HbA1c levels might be predictive factors for long-term durability and considerable factor for choice of anti-hyperglycemic agents 19, 20.
Metformin was associated with a lower incidence of monotherapy failure than were either sulfonylureas or meglitinides when both total cohort and propensity score-matched data were analyzed. As we expected, those prescribed metformin among all 998 study patients were younger, more obese, had DM of shorter duration, and fewer comorbidities, than those prescribed sulfonylureas or meglitinides. When baseline characteristics were balanced using propensity-score matching, the risks of monotherapy failure in those given sulfonylureas and meglitinides were 40%–90% higher than that of the metformin group. Switching from one drug to another drug does not always mean poor glucose-lowering effects of the original drug. Monotherapy subtype failure (indicated by a switch to other agents) was significantly higher in both the sulfonylurea and the meglitinide groups than in the metformin group, consistent with the data of a previous report 18. In the sulfonylurea group, switching to another monotherapy rather than combination treatment or insulin treatment was more common compared with the metformin group. That is, adverse
29
drug reactions of sulfonylurea, such as hypoglycemia and weight gain, may be a considerable factor of high rate of switching failure. Lower β cell function is related to treatment failure 17. In comparison between the metformin and meglitinide group, the meglitinide group had lower HOMA-B than the metformin group. This may be a confounding factor and influence the high rate of monotherapy failure in the meglitinide group. Progressive glycemic deterioration is associated with loss of β-cell function 13. Metformin may retard β-cell dysfunction; pharmacologically, metformin increases insulin sensitivity and reduces the workload imposed on pancreatic β cells. In vitro, metformin protected pancreatic β cells, while sulfonylureas did not 21-23. East Asians exhibit lower β-cell function than do other ethnic groups, and lack the ability to induce early-stage compensatory hyperinsulinemia during DM development 8, 24. To overcome β-cell dysfunction, insulin secretagogues, such as sulfonylureas and meglitinides, can be the preferred drugs for East Asians. However, when the preservation of β-cell function and the durability of anti-diabetic drugs are prioritized, monotherapy using insulin secretagogues may fail more rapidly in South Koreans with type 2 DM than in Western populations. Comparison studies in East Asians showed that sulfonylureas rapidly and effectively lowered HbA1c levels more than did than metformin, but only for several months 25, 26. However, the HR for monotherapy failure of insulin
secretagogues in South Koreans was no higher than that of the Swedish cohort. Clinicians have to determine the next steps, such as change or the adding of anti-hyperglycemic agents, after monotherapy failure due to progressive nature of the disease. To view cases with monotherapy failure in our data, especially focused on metformin or sulfonyluea treatment groups, major further treatment option was combination therapy by adding another anti-hyperglycemic agent or switching to dual therapy. According to current guidelines, there are several options of dual therapy when monotherapy failed 2, 27. In our data, metformin plus sulfonylurea and metformin plus DPPIV inhibitor were most common. These are reflecting
30
prescription trends of anti-hyperglycemic agents in Korea 28. Metformin plus
sulfonylurea is the traditional combination therapy. Metformin’s position as a first-line treatment and cornerstone of combination therapy may be solid. Sulfonylureas are still commonly used due to a comparatively higher efficacy and lower cost, although sulfonylureas have a short time to failure, high risk of hypoglycaemia, and weight gain. Otherwise, DPPIV inhibitors become a widespread anti-hyperglycemic agent due to favorable safety profiles. However, the ideal combination therapy can differ according to patient’s factors; thus, the pros and cons of anti-hyperglycemic drugs should be well considered. Most current guidelines recommend individualized therapy in patient with diabetes.
To the best of our knowledge, this is the first report on aGI monotherapy failure in clinical practice. In present study, aGI group had a similar failure rate compared with the metformin group. Although compliance with aGI regimens is poor (attributable to gastrointestinal side effects and the need for frequent doses), this class of drugs is optimal DM treatment for South Koreans who consume high levels of carbohydrates 29, 30. AGIs reduce plasma glucose levels by delaying digestion and absorption of consumed carbohydrates; aGIs exert no direct effect on insulin secretion. Both metformin and acarbose delayed the progression from prediabetes to DM 31. The similarity of durability in both drugs could be associated
with the effects on preventing diabetes and mechanisms of action with no direct effects on insulin secretion. Additionally, we found that aGIs had significantly lower add-on failure rate than did metformin, although overall monotherapy failure was comparable.
Unfortunately, we can offer no data on monotherapies using DPPIV inhibitors or thiazolidinediones; patient numbers were too small. DPPIV inhibitors were introduced in South Korea only in 2011 and thiazolidinedione prescriptions have fallen rapidly in number since 2007.
31
Our study had certain limitations. The numbers of patients on aGI or meglitinide monotherapies were relatively small compared to the numbers given metformin or sulfonylureas, reflecting current prescription practices 28. We did not explore within-class drug durabilities. Physicians prescribed each drug base on patient’s characteristics; selection bias may have been in play. Although we matched several baseline characteristics, we may not have identified all possible confounding factors.
32
Ⅴ. Conclusions
In conclusion, the annual overall monotherapy failure rate was 17% in South Koreans with type 2 DM enrolled in the KNDP cohort study. Using propensity-score matching, we found that metformin was associated with a lower risk of monotherapy failure than were sulfonylureas and meglitinides; the failure rates of metformin and aGIs were comparable. Our data will aid in the choice of appropriate treatment for patients with type 2 DM.
33
References
1. Glycemic Targets. Diabetes Care. 2017;40(Suppl 1):S48-s56. 2. Pharmacologic Approaches to Glycemic Treatment. Diabetes Care. 2017;40(Suppl 1):S64-s74.
3. U.K. prospective diabetes study 16. Overview of 6 years' therapy of type II diabetes: a progressive disease. U.K. Prospective Diabetes Study Group. Diabetes. 1995;44(11):1249-58.
4. Kahn SE. Clinical review 135: The importance of beta-cell failure in the development and progression of type 2 diabetes. The Journal of clinical
endocrinology and metabolism. 2001;86(9):4047-58.
5. DeFronzo RA, Eldor R, Abdul-Ghani M. Pathophysiologic approach to therapy in patients with newly diagnosed type 2 diabetes. Diabetes Care. 2013;36 Suppl 2:S127-38.
6. Kahn SE, Hull RL, Utzschneider KM. Mechanisms linking obesity to insulin resistance and type 2 diabetes. Nature. 2006;444(7121):840-6.
7. Kodama K, Tojjar D, Yamada S, et al. Ethnic differences in the
relationship between insulin sensitivity and insulin response: a systematic review and meta-analysis. Diabetes Care. 2013;36(6):1789-96.
8. Ohn JH, Kwak SH, Cho YM, et al. 10-year trajectory of beta-cell function and insulin sensitivity in the development of type 2 diabetes: a community-based prospective cohort study. The lancet Diabetes & endocrinology. 2016;4(1):27-34. 9. Dankner R, Chetrit A, Shanik MH, et al. Basal-state hyperinsulinemia in healthy normoglycemic adults is predictive of type 2 diabetes over a 24-year follow-up: a preliminary report. Diabetes Care. 2009;32(8):1464-6.
10. Tripathy D, Carlsson M, Almgren P, et al. Insulin secretion and insulin sensitivity in relation to glucose tolerance: lessons from the Botnia Study. Diabetes. 2000;49(6):975-80.
34
11. Kim DJ, Lee MS, Kim KW, et al. Insulin secretory dysfunction and insulin resistance in the pathogenesis of korean type 2 diabetes mellitus. Metabolism: clinical and experimental. 2001;50(5):590-3.
12. Tabak AG, Jokela M, Akbaraly TN, et al. Trajectories of glycaemia, insulin sensitivity, and insulin secretion before diagnosis of type 2 diabetes: an analysis from the Whitehall II study. Lancet (London, England).
2009;373(9682):2215-21.
13. Kahn SE, Haffner SM, Heise MA, et al. Glycemic durability of
rosiglitazone, metformin, or glyburide monotherapy. The New England journal of medicine. 2006;355(23):2427-43.
14. Rhee SY, Chon S, Kwon MK, et al. Prevalence of chronic complications in korean patients with type 2 diabetes mellitus based on the korean national diabetes program. Diabetes Metab J. 2011;35(5):504-12.
15. Levey AS, Stevens LA, Schmid CH, et al. A new equation to estimate glomerular filtration rate. Ann Intern Med. 2009;150(9):604-12.
16. Matthews DR, Hosker JP, Rudenski AS, et al. Homeostasis model assessment: insulin resistance and beta-cell function from fasting plasma glucose and insulin concentrations in man. Diabetologia. 1985;28(7):412-9.
17. Turner RC, Cull CA, Frighi V, et al. Glycemic control with diet, sulfonylurea, metformin, or insulin in patients with type 2 diabetes mellitus: progressive requirement for multiple therapies (UKPDS 49). UK Prospective Diabetes Study (UKPDS) Group. Jama. 1999;281(21):2005-12.
18. Ekstrom N, Svensson AM, Miftaraj M, et al. Durability of oral
hypoglycemic agents in drug naive patients with type 2 diabetes: report from the Swedish National Diabetes Register (NDR). BMJ open diabetes research & care. 2015;3(1):e000059.
19. Brown JB, Conner C, Nichols GA. Secondary failure of metformin monotherapy in clinical practice. Diabetes Care. 2010;33(3):501-6.
35
20. Rathmann W, Strassburger K, Bongaerts B, et al. Impact of insulin sensitivity, beta-cell function and glycaemic control on initiation of second-line glucose-lowering treatment in newly diagnosed type 2 diabetes. Diabetes, obesity & metabolism. 2017;19(6):866-73.
21. Dai YL, Huang SL, Leng Y. AICAR and Metformin Exert AMPK-dependent Effects on INS-1E Pancreatic beta-cell Apoptosis via Differential Downstream Mechanisms. International journal of biological sciences. 2015;11(11):1272-80.
22. Lablanche S, Cottet-Rousselle C, Lamarche F, et al. Protection of pancreatic INS-1 beta-cells from glucose- and fructose-induced cell death by inhibiting mitochondrial permeability transition with cyclosporin A or metformin. Cell death & disease. 2011;2:e134.
23. Efanova IB, Zaitsev SV, Zhivotovsky B, et al. Glucose and tolbutamide induce apoptosis in pancreatic beta-cells. A process dependent on intracellular Ca2+ concentration. The Journal of biological chemistry. 1998;273(50):33501-7. 24. Kim JD, Lee WY. Insulin Secretory Capacity and Insulin Resistance in Korean Type 2 Diabetes Mellitus Patients. Endocrinology and metabolism (Seoul, Korea). 2016;31(3):354-60.
25. Yoon KH, Shin JA, Kwon HS, et al. Comparison of the efficacy of
glimepiride, metformin, and rosiglitazone monotherapy in korean drug-naive type 2 diabetic patients: the practical evidence of antidiabetic monotherapy study.
Diabetes Metab J. 2011;35(1):26-33.
26. Yamanouchi T, Sakai T, Igarashi K, et al. Comparison of metabolic effects of pioglitazone, metformin, and glimepiride over 1 year in Japanese patients with newly diagnosed Type 2 diabetes. Diabetic medicine : a journal of the British Diabetic Association. 2005;22(8):980-5.
27. Moon MK, Hur KY, Ko SH, et al. Combination Therapy of Oral
36
2017;41(5):357-66.
28. Ko SH, Kim DJ, Park JH, et al. Trends of antidiabetic drug use in adult type 2 diabetes in Korea in 2002-2013: Nationwide population-based cohort study. Medicine. 2016;95(27):e4018.
29. Kim SH, Hong SB, Suh YJ, et al. Association between nutrient intake and obesity in type 2 diabetic patients from the Korean National Diabetes Program: a cross-sectional study. Journal of Korean medical science. 2012;27(10):1188-95. 30. Zhu Q, Tong Y, Wu T, et al. Comparison of the hypoglycemic effect of acarbose monotherapy in patients with type 2 diabetes mellitus consuming an Eastern or Western diet: a systematic meta-analysis. Clinical therapeutics. 2013;35(6):880-99.
31. Chiasson JL, Josse RG, Gomis R, et al. Acarbose for prevention of type 2 diabetes mellitus: the STOP-NIDDM randomised trial. Lancet (London, England). 2002;359(9323):2072-7.
37 국문요약
-제2형 당뇨병 환자에서 경구혈당강하제 단독요법 실패율
전자영 의학과/의학전공 아주대학교 대학원 (지도교수: 이관우) 목적 본 연구는 실제 임상현장에서 2형 당뇨병 환자의 경구혈당강하제 단독요 법의 실패율을 비교분석해 보고자 하였다. 방법Korean National Diabetes Program (KNDP) 은 제2형 당뇨병 환자를 대상 으로 시행된 전향적, 다기관 관찰연구이다. 본 연구는 KNDP 에 모집된 3950 명의 환자 중에서 최소 90일 이상 단독요법을 지속적으로 시행받은 998명을 대상으로 하였다. 각각의 단독요법을 시행받은 군의 기본 특성을 맞추기 위하 여 메트포르민 단독요법군과 설폰요소제 단독요법군은 1대1 비율로, 메트포르 민 단독요법군과 메글리티나이드 단독요법군은 4대1 비율로, 메트포르민 단독 요법군과 글루코시데이트 억제제 단독요법군은 4대 1의 비율로 성향점수 매칭 (propensity-score matching)을 이용하였다. 각 단독요법군의 치료 실패율을 비교하기 위하여 Cox 비례위험모형을 이용하여 분석하였다. 결과 추적관찰 기간의 중앙값은 56개월이었고 대상환자의 45%에서 단독요법 실패를 경험하였다. 각 단독요법의 연간 치료 실패율은 메트포르민 단독요법군
38 에서는 15.6%, 설폰요소제 단독요법군에서는 21.3%, 메글리티나이드 단독요법 군에서는 27%, 그리고 글루코시데이즈 억제제 단독요법군에서는 9.6% 를 보 였다. 메트포르민 단독요법군과 비교시 설폰요소제 단독요법군과 메글리티나이 드 단독요법군은 치료 실패율이 의미있게 높았고 (HR 1.39, 95% CI 1.08-1.80; HR 1.92, 95% CI 1.13-3.27) 글루코시데이즈 억제제 단독요법군의 치료 실패율 은 비슷하였다 (HR 0.80, 95% CI 0.11-1.45). 치료 실패유형에 따라 구분하였 을 때, 메트포르민 단독요법군에 비하여 설폰요소제 단독요법군, 메글리티나이 트 단독요법군과 글루코시데이즈 억제제 단독요법군은 다른 약제로의 변경이 많았고 (HR 4.43, CI 2.14–9.17; HR 18.80, CI 6.21–56.93; HR 4.25 CI 1.49– 12.13) 글루코시데이즈 억제제는 이차약제 추가하는 경우가 적었다 (HR 0.16, CI 0.04–0.64). 결론 메트포르민 단독요법은 설폰요소제 단독요법 및 메글리티나이트 단독요 법에 비하여 치료 실패율이 낮았고 글루코시데이즈 억제제의 치료 실패율과는 유사하였다. 주제어: 코호트 연구, 경구혈당강하제 단독요법 실패율, 2형 당뇨병