저작자표시-비영리-변경금지 2.0 대한민국 이용자는 아래의 조건을 따르는 경우에 한하여 자유롭게
l 이 저작물을 복제, 배포, 전송, 전시, 공연 및 방송할 수 있습니다. 다음과 같은 조건을 따라야 합니다:
l 귀하는, 이 저작물의 재이용이나 배포의 경우, 이 저작물에 적용된 이용허락조건 을 명확하게 나타내어야 합니다.
l 저작권자로부터 별도의 허가를 받으면 이러한 조건들은 적용되지 않습니다.
저작권법에 따른 이용자의 권리는 위의 내용에 의하여 영향을 받지 않습니다. 이것은 이용허락규약(Legal Code)을 이해하기 쉽게 요약한 것입니다.
Disclaimer
저작자표시. 귀하는 원저작자를 표시하여야 합니다.
비영리. 귀하는 이 저작물을 영리 목적으로 이용할 수 없습니다.
변경금지. 귀하는 이 저작물을 개작, 변형 또는 가공할 수 없습니다.
이학석사 학위논문
SHH 수모세포종양에서
M1 대식세포 침윤과 예후와의 상관관계 분석
M1 Macrophage Recruitment Correlates with Worse Outcome in SHH Medulloblastoma
2018년 2월
서울대학교 대학원
협동과정 뇌과학전공
Chanhee Lee
이학석사 학위논문
SHH 수모세포종양에서
M1 대식세포 침윤과 예후와의 상관관계 분석
M1 Macrophage Recruitment Correlates with Worse Outcome in SHH Medulloblastoma
2018년 2월
서울대학교 대학원
협동과정 뇌과학전공
Chanhee Lee
SHH 수모세포종양에서
M1 대식세포 침윤과 예후와의 상관관계 분석
M1 Macrophage Recruitment Correlates with Worse Outcome in SHH Medulloblastoma
지도교수 왕 규 창
이 논문을 이학석사 학위논문으로 제출함
2017 년 12월
서울대학교 대학원 협동과정 뇌과학전공
Chanhee Lee
Chanhee Lee 의 석사학위논문을 인준함
2017 년 12월
위 원 장 김 승 기 (인)
부 위 원 장 왕 규 창 (인)
위 원 이 지 연 (인)
Abstract
Background. Recent progress in molecular analysis has advanced the understanding of medulloblastoma (MB) and it is anticipated to help the management of the disease. It is revealed to be comprised of 4 molecular subgroups:
WNT, SHH, Group 3, and Group 4. Macrophage has been suggested to play a crucial role in tumor microenvironment, however functional role of their activated phenotype (M1/M2) is still controversial. Herein, we investigate the correlation between tumor-associated macrophages (TAM), both M1 and M2 macrophages, within MB subgroups and the prognosis.
Methods. Molecular subgrouping was performed by nanoString-based RNA assay on retrieved snap-frozen tissue samples. Immunohistochemistry (IHC) and immunofluorescence (IF) assay were performed on subgroup identified samples and number of polarized macrophages were quantified from IHC. Survival analyses were conducted with collected clinical data and quantified macrophage data.
Results. TAM (M1/M2) recruitment in SHH MB was significantly higher compared to other subgroups. Kaplan-Meier survival curve and multivariate cox regression demonstrated that high M1 expressers show worse overall survival (OS)
and progression-free survival (PFS) than low expressers in SHH MB with relative risk (RR) of 11.918 and 6.022, respectively.
Conclusion. M1 rather than M2 correlates better with worse outcome in SHH medulloblastoma.
Key Words: medulloblastoma, sonic hedgehog, macrophage, recruitment, prognosis
Student Number: 2016-20458
Contents
I. Background ... 1
II. Materials and Methods ... 4
III. Results ... 8
IV. Tables and Figures ... 12
V. Discussion ... 24
VI. Conclusion ... 27
VII. References ... 29
VIII. Korean Abstract ... 34
1
Background
Medulloblastoma (MB) is the most common pediatric brain malignancy that frequently arises below 10 years of age [1, 2]. Approximately 20 - 30% of the patients remain incurable and high dose radiation and chemotherapy frequently cause significant long-term sequelae [3]. Progress in molecular diagnostics revealed that MB is classified into 4 subgroups; WNT, SHH, Group 3 (G3) and Group 4 (G4) [1, 2, 4]. Prognosis of each subgroup ranges from excellent in WNT MB to intermediate in SHH and G4, to poor in G3 MB [1, 4]. As subgroup-specific prognostication and personalized medicine are in demand, clinically applicable subgrouping became essential [3, 5-7]. Practical molecular subgrouping has been developed from multiple researchers through screening subgroup-specific signature genes using various tools, such as nanoString nCounter [3, 4, 6].
The significance of lymphocytes and tumor-associated macrophages (TAM) in tumor microenvironment has been incessantly raised for more than a decade, however their comprehensive role is rather elusive [8-12]. TAM are known to release growth factors, cytokines, and inflammatory mediators in their environment and are classified according to their functional phenotype [13-16]. Current paradigm of macrophage polarization is undergoing reassessment but it has been commonly accepted that classically activated M1 macrophages suppress tumor growth and progression by the production of reactive nitrogen species (e.g. nitric
2
oxide) whereas alternatively activated M2 macrophages promote them by releasing growth factors (e.g. epidermal growth factor, fibroblast growth factor 1, vascular endothelial growth factor A) [9, 13-16]. Due to the complexity of the tumor microenvironment and diverse contributing factors such as immune responses, tumor stages, and types of tumor, the literature has often demonstrated conflicting roles of TAMs in various cancers [11, 13, 17-20].
Despite the molecular insights provided by MB subgroups, relatively little is known about the role of tumor microenvironment with respect to MB and its subgroups [8]. A previous report on characterization of immunophenotype in pediatric brain tumors suggests that MB is less infiltrated with T lymphocytes and displays immunosuppressive M2 phenotype compared to other pediatric brain tumors [8]. A recent study demonstrated that TAMs recruitment is subgroup- specific in MB, that is, the expression of TAM-associated genes was significantly higher in SHH subgroup [3]. This indicates that SHH MB has distinct tumor microenvironment which may have important pathophysiological and therapeutic implications. However, the roles of TAM and its activation phenotypes are inconclusive because the previous study did not present prognostic connotations of TAMs in SHH MB [3]
In this study, we investigate the correlation between TAM in SHH MB with the prognosis. We identified that M1 macrophage rather than total TAM infiltration correlates better with reduced overall survival outcome within SHH subgroup.
3
Considering the commonly accepted role of macrophage polarization in various human cancers (M1 tumor-suppressing and M2 tumor-promoting roles), the negative prognostic implication of M1 macrophage in SHH MB is intriguing and requires further investigation.
4
Materials and Methods
Patients and samples
The Institutional Review Board (IRB) of the Seoul National University Hospital approved the study protocol (IRB approval No. 1610-027-797). To identify SHH MB, 48 snap-frozen MB tissues were retrieved from the Tissue Bank of the Department of Neurosurgery, Seoul National University Hospital. Tissue samples were collected from 1999 to 2015, out of 141 MB patients operated in SNUCH during this time. The molecular subgroups of the samples were partially verified through immunohistochemistry (IHC) using representative markers [4]. To solidify the molecular subgroup, nanoString-based RNA assay was performed on these samples. Previously, we provided MB tissues to Dr. M. Taylor from Hospital for Sick Children (Toronto, Canada) for study, and the molecular subgroups were provided for these cases through nanoString [10]. We collected 32 SHH MBs from the two sources [cases newly tested for subgrouping (n = 16) and cases with subgroup information from Toronto (n = 16)]. Out of 32 known SHH MB patients, 25 were available with formalin-fixed paraffin-embedded (FFPE) tissues. Two FFPE tissue samples were opted out due to small size or insufficiency for a full-set experiment; 23 SHH MB samples were collected from our institution. Additional 7 SHH MB FFPE tissue samples were received from Yonsei University. In total, 30 SHH MB were analyzed for this study. Subgroups other than SHH were
5
randomly selected, with respect to FFPE tissue availability, as control groups to validate the correlation between MB subgroups and TAM infiltration (WNT = 3, Group 3 = 2, Group 4 = 17).
Subgrouping
Molecular subgroups were identified through gene profiling using nanoString nCounter [6]. Total RNA was extracted from snap-frozen patient tissue samples (n
= 48) using miRNeasy kit following manufacturer’s protocol (life technology, USA). Procedures related to hybridization, detection and scanning were performed as recommended by nanoString Technologies (Seattle, WA). Collected data was normalized in R, and algorithm for class prediction analysis was provided by Dr.
M. Taylor (Toronto, Canada) [6]. The subgroup of additionally received FFPE tissue samples from Yonsei University were provided by Dr. S. Kim (Seoul, Korea) which were identified through immunohistochemistry (IHC).
Immunohistochemistry
Macrophage recruitment was investigated using IHC assay on FFPE tissue samples (n = 45). Human tonsil tissue was used as the positive control (Fig. 1).
Recruitment of activated macrophages were identified using following antibodies:
CD68 for total, CD86 for M1-activation, and CD163 for M2-activation (Table 1).
Five hot-spots were randomly selected in each paraffin section and positive cells
6
were counted out of 300 counter-stained-cells using ImageJ Cell Counter plugin [21]. Mean value of the five hot-spots count were used in the following statistical analyses. Researchers engaged in the experiment were blinded from all clinical data, including subgroup, through data collection.
Immunofluorescence
To confirm the independent localization of M1 and M2 macrophages, immunofluorescence (IF) assay was performed on FFPE tissue samples. Retrieved blocks were sectioned at 4 µm using a microtome and transferred to silane-coated slides by the SNUH pathology lab. Slides were deparaffinized in xylene and rehydrated through series of graded ethanol. To retrieve antigen, slides were microwaved in 10 mM sodium citrate buffer (pH 6.0) for 3 minutes, with 15 second cooling interval after 2 minutes. Slides were washed three times in phosphate- buffered saline (PBS) with 0.1% bovine serum albumin (BSA) for 5 minutes each, then permeabilized (1x PBS/ Timerasol: 95mg/L, saponin 0.1g/L, normal goat serum: 1%) for 15 minutes. Slides were subsequently blocked in blocking solution (1xPBS/ Timerasol: 95mg/L, saponin: 0.35g/L, normal goat serum: 3.5%) for 30 minutes at room temperature [22]. Primary antibody was prepared in the SD buffer, with adequate dilution and incubated over night at 4°C (Table. 1). Secondary antibody was likewise diluted accordingly and applied for 1 hour at room temperature.
7
Clinical data
Clinical data including sex, age at diagnosis, pathology, degree of surgical resection, presence of leptomeningeal seeding at presentation, applied treatment modalities, progression, and survival were collected independently of the researchers conducting the experiments. Progression-free survival (PFS) refers to the time interval from the day of initial surgery to the date when the tumor progression was identified radiologically or the date of the last follow-up [10].
Overall survival (OS) refers to the time interval from the day of initial surgery to the date of patient death, or the date of the last follow-up [10].
Statistical analysis
Subgroup prediction analysis was conducted in R. IBM SPSS Statistics version 23 were used to carry out common statistical analysis including χ2, bivariate Pearson correlation, Cox regression analysis, survival analysis, and log-rank test, as described previously [10]. Appropriate indications are made in the text and data.
8
Results
Identification of molecular subgroups using nanoString nCounter
To identify SHH MB, we performed gene profiling on 22 subgroup-specific signature genes on selected samples (n = 48) using nanoString nCounter [6]. We identified 5 WNT, 16 SHH, 5 Group3, and 26 Group4 MBs through class prediction analysis (Fig. 2); 7 of the 16 patients identified as belonging to the SHH subgroup had adequate FFPE tissue sample available. Additionally, 16 SHH samples that were previously identified by the same method in Toronto were incorporated to make a total number of 23 SHH samples. Randomly selected 22 non-SHH subgroup samples were analyzed as control groups for the reliability and validity of IHC/IF techniques and counting. The subgroup of 7 samples received from Yonsei University were pre-identified by immunohistochemistry only.
Activated macrophage recruitment in medulloblastoma subgroups
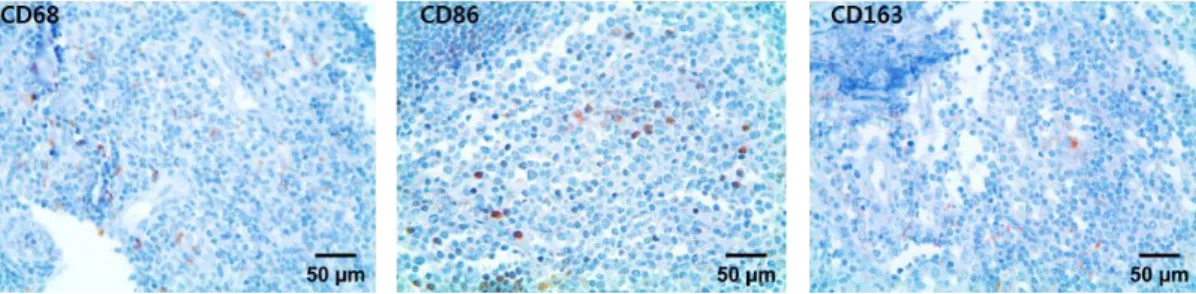
First, we sought to investigate the unique recruitment pattern of tumor-associated macrophages (TAM) in different MB subgroups. Immunohistochemistry (IHC) analysis was conducted to identify the macrophage recruitment (Fig. 3A). Through immunofluorescence (IF) analysis, we confirmed that M1 and M2 macrophages identified by CD86 and CD163 are located at different spots and are independently distinguishable (Fig. 3B). The recruited proportion of CD68-, CD86-, and CD163-
9
positive macrophages were quantified in each subgroup (Fig. 4A & B). Notably, CD163-positive M2 macrophages were significantly higher in SHH subgroup (n = 23) compared to other subgroups (n = 22) (P < .001). M1 macrophage recruitment was also significantly higher in SHH subgroup than in non-SHH subgroups (P
= .048).
TAM recruitment and patient characteristics
M2 macrophage proportion also correlated with patients <3 years of age (P
= .015) and lateral location of the tumor (P = .008), which are known indicators of SHH subgroup (Fig. 4C). We verified that our quantification method and results corroborate with a previous study with different quantification method [3].
TAM recruitment and survival outcomes in MB
Statistical analysis was conducted on the collected data to demonstrate the correlation between TAM in MB and the prognosis. We defined patient groups dichotomously of high and low macrophage expressers based on the median-value of macrophage counts. OS and PFS analyses on counted M1 and M2 activation markers were performed using Kaplan-Meier plot and log-rank test (Fig. 5). MB patients with high M1 count showed considerable trend with shorter OS (P = .064).
On the other hand, patients with high M2 count showed shorter PFS (P = .037), but this did not affect the OS of the patients. Considering that about half of all
10
included cases were of the SHH subgroup and TAM is overrepresented only in this subgroup, the prognostic implications may be more clarified in SHH subgroup.
TAM recruitment and survival outcomes in SHH MB
We investigated if SHH-specific macrophage recruitment shows correlation with the survival outcomes in SHH MB (Fig. 6). High M1 expressers showed significantly shorter OS (P = .013) and trend with shorter PFS (P = .065).
Prognostic factors those are known to affect the outcomes such as sex, age, and leptomeningeal seeding were incorporated in multivariate cox regression analysis (Table 2 & 3). Interestingly, high M1 macrophage significantly correlated with shorter OS (P = .030, RR = 11.918, 95% CI = 1.265–112.282) and PFS (P = .027, RR = 6.022, 95% CI = 1.232–29.433) in SHH subgroup (Fig. 6A). M2 macrophage recruitment did not show an obvious correlation with the outcome of SHH subgroup patients (Fig. 6B, Table 3).
TAM and survival outcome correlation in comparison with other group
To further confirm the correlation between the TAM recruitment and survival outcome, additional 7 SHH MB from other group were discretely investigated (Fig.
7). Due to short follow-up (FU) period and small population, the correlation between TAM recruitment and survival outcome is not significant, but the survival graphs showed considerable trend with the current study cohort.
11
TAM recruitment and other prognostic factors in SHH MB
With respect to the TAM infiltration within MB, other prognostic factors were investigated to identify possible correlation (Table 4). A multivariate analysis using binary logistic regression revealed that age, lateral tumor location, and large residual tumor (> 1.5cm2) were not significantly related to M1 and M2 macrophage recruitment patterns in SHH MB (Table. 5).
12
Tables and Figures
Table 1. List of antibodies used for immunohistochemistry and immuno- fluorescence assay
Antibodies Supplier Species Dilution
(IHC) Dilution (IF) 2° Ab Reference
CD68 Abcam (San Diego, Ca) Mouse 1:200 1:400 1:5000 ab955
CD86 LSBio (Seattle, WA) Rabbit 1:6000 1:1600 1:5000 LS-B11911
CD163 Abcam (San Diego, Ca) Mouse 1:600 1:800 1:5000 ab156769
13
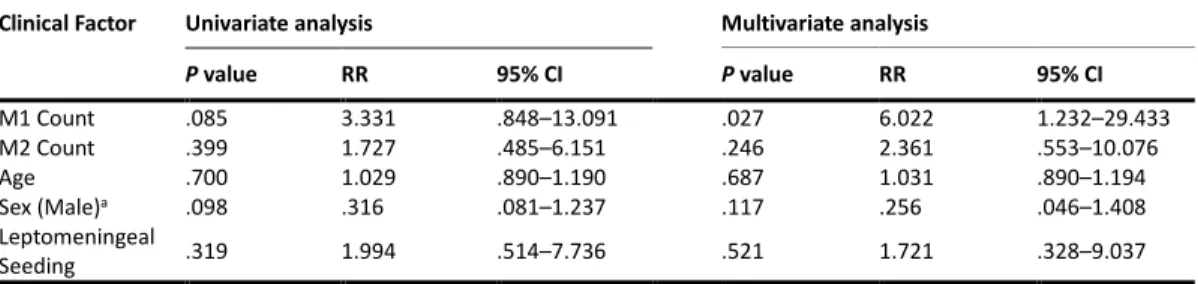
Table 2. Relative risks for shorter PFS in SHH MB estimated with a Cox proportional hazards model
Clinical Factor Univariate analysis Multivariate analysis
P value RR 95% CI P value RR 95% CI
M1 Count .085 3.331 .848–13.091 .027 6.022 1.232–29.433
M2 Count .399 1.727 .485–6.151 .246 2.361 .553–10.076
Age .700 1.029 .890–1.190 .687 1.031 .890–1.194
Sex (Male)a .098 .316 .081–1.237 .117 .256 .046–1.408
Leptomeningeal
Seeding .319 1.994 .514–7.736 .521 1.721 .328–9.037
RR, relative risk; CI, confidence interval.
aSex was included in the multivariate analysis model as a basic variable
14
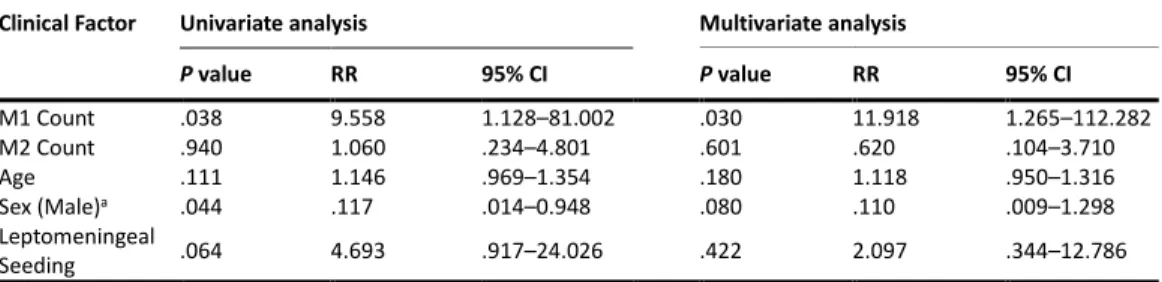
Table 3. Relative risks for shorter OS in SHH MB estimated with a Cox proportional hazards model
Clinical Factor Univariate analysis Multivariate analysis
P value RR 95% CI P value RR 95% CI
M1 Count .038 9.558 1.128–81.002 .030 11.918 1.265–112.282
M2 Count .940 1.060 .234–4.801 .601 .620 .104–3.710
Age .111 1.146 .969–1.354 .180 1.118 .950–1.316
Sex (Male)a .044 .117 .014–0.948 .080 .110 .009–1.298
Leptomeningeal
Seeding .064 4.693 .917–24.026 .422 2.097 .344–12.786
RR, relative risk; CI, confidence interval.
aSex was included in the multivariate analysis model as a basic variable
15
Table 4. Patient characteristics according to activated macrophage recruitment in SHH
Macrophage
Polarization CD86 (M1 macrophages) CD163 (M2 macrophages)
High Expressersa Low Expressersb High Expressersa Low Expressersb
Number 12 11 12 11
Mean 6.4 ± .6 2.1 ± .3 11.2 ± .4 4.6 ± .7
Age 5.0 ± 1.1 4.6 ± 1.5 5.7 ± 1.4 4.0 ± 1.2
M:F 7:5 5:6 7:5 5:6
Lateral tumor
location 7 (30%) 7 (30%) 8 (35%) 6 (26%)
Gross total
resection 10 (43%) 6 (26%) 9 (39%) 7 (30%)
Large residual
tumor (>1.5cm2) 1 (4%) 3 (13%) 2 (9%) 2 (9%)
Leptomeningeal
Seeding 3 (13%) 2 (9%) 3 (13%) 2 (9%)
aHigh expressers indicates patients with greater than or equal to median count.
aLow expressers indicates patients with lower than median count
16
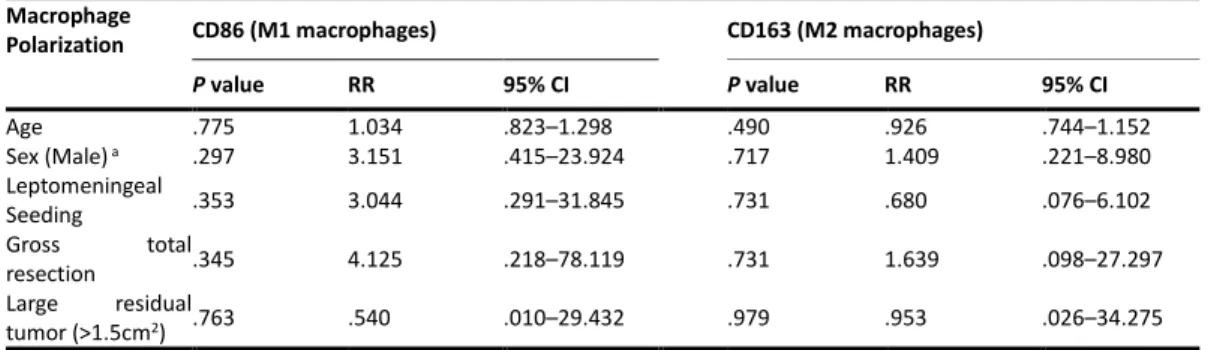
Table 5. Correlation between TAM and other prognostic factors estimated with a logistic regression in SHH MB
Macrophage
Polarization CD86 (M1 macrophages) CD163 (M2 macrophages)
P value RR 95% CI P value RR 95% CI
Age .775 1.034 .823–1.298 .490 .926 .744–1.152
Sex (Male) a .297 3.151 .415–23.924 .717 1.409 .221–8.980
Leptomeningeal
Seeding .353 3.044 .291–31.845 .731 .680 .076–6.102
Gross total
resection .345 4.125 .218–78.119 .731 1.639 .098–27.297
Large residual
tumor (>1.5cm2) .763 .540 .010–29.432 .979 .953 .026–34.275
RR, relative ratio; CI, confidence interval.
aSex was included in the multivariate analysis model as a basic variable
17
Figure 1. Macrophage recruitment in human tonsil FFPE tissue. Representative CD68, CD86, and CD163 IHC images are shown as the positive controls for IHC analyses.
18
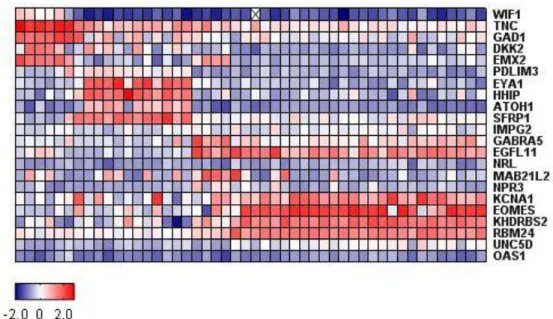
Figure 2. Expression heatmap for 22 subgroup-specific signature genes in a 48 study patients by nanoString nCounter System. 16 SHH, 5 WNT, 4 Group 3, and 26 Group 4 were resulted, and 7 of 16 SHH patients were available with FFPE tissues samples.
19
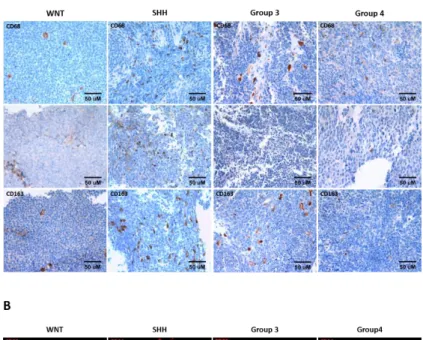
Figure 3. TAM recruitment across MB subgroups. (A) Representative CD68, CD86, CD163 IHC images in WNT (n = 3), SHH (n = 23), Group 3 (n = 2) and Group 4 (n = 17) subgroups. Scale bar, 200 µm (B) Representative CD86 and CD163 IF images in each subgroup. Scale bar, 50 µm.
20
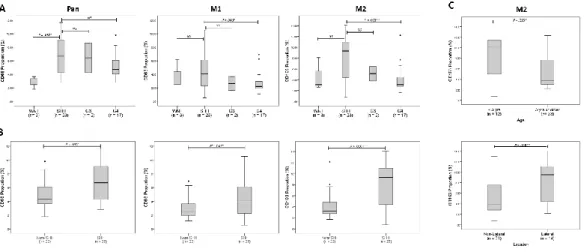
Figure 4. Proportion of TAM recruitment in MB. (A) Comparison of macrophage recruitment between 4 subgroups. One-way ANOVA analysis results were presented however, due to the small number of WNT and Group 3 subgroup samples, statistical significance is neglected. (B) Comparison between SHH and non-SHH subgroups; CD68 (P = .035), CD86 (P = .042), and CD163 (P < .0001) were significantly higher in SHH subgroup than in non-SHH subgroups. (C) CD163-positive macrophages were significantly higher in patients younger than 3 years-of-age (P = .015) as well as the lateral location of the tumor (P = .008).
21
Figure. 5 TAM recruitment and prognostic outcomes in whole patient cohort. (A) PFS and OS analysis using Kaplan-Meier plots and log-rank test based on CD86- positive macrophage counts. High M1 recruitment showed boundary significant trend with shorter OS (P = .064). (B) PFS and OS analysis based on CD163- positive macrophage counts. M2 recruitment significantly correlated with shorter PFS (P = .037), but did not show an obvious correlation with OS.
22
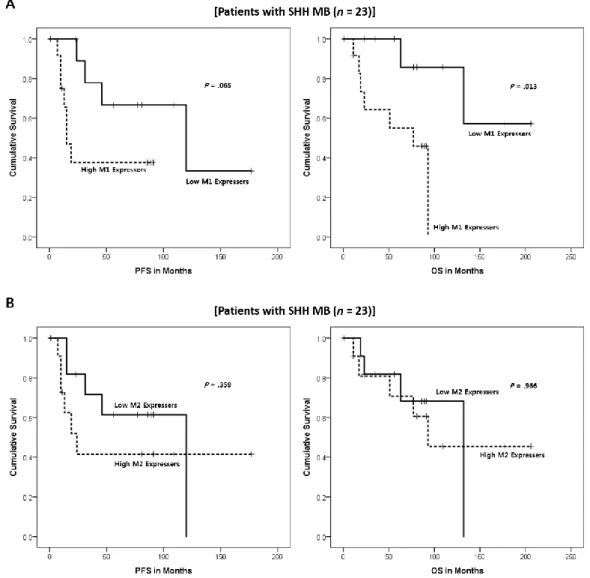
Figure 6. TAM recruitment and prognostic outcomes in SHH MB. (A) PFS and OS analysis using Kaplan-Meier plots and log-rank test based on CD86-positive macrophage counts. High M1 recruitment is correlated with shorter PFS (P = .065) and OS (P = .013). (B) PFS and OS analysis based on CD163-positive macrophage counts. M2 recruitment did not show an obvious correlation with prognostic outcomes.
23
Figure 7. TAM recruitment and prognostic outcomes in SHH MB from Yonsei University. (A) PFS and OS analysis using Kaplan-Meier plots and log-rank test based on CD86-positive macrophage counts. (B) PFS and OS analysis based on CD163-positive macrophage counts. M2 recruitment did not show an obvious correlation with prognostic outcomes.
24
Discussion
We demonstrate an unconventional correlation between subgroup-specific recruitment of TAM in SHH MB with the prognosis. We confirmed subgroup- specific augmentation of M1 and M2 macrophages in SHH MB, and compared it with relevant prognostic factors. Survival analyses and Cox-regression analysis showed that M1 rather than M2 infiltration correlates better with worse OS and PFS in SHH MB with relative risk of 11.918 and 6.022, respectively.
SHH MB subgroup, as suggested by its name, is thought to be driven by the alteration in Sonic-hedgehog signaling pathway [4]. SHH pathway plays a crucial role in cerebellar development, inducing proliferation of neuronal precursors [1, 4].
Individuals with germline or somatic mutations in SHH pathway, such as PTCH, SMO, SUFU, GLI1, and GLI2, are predisposed to MB [1, 4]. Moreover, SHH MB
is known to have intermediate prognosis amongst 4 subgroups, but interestingly, is saturated with highest number of TAM as demonstrated from our study and the previous one [1, 3]. Dichotomous age distribution (< 4 years and > 16 years) is another hallmark of SHH subgroup; our study have shown that age distribution within SHH MB does not significantly correlate with activated macrophage recruitment [1].
The recognition of microenvironment in tumor biology has escalated in the past decades and such emphasis led researchers to characterize contributing factors,
25
including immunophenotypes, in various cancers [8]. However, it was often limited to phenotypic characterization and lacked prognostic connotation. Previous group has investigated TAM recruitment in MB and proposed subgroup-specific recruitment in SHH MB [3]. We sought to verify this phenomenal recruitment in MB by a different method. In fact, we found corroborating results showing augmented TAM recruitment in SHH MB and confirmed its unique microenvironment. Aside from M2 macrophages, we further characterized M1 macrophages in SHH MB and investigated prognostic connotation with their recruitment.
In our study, high M1 macrophages correlated with poor prognosis in SHH MB patients. This result apparently contradicts the common view of M1 macrophages being tumoricidal. In many cancer types, M1 macrophage infiltration is associated with better prognosis [23-25]. However, recent studies suggest that dichotomous M1/M2 classification is oversimplified and the role of TAM in tumors is still controversial [14, 26]. We cannot provide conclusive role of M1 macrophage in SHH MB because causality of worse prognosis associated with M1 macrophages has not been investigated. Though, few possible hypotheses can be made from our result: 1) high M1 macrophage recruitment assists growth and progression of SHH MB contrary to its role in other cancers, or 2) M1 macrophage is highly recruited to enhance tumoricidal effect in aggressive group of SHH MB but this alone was insufficient to fight the particular malignancy, or 3) high M1 recruitment is
26
epiphenomenon and is simply recruited by other SHH MB initiator and does not directly affect the prognosis. Interestingly, literature suggests multiple perspectives.
Loss of nitric oxide synthase2 (NOS2) in Ptch1+/- SHH MB mouse model was reported to promote development of medulloblastoma [27]. NOS2 is a key enzyme that produces nitric oxide in M1 macrophages in response to pathogens [26]. This suggests good prognostic role of M1 macrophage, which supports second hypothesis. On the other hand, direct production of interferon-γ, a known stimulatory cytokine of M1 macrophage, in the developing brain was reported to result in activation of SHH pathway and cerebellar dysplasia. [28]. This may lead to an idea that M1 macrophages are recruited coincidentally in response to the abnormal source of IFN- γ in the developing brain, not in recognition of MB and to destroy it. Such conflicting perspectives may also suggest possibilities of a context-dependent role of TAM.
27
Conclusion
High M1 macrophages recruitment correlated with worse prognostic outcome in SHH MB. Our result is unconventional yet intriguing as the commonly accepted role of M1 macrophages should demonstrate opposite effect. Though, additional follow up studies are required; our study is limited to small number of sample size and heavily dependent on IHC results. Further in vitro and in vivo studies should be implemented to unveil the mechanism and causality of the worse prognostic outcome associated with M1 macrophages in SHH MB.
28
Abbreviations
MB: Medulloblastoma; SHH: Sonic hedgehog; TAM: Tumor associated macrophages; IHC: Immunohistochemistry; IF: Immunofluorescence; PFS:
Progression-free survival; OS: Overall survival; RR: Relative risk, WNT:
Wingless/ Integrated; G3: Group 3; G4: Group4; IRB: Institutional review board;
FFPE: Formalin-fixed paraffin-embedded; PBS: Phosphate-buffered saline;
CD68: Cluster of differentiation 86; CD86: Cluster of differentiation 86; CD163:
Cluster of differentiation 163; NOS2: Nitric oxide synthase2;
29
References
1. DeSouza RM, Jones BR, Lowis SP, Kurian KM: Pediatric medulloblastoma - update on molecular classification driving targeted therapies. Frontiers in oncology 2014, 4:176.
2. Louis DN, Perry A, Reifenberger G, von Deimling A, Figarella- Branger D, Cavenee WK, Ohgaki H, Wiestler OD, Kleihues P, Ellison DW: The 2016 World Health Organization Classification of Tumors of the Central Nervous System: a summary. Acta neuropathologica 2016, 131(6):803-820.
3. Margol AS, Robison NJ, Gnanachandran J, Hung LT, Kennedy RJ, Vali M, Dhall G, Finlay JL, Erdreich-Epstein A, Krieger MD et al:
Tumor-associated macrophages in SHH subgroup of medulloblastomas. Clinical cancer research : an official journal of the American Association for Cancer Research 2015, 21(6):1457- 1465.
4. Taylor MD, Northcott PA, Korshunov A, Remke M, Cho YJ, Clifford SC, Eberhart CG, Parsons DW, Rutkowski S, Gajjar A et al:
Molecular subgroups of medulloblastoma: the current consensus. Acta neuropathologica 2012, 123(4):465-472.
5. Kool M, Korshunov A, Remke M, Jones DT, Schlanstein M, Northcott PA, Cho YJ, Koster J, Schouten-van Meeteren A, van Vuurden D et al: Molecular subgroups of medulloblastoma: an international meta-analysis of transcriptome, genetic aberrations, and clinical data of WNT, SHH, Group 3, and Group 4 medulloblastomas. Acta neuropathologica 2012, 123(4):473- 484.
30
6. Northcott PA, Shih DJ, Remke M, Cho YJ, Kool M, Hawkins C, Eberhart CG, Dubuc A, Guettouche T, Cardentey Y et al: Rapid, reliable, and reproducible molecular sub-grouping of clinical medulloblastoma samples. Acta neuropathologica 2012, 123(4):615-626.
7. Triscott J, Lee C, Foster C, Manoranjan B, Pambid MR, Berns R, Fotovati A, Venugopal C, O'Halloran K, Narendran A et al:
Personalizing the treatment of pediatric medulloblastoma:
Polo-like kinase 1 as a molecular target in high-risk children.
Cancer research 2013, 73(22):6734-6744.
8. Griesinger AM, Birks DK, Donson AM, Amani V, Hoffman LM, Waziri A, Wang M, Handler MH, Foreman NK: Characterization of distinct immunophenotypes across pediatric brain tumor types.
Journal of immunology 2013, 191(9):4880-4888.
9. Kennedy BC, Showers CR, Anderson DE, Anderson L, Canoll P, Bruce JN, Anderson RC: Tumor-associated macrophages in glioma: friend or foe? Journal of oncology 2013, 2013:486912.
10. Komohara Y, Ohnishi K, Kuratsu J, Takeya M: Possible involvement of the M2 anti-inflammatory macrophage phenotype in growth of human gliomas. The Journal of pathology 2008, 216(1):15-24.
11. Herrera M, Herrera A, Dominguez G, Silva J, Garcia V, Garcia JM, Gomez I, Soldevilla B, Munoz C, Provencio M et al: Cancer- associated fibroblast and M2 macrophage markers together predict outcome in colorectal cancer patients. Cancer science 2013, 104(4):437-444.
12. Sica A, Larghi P, Mancino A, Rubino L, Porta C, Totaro MG, Rimoldi
31
M, Biswas SK, Allavena P, Mantovani A: Macrophage polarization in tumour progression. Seminars in cancer biology 2008, 18(5):349-355.
13. Almatroodi SA, McDonald CF, Darby IA, Pouniotis DS:
Characterization of M1/M2 Tumour-Associated Macrophages (TAMs) and Th1/Th2 Cytokine Profiles in Patients with NSCLC.
Cancer microenvironment : official journal of the International Cancer Microenvironment Society 2016, 9(1):1-11.
14. Martinez FO, Gordon S: The M1 and M2 paradigm of macrophage activation: time for reassessment. F1000prime reports 2014, 6:13.
15. Mills CD: Anatomy of a discovery: m1 and m2 macrophages.
Frontiers in immunology 2015, 6:212.
16. Italiani P, Boraschi D: From Monocytes to M1/M2 Macrophages:
Phenotypical vs. Functional Differentiation. Frontiers in immunology 2014, 5:514.
17. Zhang M, He Y, Sun X, Li Q, Wang W, Zhao A, Di W: A high M1/M2 ratio of tumor-associated macrophages is associated with extended survival in ovarian cancer patients. Journal of ovarian research 2014, 7:19.
18. Squadrito ML, De Palma M: A niche role for periostin and macrophages in glioblastoma. Nature cell biology 2015, 17(2):107-109.
19. Barros MH, Hassan R, Niedobitek G: Tumor-associated macrophages in pediatric classical Hodgkin lymphoma:
association with Epstein-Barr virus, lymphocyte subsets, and prognostic impact. Clinical cancer research : an official journal of
32
the American Association for Cancer Research 2012, 18(14):3762- 3771.
20. Williams CB, Yeh ES, Soloff AC: Tumor-associated macrophages:
unwitting accomplices in breast cancer malignancy. NPJ breast cancer 2016, 2.
21. Schneider CA, Rasband WS, Eliceiri KW: NIH Image to ImageJ: 25 years of image analysis. Nature methods 2012, 9(7):671-675.
22. Lee JY, Moon YJ, Lee HO, Park AK, Choi SA, Wang KC, Han JW, Joung JG, Kang HS, Kim JE et al: Deregulation of Retinaldehyde Dehydrogenase 2 Leads to Defective Angiogenic Function of Endothelial Colony-Forming Cells in Pediatric Moyamoya Disease. Arteriosclerosis, thrombosis, and vascular biology 2015, 35(7):1670-1677.
23. Wang XL, Jiang JT, Wu CP: Prognostic significance of tumor- associated macrophage infiltration in gastric cancer: a meta- analysis. Genetics and molecular research : GMR 2016, 15(4).
24. Mei J, Xiao Z, Guo C, Pu Q, Ma L, Liu C, Lin F, Liao H, You Z, Liu L:
Prognostic impact of tumor-associated macrophage infiltration in non-small cell lung cancer: A systemic review and meta- analysis. Oncotarget 2016, 7(23):34217-34228.
25. Edin S, Wikberg ML, Dahlin AM, Rutegard J, Oberg A, Oldenborg PA, Palmqvist R: The distribution of macrophages with a M1 or M2 phenotype in relation to prognosis and the molecular characteristics of colorectal cancer. PloS one 2012, 7(10):e47045.
26. Van Overmeire E, Laoui D, Keirsse J, Van Ginderachter JA, Sarukhan A: Mechanisms driving macrophage diversity and specialization in distinct tumor microenvironments and parallelisms with
33
other tissues. Frontiers in immunology 2014, 5:127.
27. Haag D, Zipper P, Westrich V, Karra D, Pfleger K, Toedt G, Blond F, Delhomme N, Hahn M, Reifenberger J et al: Nos2 inactivation promotes the development of medulloblastoma in Ptch1(+/-) mice by deregulation of Gap43-dependent granule cell precursor migration. PLoS genetics 2012, 8(3):e1002572.
28. Wang J, Lin W, Popko B, Campbell IL: Inducible production of interferon-gamma in the developing brain causes cerebellar dysplasia with activation of the Sonic hedgehog pathway.
Molecular and cellular neurosciences 2004, 27(4):489-496.
34
Korean Abstract
배경: 분자 분석의 최근 진전은 수모세포종에 대한 이해를 증진 시켰으며 질병 관리
에 도움이 될 것으로 기대된다. 수모세포종은 WNT, SHH, Group3와 Group4의 4가지
분자 아형으로 구성되어 있는 것으로 밝혀져 있다. 대식세포는 종양 미세 환경에서
중요한 역할을 하는 것으로 제안되었지만 활성화된 (M1/M2)의 기능적 역할은 여전히
논란이 되고 있다. 여기에서 우리는 종양 관련 대식세포 (TAM), M1 과 M2-대식세포,
수모세포종 아형과 예후 사이의 상관관계를 분석하였다.
방법: 수모세포종 분자 아형은 냉동조직 샘플에서 분리한 RNA를 이용하여
nanoString으로 분석하였다. 하위 그룹이 확인된 시료를 이용하여 면역조직 화학법과
면역 형광 검사를 수행하였고 극성 대식세포 수를 정량화하였다. 생존분석은 수집된
임상데이터 및 정량화된 대식세포 데이터를 이용하여 수행하였다.
결과: SHH 수모세포종에서 종양관련 대식세포 (M1/M2)의 모집은 다른 아형에 비해
유의하게 높았다. Kaplan-Meier 생존 곡선과 다변량 cox 회귀 분석 결과 SHH 수모세
포종의 낮은 발현군에 비해 높은 M1 발현군이 전체 생존율과 무진행생존비율이 각
각 11.918과 6.022의 상대위험도를 보였다.
결론: SHH 수모세포종의 더 나쁜 결과는 M2 보다는 M1와 상관관계가 있다.