Estimation of rice growth parameters by X-band radar backscattering data
YiHyun Kim
1*, SukYoung Hong
1and Hoonyol Lee
21National Institute of Agricultural Science and Technology, Rural Development Administration
2Department of Geophysics, Kangwon National University
* Corresponding author: Tel: +82-31-290-0281; fax: +82-31-290-0282 Email: [email protected]
ABSTRACT
:
Microwave remote sensing has great potential, especially in monsoon Asia, since optical observations are often hampered by cloudy conditions. The radar backscattering characteristics of rice crop were investigated with a ground-based automatic scatterometer system. The system was installed inside a shelter in an experimental paddy field at the National Institute of Agricultural Science and Technology (NIAST) before transplanting. The rice cultivar was a kind of Japonica type, called Chuchung. The scatterometer system consists of X-band antennas, HP8720D vector network analyzer, RF cables, and a personal computer that controls frequency, polarization and data storage. This system automatically measures fully-polarimatric backscattering coefficients of rice crop every 10 minutes, accompanied by a digital camera that takes pictures in a fixed position with the same interval. The backscattering coefficients were calculated by applying a radar equation. Plant variables, such as leaf area index (LAI), biomass, plant height and weather conditions were measured periodically throughout the rice growth season. We have performed polarimetric decomposition of paddy data such as single, double and volume scattering to extract the scattering information effectively. We investigated the relationships between backscattering coefficients and the plant variables.KEY WORDS: Microwave remote sensing, rice crop, scatterometer system, rice growth, backscattering coefficients
1. INTRODUCTION
Microwave remote sensing has great potential, especially in monsoon Asia, since optical observations are often hampered by cloudy conditions. Especially a ground- based polarimetric scatterometer has advantage of monitoring crop conditions continuously using full polarization and various frequencies. Many plant parameters such as leaf area index (LAI), biomass, plant height are highly correlated with backscattering coefficients although the degrees of correlation ard different and according to frequency and polarization between plant parameters and backscattering coefficients was different (Ulaby, 1984; Bouman, 1991; Brisco &
Brown, 1998). Le Toan et al (1997) was among the first that showed the potential of using SAR backscattering data for rice crop monitoring based on both satellite and ground based scatterometer measurements. Hong et al (2000) analyzed RADARSAT data (5.3 GHz, HH- polarization, and incidence angles between 36° and 46°) for monitoring the rice growth and found a good agreement between backscattering coefficients and rice growth parameters in Korea. Polarimetric SAR (POLSAR) has the potential to estimate volume scattering, surface scattering and double bounced scattering through the data decomposition methods. As backscattering coefficients from a ground scatterometer are often
affected by weather condition such as precipitation and wind the necessity of near-continuous automatic measurement has arisen by the experiment of previous year (Kim et al., 2007). In this study, we analyzed scattering characteristics of paddy rice obtained from an automatic scatterometer system and investigated the relationships between backscattering coefficients and the plant parameters.
2. MATERALS AND METHODS
The test site was located in NIAST experimental field (37° 15’ 28.0” N, 126° 59’ 21.5” E) Suwon, Korea. The rice cultivar was a kind of Japonica type, called Chuchung. The size field was about 660m2. The system was installed inside a shelter in an experimental paddy field. The scatterometer system consists of X-band antennas, HP8720D vector network analyzer, RF cables, and a personal computer that controls frequency, polarization and data storage. The VNA-based polarimetric scatterometer operates in a stepped- frequency sweep mode. Polarimetric scatterometer provides a time domain radar return from a target as a fully polarimetric (hh, hv, vh, vv) amplitude and phase data. This system automatically measures fully- polarimatric backscattering coefficients of rice crop every
10 minutes, accompanied by a digital camera that takes pictures in a fixed position with the same interval.
Radar backscattering measurements was begun on 15 May 2008 before the transplanting at a fixed incidence angle of 45°. Growth data for the rice canopy, such as LAI, fresh and dry weight and plant height, have been acquired in a regular basis.
Table 1. Specification of the Automatic scatterometer system
Specification X-Band Center Frequency 9.65 GHz
Bandwidth 1 GHz
Number of Frequency
Points 1601
Antenna Type Dual polarimetric horn
Antenna Gain 22.4dB
Polarization HH, VV, HV, VV Incident Angle 45°
Platform Height 4.16m
Measurement interval 1 per 10minutes
Backscattering coefficients were calculated by applying the following radar equation (Ulaby et al., 1990).
2
r 3 4
P (4 )
t t r
P G G R λ σ
= π (1) Where Gt and Gr are the gains of the transmitting and receiving antennas in the direction of the target, λ is the wavelength, and σ is the RCS of the target.
Backscattering coefficients of each band were calculated as the follow expressions.
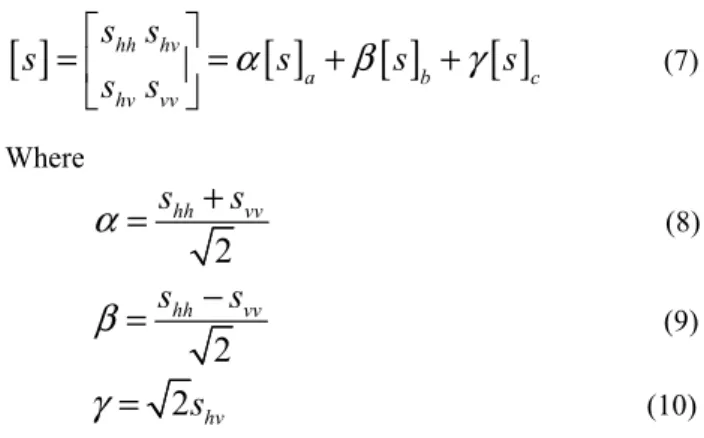
(2) We analyzed pauli decomposition for scattering characters. The Pauli decomposition expresses the measured scattering matrix
[ ] s in the so-called Pauli basis. If we considered the conventional orthogonal linear (h, v) basis, in a general case, the pauli basis is given by the following four 2x2 matrices (Cameron et al., 1990; Pottier et al., 2005)
[ ]
s a 12⎛1 001⎞= ⎜ ⎟
⎝ ⎠ (3)
[ ]
sb 12⎛1 00 1⎞= ⎜⎝ − ⎟⎠ (4)
[ ]
s c 12⎛1 001⎞= ⎜ ⎟
⎝ ⎠ (5)
[ ]
s d 12⎛1 00 1− ⎞= ⎜ ⎟
⎝ ⎠ (6)
It has been always considered that shv=svh, since reciprocity applies in a monostatic system configuration.
Consequently, given a measured scattering matrix
[ ] s , it
can be expressed as follows (Cameron et al., 1990;
Pottier et al., 2005)
[ ]
hh hv[ ]
a[ ]
b[ ]
c hv vvs s s s s s
s s α β γ
⎡ ⎤
= ⎢ ⎥ = + +
⎣ ⎦
(7)Where
2
hh vv
s s
α = +
(8)2
hh vv
s s
β = −
(9)2 s
hvγ =
(10)In general,
[ ] s ais referred to single bounce scattering.
Thus, the complex coefficient α, given at (8), represents the contribution of
[ ] s ato the final measured scattering
matrix. The second matrix, [ ] s brepresents the scattering
mechanism of a dihedral oriented at 0 degrees. In general,
this component indicates a scattering mechanism
characterized by double bounce scattering. Consequently,
β stands for the complex coefficient of this scattering
mechanism. Finally, the third matrix [ ] s c corresponds to
the scattering mechanism of a diplane oriented at 45
degrees. As it can be observed in (4), and considering that
this matrix is expressed in the linear orthogonal basis
(h,v), the target returns a wave with a polarization
orthogonal to the one of the incident wave. From a
qualitative point of view, the scattering mechanism
represented by [ ] s c is referred to those scatterers which
are able to return the orthogonal polarization, from which,
one of the best examples is the volume scattering
produced by the crop or forest canopy (Pottier et al.,
2005).
[ ] s c corresponds to
the scattering mechanism of a diplane oriented at 45
degrees. As it can be observed in (4), and considering that
this matrix is expressed in the linear orthogonal basis
(h,v), the target returns a wave with a polarization
orthogonal to the one of the incident wave. From a
qualitative point of view, the scattering mechanism
represented by [ ] s c is referred to those scatterers which
are able to return the orthogonal polarization, from which,
one of the best examples is the volume scattering
produced by the crop or forest canopy (Pottier et al.,
2005).
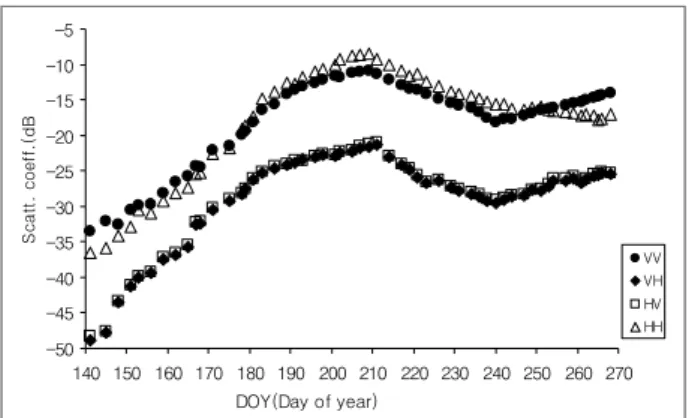
3. RESULTS AND DISCUSSION Backscattering coefficients of paddy fields at X-band range from about -50dB ~ -5dB. Fig. 1 shows temporal variations of backscattering coefficients at polarization and incident angle 45° for the X-band. VV-polarized backscattering coefficients higher than hh- and hv/vh- ones during rooting stage. The hh-, vv-polarized σ°
steadily increased toward panicle initiation stage and thereafter decreased and again increased about mid- September. Change of σ° in X-band at 45° is similar to last year (Kim et al., 2007).
: ( ) 20log 32.21( ) 30log 10logcos X band−
σ
°dB= U+ dB+ R+θ
i-50 -45 -40 -35 -30 -25 -20 -15 -10 -5
140 150 160 170 180 190 200 210 220 230 240 250 260 270 DOY(Day of year)
Scatt. coeff.(dB)
VV VH HV HH
Fig 1. Temporal variations of backscattering coefficients at polarization and incident angle 45° for the X-band.
We have performed polarimetric decomposition of paddy data such as single, double and volume scattering to extract the scattering information effectively. α value which represents single bounce scattering increased as rice growth peaked at panicle formation stage and thereafter decreased. γ value which stand for volume scattering increased toward panicle formation stage and value change lowed. In general, as crop was grow up volume scattering was increased. However, this results α value higher than γ value during rice growth. At present, we analyze scattering characteristics of paddy rice using others decomposition such as krogager, Cameron decomposition.
-0.1 0.0 0.1 0.2 0.3 0.4 0.5
140 150 160 170 180 190 200 210 220 230 240 250 260 270 DOY(Day of year)
α β γ
We conducted a correlation analysis between the backscattering coefficients from band and plant variables such as LAI, biomass and grain weight. The lower frequency bands, such as L and C, were closely related with the mass information of the whole canopy such as LAI, biomass, while the higher-frequency band, such as X, is weakly correlated with them but closely correlated with the other variables such as grain weight (Inoue et al, 2002; Kim et al, 2007).
Table 2 shows relationship between backscattering coefficients in X-band and rice growth parameters.
Backscattering coefficients in X-band were weakly correlated with LAI and biomass. Grain weight was correlated with backscattering coefficients with vv- polarization in X-band.
Table 2. Relationship between backscattering coefficients at X-band and plant variables
LAI Biomass (g/m2)
Plant height(cm)
Grain weight (g/m2) VV 0.43 * 0.48* 0.40* 0.83**
HH 0.68* 0.75** 0.72** 0.62* HV/VH 0.60* 0.68* 0.73** 0.48*
4. CONCLUSIONS
Backscattering coefficients of rice crop were investigated with an automatically-operating ground-based scatterometer. The temporal variations of the backscattering coefficients of the rice crop at X-band during rice growth period. We have performed polarimetric decomposition of paddy data such as single, double and volume scattering to extract the scattering information effectively. We investigated the relationships between backscattering coefficients and the plant parameters.
ACKNOWLEDGMEMTS
This research is supported by Korea Aerospace Research Institute (KARI)
REFERNCES
Bouman, B. A. M., 1991. Crop parameter estimation from ground-based X-band (3-cm wave) radar backscattering data. Remote Sensing of Environment, 37, pp.193– 205.
Brisco, B, and Brwon, R. J., 1998. Agricultural applications with radar. In: F. M. Henderson & A. J.
Lewis (Eds), Principles and applications in imaging radar (pp. 381-406). New York: Wiley.
Cameron. W. L, and L. K. Leung., 1990. Feature- motivated scattering matrix decomposition. Proc. IEEE Radar Conference., Arlington, VA, USA, pp549-557.
Hong, S. Y., Hong, S. H, and Rim, S. K., 2000.
Relationship between Radarsat backscattering coefficient and rice growth. Korean J. Remote Sensing, 16(2). pp.
109-116.
Inoue. Y., Kurosu, T., H, Maeno., S. Uratsuka., T, Kozu., K, Dabrowska-Zielinska, and J. Qi. 2002. Season-long daily measurements of multifrequency (Ka, Ku, X, C and L) and fuu-polarization backscatter signatures over paddy rice field and their relationship with biological variables.
Remote Sensing of Envrionment. 81. pp.194-204.
Kim, Y. H., Hong, S. Y., Lee, E, S., Park, J. S, and Lee, H. Y. 2007. Radar backscattering measurements of paddy rice field using L, C, and X-band polarimetric scatterometer. ISRS2007. pp. 633-636.
Le Toan, T., Ribbes, F.,Wang, L., Floury, Ding, N. K., Kong, J. A., Fujita, M, and Kurosu, T., 1997. Rice crop
mapping and monitoring using ERS-1 data based on experiment and modeling results. IEEE Transactions on Geoscience and Remote Sensing, 35, pp.41–56.
Pottier, E., Lee, J. S, and L. Ferro-Famil., 2005.
PolSARpro-The polarimetric SAR Data processing and Educational tool.
Ulaby, F. T., Allen, C. T., Eger, G, and Kanemasu, E. T., 1984. Relating the microwave backscattering coefficient to leaf area index. Remote Sensing of Environment, 14, pp.113–133.
Ulaby, F. T, and Elachi, C., 1990. Radar Polarimetry for Geoscience Applications, Artech House Inc.