Prediction of growth parameters in paddy rice using L, C, X-band automatic scatterometer system
YiHyun Kim
1*, SukYoung Hong
1, Eunyoung Choe
1and Hoonyol Lee
21National Academy of Agricultural Science, Rural Development Administration
2Department of Geophysics, Kangwon National University
* Corresponding author: Tel: +82-31-290-0345; fax: +82-31-290-0282 Email: [email protected]
ABSTRACT: Radar remote sensing has great potential due primarily to its all-weather day-and-night imaging capabilities. Especially a ground-based polarimetric scatterometer has advantage of monitoring crop conditions continuously using full polarization and various frequencies. Kim et. al. (2008) have measured backscattering coefficients of paddy rice using L-, C-, X-band scatterometer system with full polarization and various angles during the rice growth period and have revealed the necessity of near-continuous automatic measurement to eliminate the effect of weather conditions such as wind, moisture. L-, C-, X-band automatic scatterometer system was installed inside a shelter in an experimental paddy rice field at the National Academy of Agricultural Science (NAAS) before transplanting. The scatterometer system consists of L-, C-, X-band antennas, HP8720D vector network analyzer, RF cables, RF switch and a personal computer that controls frequency, polarization and data storage. This system automatically measures fully-polarimatric backscattering coefficients of rice crop every 10 minutes by RF switch that changes three antennas same interval. The backscattering coefficients were calculated by applying a radar equation.
Plant variables, such as leaf area index (LAI), biomass, plant height and weather conditions were measured periodically throughout the rice growth season. We investigated the relationships between backscattering coefficients in three antennas with full polarization and the plant variables. We studied prediction of growth parameters in paddy rice using L, C, X-radar backscattering data.
KEY WORDS: Radar, polarimetric scatterometer, polarization, backscattering coefficients, growth parameters
1. INTRODUCTION
Rice is one of the major crops in Korea. In spite of its importance as a food source, there have been few attempts to monitor rice growth and study backscattering characteristics with a microwave instrument from space- ground platform. Microwave radar can penetrate cloud cover regardless of weather conditions and can be used day and night. Especially a ground-based polarimetric scatterometer has advantage of monitoring crop conditions continuously using full polarization and various frequencies. Many plant parameters such as leaf area index (LAI), biomass, plant height are highly correlated with backscattering coefficients although the degrees of correlation ard different and according to frequency and polarization between plant parameters and backscattering coefficients was different (Ulaby, 1984;
Bouman, 1991; Brisco & Brown, 1998). Hong et al (2000) analyzed RADARSAT data (5.3 GHz, HH- polarization, and incidence angles between 36° and 46°) for monitoring the rice growth and found a good agreement between backscattering coefficients and rice growth parameters in Korea. As backscattering coefficients from a ground scatterometer are often affected by weather condition such as precipitation and wind. Kim et. al. (2008) have measured backscattering
coefficients of paddy rice X-band automatic scatterometer system which automatically measures fully- polarimatric backscattering coefficients of rice crop every 10 minutes. In this study, we analyzed scattering characteristics of paddy rice obtained from L, C, X-band automatic scatterometer system and investigated the relationships between backscattering coefficients and the rice growth parameters.
2. MATERALS AND METHODS
We made L, C, X-band automatic scatterometer system.
The system was equipped with L-, C-, X-band antennas, and with all combinations of horizontal (H) and vertical (V) polarization. The system consists of dual polarimetric horn antennas, HP8720D vector network analyzer, RF cables, RF switch and a personal computer that controls frequency, polarization and data storage. This system automatically measures fully-polarimatric backscattering coefficients of rice crop every 10 minutes by RF switch that changes three antennas same interval. The VNA- based polarimetric scatterometer operates in a stepped- frequency sweep mode. Polarimetric scatterometer provides a time domain radar return from a target as a fully polarimetric (HH, HV, VH, VV) amplitude and phase data. The system was installed inside a shelter in an
experimental paddy field. The rice cultivar was a kind of Japonica type, called Chuchung. The size field was about 660m2. Radar backscattering measurements was begun on 17 May 2009 before the transplanting at a fixed incidence angle of 45°. Growth data for the rice canopy, such as LAI, fresh and dry weight and plant height, have been acquired in a regular basis.
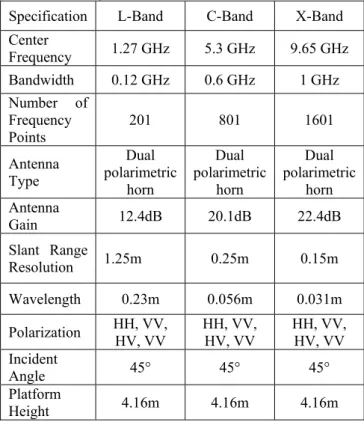
Table 1. Specification of the L, C, X-band automatic scatterometer system
Specification L-Band C-Band X-Band Center
Frequency 1.27 GHz 5.3 GHz 9.65 GHz Bandwidth 0.12 GHz 0.6 GHz 1 GHz Number of
Frequency
Points 201 801 1601
Antenna Type
Dual polarimetric
horn
Dual polarimetric
horn
Dual polarimetric
horn Antenna
Gain 12.4dB 20.1dB 22.4dB
Slant Range
Resolution 1.25m 0.25m 0.15m
Wavelength 0.23m 0.056m 0.031m Polarization HH, VV,
HV, VV HH, VV,
HV, VV HH, VV, HV, VV Incident
Angle 45° 45° 45°
Platform
Height 4.16m 4.16m 4.16m
Backscattering coefficients were calculated by applying the following radar equation (Ulaby et al., 1990).
2
r 3 4
P (4 )
t t r
P G G R λ σ
= π (1) Where Gt and Gr are the gains of the transmitting and receiving antennas in the direction of the target, λ is the wavelength, and σ is the RCS of the target.
Backscattering coefficients of each band were calculated as the follow expressions.
(2) (3) (4) 3. RESULTS AND DISCUSSION Backscattering coefficients of paddy fields at L-band, C- band and X-band ranged from were about -50dB ~ -2dB, -50dB ~ -6dB and -54dB ~ -8dB, respectively. In three bands, VV polarization backscattering coefficients were higher than HH polarization backscattering coefficients during the early growth stage and HH polarization
backscattering coefficients were higher than VV- and cross polarization backscattering coefficients after effective tillering stage (mid-June).
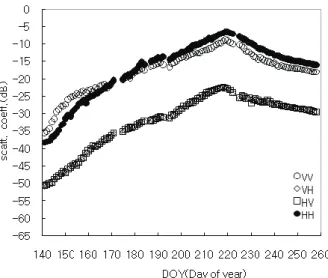
Figure 1 shows the temporal variations of the backscattering coefficients of the rice crop at L-band after transplanting. VV polarization backscattering coefficients higher than HH- and HV/VH polarization backscattering coefficients during rooting stage (mid-Jun). HH-polarized backscattering coefficients increased monotonously with biomass growth until heading stage (mid-Aug) thereafter slowly decreased. Polarimetric decomposition of paddy data such as single, double and volume scattering effectively extract the scattering information. Pottier et. al.
(2005) proposed pauli decomposition for scattering characters. Consequently, given a measured scattering matrix
[ ]
s , it can be expressed as follows .[ ]
hh hv[ ]
a[ ]
b[ ]
c hv vvs s s s s s
s s
α β γ
⎡ ⎤
=⎢ ⎥= + +
⎣ ⎦
(5) Where
2
hh vv
s s
α
= +(6)
2
hh vv
s s
β
= −(7) 2shv
γ
=(8)
α value represents single bounce scattering, β value means double bounce scattering and γ value stand for volume scattering . HH/VV polarization difference show larger after panicle formation stage (late-July). It showed L-band related to double bounce scattering according to rice growth.
Fig 1. Temporal variations of backscattering coefficients : ( ) 20log 21.35( ) 30log 10logcos
L band− σ°dB = U+ dB+ R+ θi : ( ) 20log 30.27( ) 30log 10logcos C band− σ°dB = U+ dB+ R+ θi
: ( ) 20log 32.21( ) 30log 10logcos X band− σ°dB= U+ dB+ R+ θi
at polarization and incident angle 45° for the L-band.
Changes of backscattering coefficients at C-band during the growing period were shown in Figure 2. The HH polarization backscattering coefficients increased as growth until heading stage then decreased.
Fig 2. Temporal variations of backscattering coefficients at polarization and incident angle 45° for the C-band.
Figure 3 shows change in backscattering coefficients at X-band with growth. Backscattering coefficients of range at X-band lower than that of L-, C-band. HH-, VV polarization backscattering coefficients steadily increased toward panicle formation stage and thereafter decreased.
It again increased near the harvesting season. Fresh weight was decreased and heads of the canopy were easily show, so X-band as high frequency sensitive to heading or grain maturity after heading stage. It is generally understood that higher frequencies, like the Ku- and X-bands, are dominated by canopy scattering, while lower frequencies, like the L-, and P-bands, have dominant canopy or significant soil backscatter contributions to total backscatter (Brisco & Brown, 1998).
Fig 3. Temporal variations of backscattering coefficients at polarization and incident angle 45° for the X-band.
Currently, we conducted relationship between the backscattering coefficients from three bands and plant variables such as LAI, biomass and grain weight. We will perform prediction of rice growth parameters using backscattering coefficients in optimum condition.
4. CONCLUSIONS
Backscattering coefficients of rice crop were investigated with an automatically-operating ground-based scatterometer. The temporal variations of the backscattering coefficients of the rice crop at L, C, X- band during rice growth period. VV polarization backscattering coefficients were higher than HH- polarized backscattering coefficients in early rice growth stage, but HH polarization backscattering coefficients were higher than VV- and cross polarization backscattering coefficients after effective tillering stage.
Backscattering coefficients of range at X-band lower than that of L-, C-band and X-band appeared dual-peak trend during rice growth stage.
ACKNOWLEDGMEMTS
This research is supported by Korea Aerospace Research Institute (KARI)
REFERNCES
Bouman, B. A. M., 1991. Crop parameter estimation from ground-based X-band (3-cm wave) radar
backscattering data. Remote Sensing of Environment, 37, pp.193– 205.
Brisco, B, and Brwon, R. J., 1998. Agricultural applications with radar. In: F. M. Henderson & A. J.
Lewis (Eds), Principles and applications in imaging radar (pp. 381-406). New York: Wiley.
Hong, S. Y., Hong, S. H, and Rim, S. K., 2000.
Relationship between Radarsat backscattering coefficient and rice growth. Korean J. Remote Sensing, 16(2). pp.
109-116.
Kim, Y. H., Hong, S. Y., Choe, E. Y and Lee, H. Y., 2008. Estimation of rice growth parameters by X-band radar backscattering data. ISRS2008. pp. 324-327.
Pottier, E., Lee, J. S, and L. Ferro-Famil., 2005.
PolSARpro-The polarimetric SAR Data processing and Educational tool.
Ulaby, F. T., Allen, C. T., Eger, G, and Kanemasu, E. T., 1984. Relating the microwave backscattering coefficient to leaf area index. Remote Sensing of Environment, 14, pp.113–133.
Ulaby, F. T, and Elachi, C., 1990. Radar Polarimetry for Geoscience Applications, Artech House Inc.