NDVI RESPONSES TO THE FOREST CANOPY AND FLOOR IN EASTERN SIBERIA
Rikie Suzuki
a*, Hideki Kobayashi
a, Nicolas Delbart
a,b, Tetsuya Hiyama
c, and Jun Asanuma
da. Frontier Research Center for Global Change, Japan Agency for Marine-Earth Science and Technology, Japan b. Centre d'Etudes Spatiales de la Biosphère (CNRS-IRD-CNES-UPS), France
c. Hydrospheric Atmospheric Research Center, Nagoya University, Japan d. Terrestrial Environment Research Center, University of Tsukuba, Japan
* Corresponding author: [email protected]
ABSTRACT We discuss the Normalized Difference Vegetation Index (NDVI) of the forest canopy and floor separately based on airborne spectral reflectance measurements and simultaneous airborne land surface images acquired around Yakutsk, Siberia in 2000. The aerial land surface images were visually classified into four forest types: no-green canopy and snow floor (Type-1), green canopy and snow floor (Type-2), no-green canopy and no- snow floor (Type-3), and green canopy and no-snow floor (Type-4). The mean NDVI was calculated for these four types. Although Type-2 had green canopy, the NDVI was rather small (0.17) because of high reflection from the snow cover on the floor. Type-3, which had no green canopy, indicated considerably large NDVI (0.45) due to the greenness of the floor. Type-4 had the largest NDVI (0.75) because of the greenness of both the canopy and floor. These results reveal that the NDVI depends considerably on forest floor greenness and snow cover in addition to canopy greenness.
KEY WORDS: Taiga, Snow cover, Aircraft observation, Spectral reflectance, Yakutsk
1. INTRODUCTION
A vegetation index calculated from the difference in spectral reflectance between the red (RED) and near- infrared (NIR) bands is a common method of monitoring vegetation greenness on the land surface using remotely sensed data. The most well known index is the normalized difference vegetation index (NDVI), computed as NDVI = (NIR – RED)/(NIR + RED). The NDVI has been used to estimate the global leaf area index (LAI), which is an important parameter required by ecosystem and atmospheric models as a forcing value for land surface processes. However, especially in sparse forests such as the Siberian taiga, satellite-based sensors measure the total greenness of the forest canopy, as well as viewable parts of the forest floor. Subsequently, the LAI estimated using such an NDVI would involve mixed information for the forest canopy and floor.
Our purpose was to determine the respective roles of forest canopy greenness and forest floor condition in NDVIs calculated from remotely sensed data. The study uses the data set consisted of aircraft observations taken over 9 days from spring to summer 2000 around Yakutsk in eastern Siberia (Hiyama et al., 2003). Using a video camera and spectrometer onboard the hedgehopping aircraft, we obtained thousands of visual images of the forests and simultaneous spectral reflectance measurements including green or non-green canopy and snow floor or green floor conditions. Such information allowed us to examine the canopy NDVI and floor NDVI separately.
2. AIRCRAFT-BASED OBSERVATIONS 2.1
2.2
Geographical aspects of the observation area The land cover of the terraces near Yakutsk is characterised by taiga forest, in which the dominant tree species is larch (deciduous) with some pine (evergreen) and birch (deciduous). The spatial proportions of larch, birch, and pine forest are about 60%, 10%, and 7% over the terrace regions, respectively (Suzuki et al., 2004).
Cowberry, a typical evergreen broadleaf plant in Siberian larch forests, is the major forest floor species. This plant has little clear seasonality, so forest floor conditions are almost unchangeable during periods of no snow (Kobayashi et al., 2007).
Observation days and instruments
The aircraft observations were carried out on 9 days (24 April; 1, 9, 12, 20 May; 1, 5, 9, 19 June) in 2000 (Hiyama et al., 2003). All nine flights followed a fixed course and schedule over about 100 x 100km area near Yakutsk. The flight altitude was 100m and 150m from the land surface.
The aircraft (Ilyushin-18) was equipped with a video movie camera (VMC) and a spectrometer. The VMC was tightly fixed on the floor of the aircraft in a vertical position directed toward the ground through an observation window. Land surface images from the nadir angle were recorded during the flight legs.
A spectrometer (FieldSpec FR), which measures radiances at spectral wavelengths from 350 to 2500 nm at 1-nm intervals, was installed in the aircraft with the
terminal of the optical fibre tightly fixed perpendicular to the aircraft floor and directed downward to view the surface from the nadir angle through an observation window. The FOV of the light collector was 25°.
Measurements had a mean duration of 1 s and occurred every 10 s.
To derive the reflectance of the land surface, spectral observations of global solar radiation were made using the other FieldSpec FR spectrometer at the surface sites.
Reflected radiance from a white reference board exposed to global solar radiation was measured at 1-min intervals during the aircraft flights at the surface sites. Reflectance was calculated as the ratio of airborne values to white reference board values. Data for 1 June and 9 May 2000 were not analysed because of technical reasons.
Consequently, we focused on the data collected on the other 7 days.
3. DATA AND ANALYSES 3.1
3.2
3.3
3.4 Classification of forest condition by video images Analyses were based on the classification database of VMC images created by Suzuki et al. (2004). Land surface scenes at 10-s intervals were sampled from the VMC images. This 10-s sampling interval and timing were accurately synchronised with the sampling timing by the onboard spectrometer. Consequently, 4402 scenes, which were associated with a simultaneous spectral reflectance measurement, were sampled from the VMC images for the 7 days.
Each of the 4402 scenes was interpreted visually and classified according to the forest and land cover
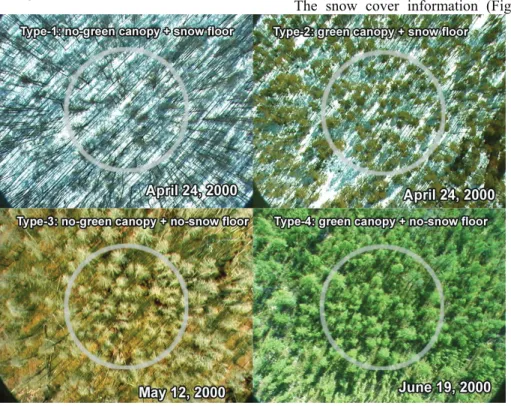
conditions into four types (Fig. 1): Type-1 (276 scenes), no green canopy + snow floor; Type-2 (37 scenes), green canopy + snow floor; Type-3 (202 scenes), no green canopy + no snow floor; and Type-4 (409 scenes), green canopy + no snow floor.
Forest radiative transfer model (FLiES)
To examine the reflectance behaviour in the RED and NIR bands for the four types, we conducted a radiative transfer simulation using a three-dimensional (3-D) canopy radiative transfer model (Forest Light Environmental Simulator (FLiES); (Kobayashi et al., 2007). The model uses a Monte-Carlo-based photon tracing technique for bi-directional reflectance sampling.
The model requires information such as individual tree sizes and positions in the forest canopy to configure the simulation. The forest configuration was acquired from forest census data sets in the larch forest at Ulakhan Sykkhan in Siberia.
SPOT VGT S10 and GLC2000 data
The NDVI value of SPOT-VGT data used were 10- day-composite data (S10) with a resolution of 1 km for year 2000. Moreover, the GLC2000, a global land cover database for the year 2000, was used. We used the pixels of GLC2000 classified either as needle-leaf evergreen forest, needle-leaf deciduous forest, or closed broadleaf deciduous forest.
Snow cover area map
The snow cover information (Fig. 4) was acquired
Figure 1. Typical scenes of the four forest-condition types captured using a video camera. White circle, the land surface that was targeted for visual interpretation.
from the National Oceanic and Atmospheric Administration/National Environmental Satellite, Data, and Information Service (NOAA/NESDIS) and Center for Climate Prediction (CPC) Northern Hemisphere (NH) snow cover data. This data set contains weekly information on the presence or absence of snow cover in each of 89 x 89 square grid boxes on a polar stereographic map that covers most of the Northern Hemisphere.
4. RESULTS 4.1
4.2
Spectral reflectance dependency on forest canopy 4.3 and floor conditions
For the four types and snow scenes, the mean spectral reflectance from 350 to 1200 nm was calculated (Fig. 2).
Although Type-1 showed only the spectral characteristics of the snow, the total reflectance was lower than that of snow because of the presence of trees stems and their shadows. In Type-2, canopy greenness resulted in a significant reflectance gap around 700 nm. However, the total reflectance of Type-2 was high because of reflection from the snow on the floor. Type-3 had no green in the forest canopy, but exposed green vegetation on the floor led to a large gap in the spectral reflectance curve around 700 nm. The magnitude of the gap was similar to that of Type-2, but the total reflectance was lower than in Type- 2 because there was no snow cover. In Type-4, a very large reflectance gap, about double the gaps of Type-2 and Type-3, was found around 700 nm due to the green canopy and green floor.
NDVI dependency on forest canopy and floor conditions
Closed symbols in Fig. 3 delineate the relationship between mean reflectance in RED (620 – 670 nm) and NIR (841 – 876 nm) bands and the resultant NDVI for 4 types according to the aircraft observation. The NDVI of Type-1 was almost the same (mean NDVI of –0.03) as that for the snow surface (–0.09). The reflectance of Type-2 in the RED band was lower (18.1 %) than that (24.0 %) of Type-1 due to green canopy; consequently, the resultant NDVI was larger (mean NDVI of 0.17) than
that of Type-1. However, the elevated reflectance in both the RED and NIR due to snow reflection suppressed the resultant NDVI. Compared with Type-1 and Type-2, Type-3 had much lower reflectance in both the RED and NIR bands due to the absence of snow. However, the resultant NDVI was considerably large (mean NDVI of 0.45), despite the absence of green leaves in the canopy.
Type-4 had the largest NDVI (mean NDVI of 0.75) among the four types. The NIR reflectance was high (18.2%), whereas the RED reflectance was the lowest (2.6%) among the types.
Model-simulated reflectance from the canopy and floor
Figure 3 also demonstrates the simulated forest reflectance by FLiES (open symbols). The simulation and aircraft observations resulted in similar reflectance values for Types-1, 3, and 4; the resultant NDVIs were also similar for the simulation and the observations.
For Type-3, it is simulated that the reflectance from the forest floor occupied the majority (> 95%) of total reflectance in both the RED and NIR bands. This fact strongly reinforces the idea that the large NDVI, which was observed from the aircraft, was a result of forest floor greenness. For Type-4, the proportions of simulated reflectance from the forest canopy and floor were comparable in both the RED and NIR bands. This means that the largest NDVI for the fully foliated forest was a result of roughly equal contributions from forest canopy greenness and forest floor greenness.
The simulated reflectance in the RED band for Type-2 was considerably lower than the observed value. The observed forest for Type-2 was evergreen pine forest, whereas the FLiES model was configured using a deciduous larch forest that was virtually accompanied by green leaves in the snow-covered season. This difference in the actual and modelled forests probably induced the
Figure 3. Model-simulated reflectance (open symbols) and mean reflectance observed using the airborne spectrometer (closed symbols) in the red and near-infrared bands for the four forest-condition types.
The NDVI contours are denoted by straight lines.
Figure 2. Mean spectral reflectance of the four forest- condition types and snow surface. The red (RED) and near-infrared (NIR) bands of MODIS are denoted by yellow and pink bars, respectively.
difference in the spectral reflectance. However, the simulation results for Type-2 give a general idea of the role of forest canopy and floor. The snow-covered forest floor showed 50.8% reflectance in the NIR band and 86.9% in the RED band. This result of the model simulation clearly demonstrates that the high reflectivity of the snow-covered forest floor elevates the reflectance, making the resultant NDVI small.
5. DISCUSSION
The influence of forest floor snow cover on satellite- derived NDVIs can be observed in early spring over the evergreen forest in Siberia. Most of the forested region was covered by snow, and the NDVI was generally small in mid-March (Fig. 4). The NDVI over the evergreen forest zone was slightly larger than that over the deciduous forest. However, the absolute value of the NDVI over the evergreen forest was rather small (~ 0.2) in March. In this season, the evergreen forest likely had green leaves in the canopy, but snow cover on the floor,
similar to Type-2. Thus, despite the fully foliated green leaves of the canopy, the NDVI would have been suppressed by the high reflectance of snow cover on the forest floor in both the RED and NIR bands.
Therefore, for more accurate interpretation of the NDVI distribution over an evergreen boreal forest, the floor snow cover, which can possibly affect the NDVI measurement, should be considered. The use of an index that considers the effect of snow such as the normalized difference water index (NDWI) (Delbart et al., 2006) may help to improve NDVI interpretation for a forest with a snow-covered floor.
6. CONCLUSION
Based on the spectral reflectance and video image data from aircraft-based observations carried out in 2000 over the Yakutsk area, we examined NDVIs for four forest conditions. Despite the large gap in the reflectance between RED and NIR bands for the forest with a green canopy and snow floor (Type-2), the resultant NDVI was rather small (0.17), with the large reflectance from the snow floor suppressing the NDVI. This effect should be important to interpreting the NDVI of evergreen boreal forests in the snow season. Moreover, the NDVI of Type-3 tells us that the forest floor greenness contributes the half of total NDVI. The results suggest the need for careful interpretation of remotely sensed NDVIs for the boreal forest region respecting the forest canopy and floor conditions.
References
Delbart, N., Le Toan, T., Kergoat, L., & Fedotova, V., 2006.
Remote sensing of spring phenology in boreal regions: a free of snow-effect method using NOAA-AVHRR and SPOT-VGT data (1982 – 2004). Remote Sens. Environ., 101, pp.52-62.
Hiyama, T., Strunin, M.A., Suzuki, R., Asanuma, J., Mezrin, M.Y., Bezrukova, N.A., & Ohata, T., 2003. Aircraft observations of the atmospheric boundary layer over a heterogeneous surface in eastern Siberia. Hydrol. Process., 17, pp.2885-2911.
Kobayashi, H., Suzuki, R., & Kobayashi, S., 2007. Reflectance seasonality and its relation to the canopy leaf area index in an eastern Siberian larch forest: multi-satellite data and radiative transfer analyses. Remote Sens. Environ., 106, pp.238-252.
Suzuki, R., Hiyama, T., Asanuma, J., & Ohata, T., 2004. Land surface identification near Yakutsk in eastern Siberia using video images taken from a hedgehopping aircraft. Int. J. Remote Sensing, 25, pp.4015-4028.
Acknowledgements Figure 4. Distribution of evergreen forest (black) and
deciduous forest (grey) derived from GLC2000 (upper) and the distribution of SPOT-VGT NDVI values for the middle 10 days of March 2000 and the snow cover distribution from 13 to 19 March 2000 (middle).
Seasonal changes in mean NDVI from SPOT-VGT in the evergreen (solid line) and deciduous (dashed line) forests (bottom) in 2000.
We are grateful to Dr. Hironori Yabuki at the Institute of Observational Research for Global Change, JAMSTEC; Dr.
Yoshiyuki Ishii, Institute of Low Temperature Science, Hokkaido University; and Dr. Hiroki Tanaka, Graduate School of Environmental Studies, Nagoya University for providing us the forest census data. We express our sincere thanks to Prof.
Toshio Koike, Department of Civil Engineering, University of Tokyo, for giving us the opportunity to use the FieldSpec FR.